Abstract
Circadian rhythms in neuronal ensemble, subpopulations, and single unit activity were recorded in the suprachiasmatic nuclei (SCN) of rat hypothalamic slices. Decomposition of the ensemble pattern revealed that neuronal subpopulations and single units within the SCN show surprisingly short periods of enhanced electrical activity of ≈5 h and show maximal activity at different phases of the circadian cycle. The summed activity accounts for the neuronal ensemble pattern of the SCN, indicating that circadian waveform of electrical activity is a composed tissue property. The recorded single unit activity pattern was used to simulate the responsiveness of SCN neurons to different photoperiods. We inferred predictions on changes in peak width, amplitude, and peak time in the multiunit activity pattern and confirmed these predictions with hypothalamic slices from animals that had been kept in a short or long photoperiod. We propose that the animals' ability to code for day length derives from plasticity in the neuronal network of oscillating SCN neurons.
The suprachiasmatic nuclei (SCN) contain a major pacemaker of circadian rhythms in mammals (1, 2). The SCN control circadian rhythms in the central nervous system and peripheral organs and as such ensures that organisms are able to anticipate and adjust to predictable changes in the environment that occur with the day–night cycle (3–5). The SCN is also involved in adaptation of the organism to the annual cycle by monitoring seasonal changes in day length (6). As an example, animals will accommodate their daily behavioral activity to the photoperiod. A multioscillator structure has been proposed to fulfill this dual task (7).
At least nine candidate genes have been identified that play a role in rhythm generation on the basis of a transcriptional–translational feedback loop (8, 9). A number of additional genes may be involved to further refine or shape circadian rhythms (10). Although great progress has been made in understanding the molecular basis for circadian rhythm generation, it is unknown how individual neuronal activity rhythms are integrated to render a functioning pacemaker that is able to code for circadian and seasonal rhythms. The SCN each contain ≈10,000 neurons, which are small and densely packed (11). After dissociation, isolated SCN neurons express circadian rhythms in their firing patterns (12, 13). The freerunning periods of the individual neurons vary from 20 to 28 h. The average period matches the behavioral activity pattern of ≈24 h. In these cultured dispersals, synaptically coupled neurons can sometimes be observed with synchronized firing patterns (14). In SCN tissue explants cultured on multielectrode plates, the variation in free-running period is considerably smaller (15–17). In these explants, firing patterns can be observed which are in phase, or 6–12 h out of phase. The range of phase relationships observed within the SCN in vitro suggests a level of temporal complexity that challenges our understanding of how a singular phase and period is obtained for control of behavior.
In the present study we measured the circadian discharge pattern of small neuronal subpopulations on the basis of spike amplitude. Additionally, we applied cluster analysis to determine the circadian activity profile of single units that were extracted from the multiunit signal on the basis of their waveform. The data show that the multiunit signal of the SCN consists of the concerted activity of small neuronal subpopulations or single units that differ substantially from each other in phase and that express by themselves only short durations of increased electrical activity. The summed neuronal activities resembled the ensemble activity pattern and showed consistent peak times during mid day. On the basis of these results, we propose that phase relations between oscillating neurons may provide information that can code for day length.
Methods
Electrophysiological Recording. The multiunit activity rhythms of SCN neurons were measured as described (18). Male Wistar rats were entrained to a light–dark cycle (e.g., L/D = 12:12). Coronal slices (500 μm) were prepared at the beginning of the subjective day and kept submerged (100–150 μm) with a thin fork in a laminar flow chamber (35.5°C). The slices contained at least 50% of the rostro-caudal extent of the SCN, and all of the ventro-dorsal extent. Extracellular electrical activity of populations of SCN neurons were simultaneously measured from left and right or dorsal and ventral SCN by platinum/iridium electrodes and subsequently amplified, bandwidth-filtered, and sampled at a rate of 25 kHz for more than one circadian cycle (19, 20). Action potentials with signal-to-noise ratio of 2:1 (noise ≤ 5μV from baseline) were selected by spike triggers, counted electronically every 10 sec and stored for off-line analysis. The positions of the electrodes and spike trigger settings were not changed during the experiment. Spikes larger than a preset amplitude were discriminated online and the spike amplitude and time of occurrence were stored on disk. The same signal was sampled in parallel on another channel at 56 kHz. On this channel, the waveform of individual spikes (≥-12 μV from baseline) were saved (Power1401 with SPIKE2 software, CED, Cambridge, U.K.).
Data Analysis. The phase of circadian discharge rhythms were determined by analyzing the time of maximal discharge rate as described (19). In short, raw discharge patterns were moderately smoothed with P splines (smoothing parameter = 109 unless stated otherwise) to remove noise. Data are given ± SEM. The significance of phase differences between recordings was determined by Monte Carlo simulations.
Subpopulations in the multiunit recordings were constructed on the basis of spike amplitude, sorted by using the B-tree sorting algorithm of BERKELEYDB (Sleepycat, Lincoln, MA), and correlated with distance to electrode tip. When, alternatively, subpopulations were determined on the basis of an equal number of discharges per subpopulation, qualitatively similar results were obtained.
For each subpopulation, circadian activity patterns were determined. The width of the activity pattern was defined as 2(T50% - Tmax) with Tmax being the time of maximal activity and T50% being the time of half maximum activity at the declining slope.
We applied cluster analysis on the spike waveform data to isolate and verify single unit activity from the multiunit signal (see Figs. 8 and 9, which are published on the PNAS web site). The validity of the clusters was determined by using interval histograms and autocorrelograms. A clear refractory period, seen as a zero beginning in the autocorrelogram, was used to validate the cluster being a true single unit.
Results
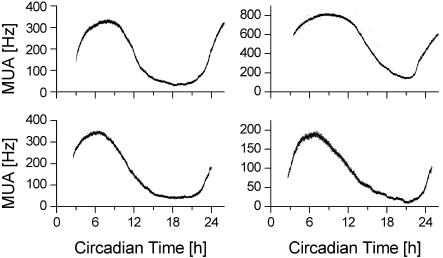
Phase Differences Between SCN Regions. We performed dual recordings of multiunit activity in 26 experiments. All experiments yielded raw data traces with low variability (Fig. 1) and showed high activity during the mid of the projected light phase (mid-subjective day) and low activity during the projected dark phase (mid-subjective night). Simultaneous recordings from the left and right SCN revealed that activity patterns showed small but significant phase differences (1.13 h ± 0.2, range: 0.25–3.4 h, n = 18, P < 0.001). Unilateral recordings in dorsal and ventral SCN revealed similar phase differences within SCN regions (0.89 h ± 0.17, range: 0.3–1.65 h, n = 8, P < 0.001). There was no significant preference for any of the investigated areas to be consistently advanced or delayed (left advanced vs. right, 9:9; dorsal advanced vs. ventral, 3:5).
Fig. 1.
Four examples of multiunit activity patterns of SCN neurons recorded with stationary electrodes. Electrical discharge is shown as a function of CT. CT 0 corresponds with the onset of the projected light phase and CT 12 with the onset of the projected dark phase. Circadian discharge patterns show a peak in electrical activity during the mid-subjective day.
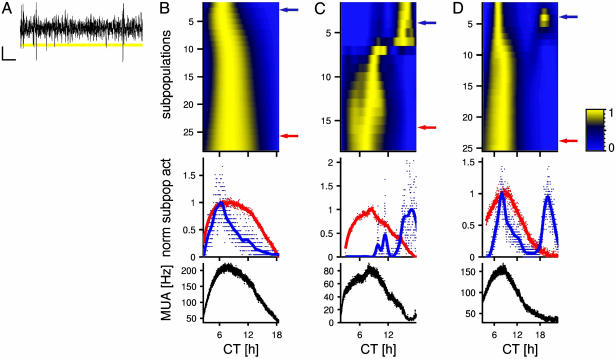
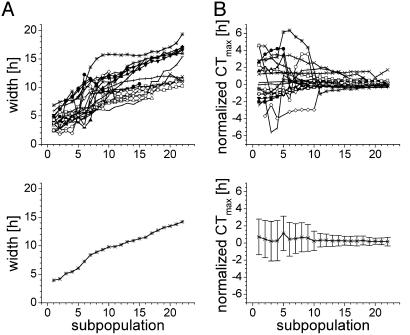
Phase and Shape Differences Within SCN Regions. Subpopulations were selected from multiunit signals on the basis of the amplitude of spikes (Fig. 2A) in 18 recordings. The circadian discharge pattern and times of maximal firing appeared to vary considerably (Fig. 2 B–D). Subpopulations with large spikes, consisting of relatively few contributing neurons, showed large phase differences and in some cases sudden transitions in phase occurred or subpopulations in antiphase were visible. In contrast, subpopulations with small spikes, that consist of more contributing neurons, showed a maximal firing rate at the mid of the subjective day (Fig. 2 B–D), corresponding with our multiunit activity data. The decreasing variability in time of maximal firing suggests that the circadian discharge patterns are stabilized when more neurons from a larger area within the SCN contribute to the recording (SD vs. spike amplitude, r = -0.907, P < 0.001; Fig. 3B).
Fig. 2.
Subpopulations within SCN regions show phase differences in electrical activity. (A) Spikes with amplitudes that fell in a certain range were grouped together. (Scale bars are 10 msec by 10 μV.) (B) Color bands represent smoothed neuronal activity rhythms, with high activity plotted in yellow and low activity in blue (see normalized scale bar). Color bands on top represent subpopulations with large amplitude spikes (close to the electrode tip), whereas toward the bottom they represent subpopulations with smaller amplitudes (that are farther away). Normalized discharge patterns of two selected subpopulations (marked by a blue and red arrow) are plotted separately. Dots represent averaged discharge rate per minute. Smoothed activity is indicated by a line; the smoothing parameter was set to 105. The peak in firing rate with large amplitude spikes (blue arrow) was relatively advanced in time, and its peak was narrow. The sum of the neuronal activity rhythms of all subpopulations is plotted versus CT at the bottom in black. The shape of this pattern resembled that of the subpopulation marked with the red arrow. (C) The neuronal activity close to the electrode tip (large amplitudes) showed a maximal firing rate at CT 16.1, whereas farther away from the tip, a discontinuous shift in peak time is visible and peaks occurred around CT 8. Plotting conventions are as in B.(D) A second peak of multiunit activity is visible that is in antiphase with the main peak. Plotting conventions are as in B.
Fig. 3.
Width and phase of neuronal subpopulations. (A)(Upper) The width of neuronal activity patterns of subpopulations in each experiment is plotted on the y axis as a function of the spike amplitude of the recorded population. Subpopulation 1 corresponds with the highest amplitude spikes, which originate from small neuronal populations close to the electrode tip. Smaller amplitude spikes are generated by larger groups of neurons, further away from the tip. Data from a single recording are connected with a line. (Lower) The mean width of the populations is plotted against the spike amplitude of the population. The data illustrate that neurons that are located close to one another (large amplitude spikes) show synchronized activity and render narrow peaks as a result. (B) (Upper) The time of maximal firing rate of each subpopulation from each experiment is plotted and connected with a line. The times are relative to the peak-time in the subpopulation with the smallest spikes. The peak times appeared to vary considerably between subpopulations, and showed large phase jumps (see also Fig. 2). (Lower) The mean and standard deviation of the times of maximum firing are plotted. The standard deviation was larger in the subpopulations with large spikes than in those with small spikes.
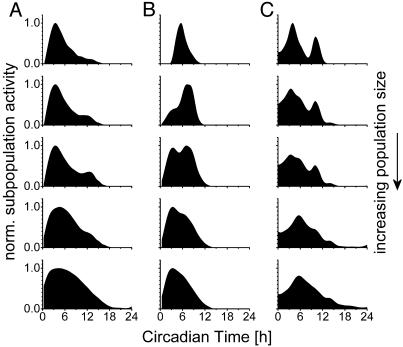
A second difference between the small and large subpopulations existed with respect to the width of the circadian peaks in electrical activity. Subpopulations in the vicinity of the electrode tip showed narrow peaks of neuronal activity (Fig. 2 B–D, middle plots). These subpopulations expressed peaks in electrical activity of 3.97 h ± 0.36 (range: 2.36–6.9 h, n = 18) indicating that the subpopulations showed electrical activity >50% of their maximum for only very short periods of time. In contrast, subpopulations with small amplitude spikes showed broader peaks, corresponding with the multiunit activity data (width versus spike amplitude, r = -0.699, P < 0.001; Fig. 3A). The broadening of the peaks that is visible when more neurons are being recorded can be best observed by plotting the subpopulation electrical activity in a cumulative way. When an increasing number of neurons around the electrode tip is included, it becomes clear that the ensemble electrical activity is built up from multiple components, and stabilizes with a broad peak at around circadian time 6 (CT6) (Fig. 4).
Fig. 4.
Three examples of cumulative electrical activity of SCN subpopulations. (A) (Top) Normalized activity of a small subpopulation close to the electrode tip. From top to bottom, an increasing number of neurons is recorded, by decreasing the minimum amplitude of the accepted spikes (-29, -24, -20, -15, and -9 μV, respectively). (B) Minimum spike amplitude from top to bottom: -28, -19, -17, -15, and -10 μV. (C) Minimum spike amplitude from top to bottom: -22, -18, -16, -15, and -8 μV. Data illustrate how the neuronal ensemble activity is build up from heterogeneous components in the SCN.
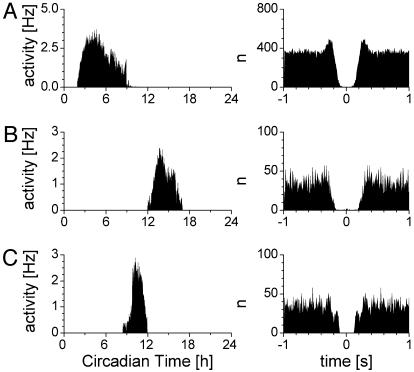
Neuronal Activity Patterns of Single Units. In seven experiments we successfully isolated single unit activity (n = 10) from the multiunit signal after cluster analysis (see Figs. 8 and 9). The single unit activity peaks were narrower than the multiunit population peaks (single: 4.4 ± 0.6, range: 0.5–6.8 h; multiunit: 12.38 h ± 0.42, P < 0.001) and the times of maximal firing rate of the single units occurred at different phases of the circadian cycle (Fig. 5). Some units peaked during the subjective night, in antiphase with the peak in multiunit activity, whereas other units peaked at mid-subjective day. The circadian discharge pattern of single units resembled the patterns of the small subpopulations close to the electrode tip (as shown in Fig. 2) with respect to the narrow peak width, and the large range in peak times.
Fig. 5.
Three examples of single unit activity recordings. Single unit circadian activity patterns are narrow and are found throughout the circadian cycle mainly during the day. Neuronal discharge of single units were isolated on the basis of cluster analysis. (Left) Neuronal activity was determined in 2-min bins and plotted in Hertz as a function of CT. (Right) The autocorrelogram was computed for each single unit over the whole recording period and show a clear refractory period around the zero interval. It is apparent that individual SCN neurons show asynchronous circadian activity rhythms with short durations of electrical activity.
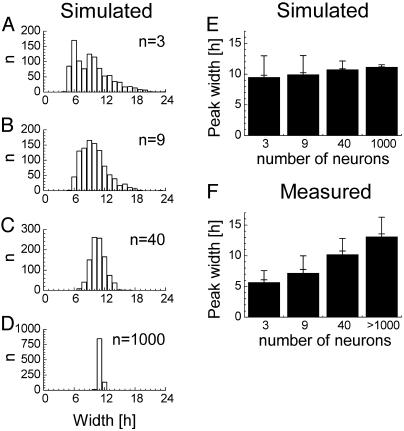
Simulations of Neuronal Discharge Patterns. To investigate whether the decrease in peak width is a trivial finding when gradually fewer neurons located close to one another are recorded, multiunit circadian discharge patterns were simulated on basis of the recorded single unit patterns. We simulated 1,000 drawings from a population of 3, 9, 40, and 1,000 neurons and measured the obtained peakwidth and variance (Fig. 6 A–D). The average width of the simulated peaks appeared to decrease only slightly with decreasing number of units in the simulated population, whereas the standard deviation in peak widths showed a strong increase (Fig. 6E). Although the results presented here are based on a Gaussian distribution, other statistical distributions result in identical trends. In the recordings, however, the width of the peaks declined with a decreasing number of contributing units whereas the standard deviation remained roughly the same (Fig. 6F). The discrepancies between the simulated and measured patterns demonstrate that SCN neurons are not randomly distributed in phase but are more synchronized when located close to one another.
Fig. 6.
Simulated peak width and its SD as a function of population size. The simulations were based on the measured average single unit activity pattern. (A–D) After 1,000 drawings, the resulting width at half-maximal height is plotted for groups consisting of 3, 9, 40, and 1,000 neurons. (E) Summary of results from A–D, with SEM and SD. The SD in obtained peak widths depends strongly on the number of neurons, and the average width is minimally dependent upon the number of units in the simulation. (F) Summary of measured peak widths with SEM and SD. The number of neurons in the subpopulations were estimated on the basis of the measured integrated single unit frequency.
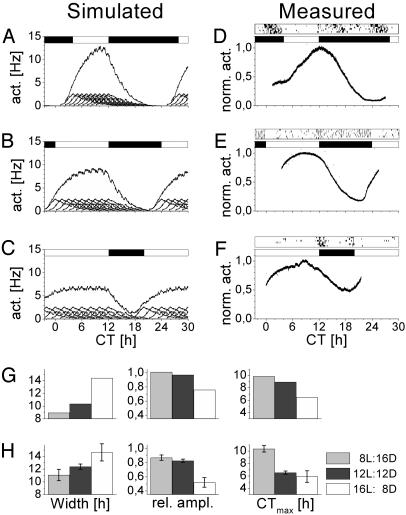
Phase Differences Contribute to Photoperiod Adaptation. On the basis of our single unit recordings, we calculated an average pattern of single unit activity. We used this average to simulate multiunit activity patterns under different photoperiods (Fig. 7 A–C). The phase distribution was related to the duration of light in the simulated photoperiod. The phases of the neurons were equally distributed over 8, 12, and 16 h to simulate a short, normal, and long photoperiod, respectively. On the basis of these simulations, we found three differences in the multiunit activity pattern. (i) Peaks of the population patterns increased in width with the longer photoperiods and decreased with simulated short photoperiods. (ii) The amplitude of the peaks decreased in long photoperiods and increased in short photoperiods. (iii) The time of maximal firing (relative to Zeitgeber time 12; light off) advanced in long photoperiods and delayed in short photoperiods. We used the outcomes of the simulation to serve as predictions for a next series of experiments.
Fig. 7.
Phase differences between neurons contribute to photoperiod adaptation of the SCN. (A–C) Simulated effects of day length on SCN neuronal activity. Simulations were based on the average firing pattern of recorded single units. Nine individual firing patterns are plotted on the abscissa together with the resulting multiunit pattern. (A–C) Simulations of photoperiods L/D 8:16, 12:12, and 16:8, respectively. White bars represent daytime, and black bars represent nighttime. Simulation of a short photoperiod by a small distribution in phase of constituting neurons (A) resulted in a narrow population pattern with a high amplitude rhythm. Simulation of longer photoperiods by larger phase distribution of the neurons (B and C) rendered lower-amplitude rhythms with a broader peak. Maximum firing rate shifts from later to earlier times when day length increases relative to onset of darkness (CT12). (D–G) Measured effects of day length on SCN neuronal activity. (D) Example of neuronal activity pattern recorded in a slice from an animal kept on a short photoperiod. The animal's running wheel actvity pattern in the 6 days preceding slice preparation is indicated above the recording. (E) Example of a recording of an animal kept in a normal photoperiod. (F) Example of a recording from a long photoperiod. Width, relative amplitude, and peak time of the simulated (G) and measured (H) discharge patterns ± SEM are shown (see text for significance).
Neuronal activity of populations of SCN neurons were recorded in slices from animals that had been entrained to a long or short photoperiod and showed a clear response in their behavioral activity pattern. For animals that had been exposed to long photoperiods (n = 5), the population discharge pattern appeared to have increased in width, decreased in amplitude, and advanced in the time of maximal firing. For animals that had been exposed to short photoperiods (n = 5), the multiunit peak width was narrower, the amplitude was increased and the time of maximal firing was delayed. All differences between the long and short day animals were significant (ANOVA, P < 0.05). These results are consistent with the changes that were predicted by the simulations (Fig. 7 D–G).
Discussion
With an innovative recording technique, we were able to simultaneously record the activity of many subpopulations derived from one multiunit electrode. In this study, the technique was successfully applied to describe the transitions from near single unit to population discharge patterns. Because the electrical signal decays with distance, large amplitude spikes are generated by neurons that are in close proximity to the recording electrode. It can be calculated that intercellular distance of SCN neurons is ≈25 μm, rendering at most seven neurons under the flat surface of the 75-μm electrode tip. Subpopulations in the vicinity of the tip were found to vary considerably in phase and shape (Figs. 2, 3, 4). With decreasing spike amplitude, the subpopulations became larger and consisted of neurons that were also located at larger distance from one another. The concomitant circadian discharge pattern became increasingly wider (the peak in electrical activity broadened) and eventually resembled the ensemble population pattern. The time of maximal firing stabilized at around CT 6 (or mid-subjective day) in these groups. These results are also consistent with the rather small phase differences that we measured between the left and right SCN (17) and the dorsal and ventral SCN, as these recordings involved large neuronal populations.
Single Unit Discharge Pattern. Recording of waveform and subsequent cluster analysis is an experimentally verified method. When this method was used, single unit activity could be extracted out of a multiunit signal. The overall success rate of this technique was low because 7 of 26 experiments yielded verified single unit activity for a long recording period and led to the characterization of 10 units. In the remaining 19 experiments, clusters were either not well separated (n = 10) or did not meet the criteria (n = 9). The strict criteria for cluster validation on the other hand resulted in single units of high quality. The peak times of neuronal activity varied strongly between the recorded neurons and were observed during both subjective day and night. The measured neurons were active for relatively short periods, up to 7 h. Their peak widths are very similar to the widths observed in the smallest subpopulations, indicating that these may have been near single neuron recordings as well. On the basis of both findings, we conclude that neurons in the SCN have short durations of increased neuronal activity.
With simulations of neuronal activity patterns we verified that the observed trend in peak width is not a trivial result when gradually more (or fewer) neurons are recorded. The simulations showed that a random distribution of phases within the SCN cannot account for the decrease in peak width when small numbers of neurons are recorded (Fig. 6). The interpretation of our experimental results is that the phase of neurons that are located close to one another is correlated, i.e., that groups of neurons in the SCN show some synchronization as a function of interneuronal distance. On the other hand we observed discontinuous changes in phase when we scanned through subregions of the SCN on basis of spike amplitude. This would be in agreement with the existence of small patches of relatively synchronized neurons. We conclude that SCN neurons show synchronized activity as a function of interneuronal distance, but only to some extent.
It is unknown whether the results obtained in vitro match those obtained in vivo. At present, we are unable to perform long-term single unit recordings with similar criteria in vivo. We consider that the acute slice preparation contains 50–100% of the anterior–posterior plane of the SCN and has left intact most of the integrity of inter-SCN communication. However, most of the afferent connections have been cut off, which strongly diminishes the effects of extra SCN areas on SCN functioning. With respect to our finding that single units and subpopulations are active for only short durations of activity, we consider it unlikely that the in vivo situation changes this result drastically such that neurons become active for the full duration of the photoperiod. This view is supported by the findings that many neurons in the SCN, when sampled for short periods of time in vivo, are in their silent phase (21). We conclude that circadian waveform of electrical activity in the SCN is determined by heterogeneity in oscillating neurons and that multiunit discharge patterns are build up from subpopulations or individual neurons that exhibit narrow activity peaks and differ from one another in phase.
Phase Differences Contribute to Day Length Adaptation. Our data prompted us to investigate whether changes in phase differences between neurons could underlie adaptation to photoperiodic changes. To test the implications of changing phase relationships for the ensemble population pattern, we performed simulations by using the average recorded single unit activity pattern with a homogeneous distribution of these units over the day (Fig. 7). Multiunit activity patterns were then recorded from animals entrained to a long and short photoperiod to investigate whether the multiunit discharge patterns that were predicted by the simulations could be observed. We found that (i) the width of the multiunit peaks was increased in long photoperiods and decreased in short photoperiods, (ii) the amplitude of multiunit activity peaks was decreased in long photoperiods and increased in short photoperiods, and (iii) the CT of maximal firing was advanced after entrainment to a long photoperiod and delayed after entrainment to short photoperiods. These changes were consistent with our predictions. We conclude that alterations in phase differences between oscillating SCN neurons can explain photoperiodic adaptation.
Mechanisms for synchronization between SCN neurons may be nonsynaptic (22) or synaptic (14). Nonsynaptic synchronization may involve electrical coupling via gap junctions and ionic mechanisms (22–24) or paracrine factors such as nitric oxide (25), whereas synaptic coupling may involve γ-aminobutyric acid (26). Potentially, these mechanisms may also account for photoperiodic regulation of synchronization between SCN neurons.
A valid question is whether other explanations exist that can also account for the observed changes in SCN neuronal ensemble activity. To that purpose, we performed additional simulations in which we supposed that it is not the phase relationship between neurons that varies with photoperiod, but the width of the single unit peak. However, a change in duration of single unit activity alone could not account for the observed trends in peaks width or amplitude. However, we cannot exclude that single units adjust their activity period under different photoperiods, and that this serves to further support photoperiodic adaptation. The very short periods of increased neuronal activity measured both in single units and in small neuronal populations (mean: <5 h) from rats on a 12-h light regimen demonstrates that single unit activity by itself provides an insufficient explanation for photoperiodic adaptation.
The changes in amplitude and time of maximal firing have not been addressed before when evaluating the effects of photoperiod on SCN neuronal ensemble activity. The increased width in multiunit activity patterns that we observed is consistent with the increased peak width in multiunit activity in the hamster (27), in patterns of c-fos and arginine vasopressin mRNA expression in the rat (28, 29), in clock gene expression in the rat (30), and in patterns of Per expression in the hamster (31–33). The data on protein and mRNA expression are comparable with the multiunit data in that they represent responses of grouped neurons to different photoperiods. Our data have indicated that individual neurons or small neuronal populations show activity patterns that deviate from the ensemble pattern. Possibly, individual neurons show relatively short periods of increased gene expression, whereas between neurons, these periods do not necessarily overlap. Molecular evidence has been obtained that populations within the SCN show regional heterogeneity (34–39) and multiple phase relationships among SCN cells have been shown by recording Per1-driven GFP fluorescence.∥ Our hypothesis that the SCN consists of multiple components that show plasticity in their mutual phase relationship to adopt the photoperiod is conceptually new and of importance for molecular research on photoperiodic encoding at the subpopulation or single unit level.
Supplementary Material
Acknowledgments
We thank Hans Duindam and Jan Janse for technical and electronical assistence, and Joe S. Takahashi and Cyriel A. M. Pennartz for valuable comments on our manuscript.
Abbreviations: SCN, suprachiasmatic nuclei; CT, circadian time.
Footnotes
Quintero, J. E., Kuhlman, S. J., Speck, D. F. & McMahon, D. G. (2000) Neurosci. Abstr. 26, 205 (abstr.).
References
- 1.Meijer, J. (2001) in Handbook of Behavioral Neurobiology, eds. Takahashi, J. S., Turek, F. W. & Moore, R. Y. (Kluwer Academic/Plenum, New York), Vol 12, pp. 183-222. [Google Scholar]
- 2.Ralph, M. R., Foster, R. G., Davis, F. C. & Menaker, M. (1990) Science 247, 975-978. [DOI] [PubMed] [Google Scholar]
- 3.Moore, R. Y. & Eichler, V. B. (1972) Brain Res. 42, 201-206. [DOI] [PubMed] [Google Scholar]
- 4.Yamazaki, S., Numano, R., Abe, M., Hida, A., Takahashi, R., Ueda, M., Block, G. D., Sakaki, Y., Menaker, M. & Tei, H. (2000) Science 288, 682-685. [DOI] [PubMed] [Google Scholar]
- 5.Abe, M., Herzog, E. D., Yamazaki, S., Straume, M., Tei, H., Sakaki, Y., Menaker, M. & Block, G. D. (2002) J. Neurosci. 22, 350-356. [DOI] [PMC free article] [PubMed] [Google Scholar]
- 6.Gorman, M. R., Goldman, B. D. & Zucker, I. (2001) in Handbook of Behavioral Neurobiology, eds. Takahashi, J. S., Turek, F. W. & Moore, R. Y. (Kluwer Academic/Plenum, New York), Vol. 12, pp. 481-510. [Google Scholar]
- 7.Pittendrigh, C. S. & Daan, S. A. (1976) J. Comp. Physiol. A 106, 333-355. [Google Scholar]
- 8.Allada, R., Emery, P., Takahashi, J. S. & Rosbash, M. (2001) Annu. Rev. Neurosci. 24, 1091-1119. [DOI] [PubMed] [Google Scholar]
- 9.Lowrey, P. L. & Takahashi, J. S. (2000) Annu. Rev. Genet. 34, 533-562. [DOI] [PubMed] [Google Scholar]
- 10.Shimomura, K., Low-Zeddies, S. S., King, D. P., Steeves, T. D. L., Whiteley, A., Kushla, J., Zemenides, P. D., Lin, A., Vitaterna, M. H., Churchill, G. A. & Takahashi, J. S. (2001) Genome Res. 11, 959-980. [DOI] [PubMed] [Google Scholar]
- 11.Van den Pol, A. N. (1980) J. Comp. Neurol. 191, 661-702. [DOI] [PubMed] [Google Scholar]
- 12.Welsh, D. K., Logothetis, D. E., Meister, M. & Reppert, S. M. (1995) Neuron 14, 697-706. [DOI] [PubMed] [Google Scholar]
- 13.Liu, C., Weaver, D. R., Strogatz, S. H. & Reppert, S. M. (1997) Cell 91, 855-860. [DOI] [PubMed] [Google Scholar]
- 14.Shirakawa, T., Honma, S., Katsuno, Y., Oguchi, H. & Honma, K.-I. (2000) Eur. J. Neurosci. 12, 2833-2838. [DOI] [PubMed] [Google Scholar]
- 15.Herzog, E. D., Geusz, M. E., Khalsa, S. B., Straume, M. & Block, G. D. (1997) Brain Res. 757, 285-290. [DOI] [PubMed] [Google Scholar]
- 16.Herzog, E. D., Takahashi, J. S. & Block, G. D. (1998) Nat. Neurosci. 1, 708-713. [DOI] [PubMed] [Google Scholar]
- 17.Nakamura, W., Honma, S., Shirakawa, T. & Honma, K. (2001) Eur. J. Neurosci. 14, 666-674. [DOI] [PubMed] [Google Scholar]
- 18.Meijer, J. H., Schaap, J., Watanabe, K. & Albus, H. (1997) Brain Res. 753, 322-327. [DOI] [PubMed] [Google Scholar]
- 19.Schaap, J., Albus, H., Eilers, P. H., Detari, L. & Meijer, J. H. (2001) Neuroscience 108, 359-363. [DOI] [PubMed] [Google Scholar]
- 20.Albus, H., Bonnefont, X., Chaves, I., Yasui, A., Doczy, J., Van der Horst, G. T. J. & Meijer, J. H. (2002) Curr. Biol. 12, 1130-1133. [DOI] [PubMed] [Google Scholar]
- 21.Saeb-Parsy, K. & Dyball, R. E. J. (2003) J. Biol. Rhythms 18, 26-42. [DOI] [PubMed] [Google Scholar]
- 22.Shinohara, K., Funabashi, T., Mitushima, D. & Kimura, F. (2000) Neurosci. Res. 38, 43-47. [DOI] [PubMed] [Google Scholar]
- 23.Van den Pol, A. N. & Dudek, F. E. (1993) Neuroscience 56, 793-811. [DOI] [PubMed] [Google Scholar]
- 24.Jiang, Z. G., Yang, Y. Q. & Allen, C. N. (1997) Neuoscience 77, 1059-1066. [DOI] [PubMed] [Google Scholar]
- 25.Ding, J. M., Chen, D., Weber, E. T., Faiman, L. E., Rea, M. A. & Gillette, M. U. (1994) Science 266, 1713-1717. [DOI] [PubMed] [Google Scholar]
- 26.Liu, C. & Reppert, S. M. (2000) Neuron 25, 123-128. [DOI] [PubMed] [Google Scholar]
- 27.Mrugala, M., Zlomanczuk, P., Jagota, A. & Schwartz, W. J. (2000) Am. J. Physiol. Regul. Integr. Comp. Physiol. 278, R987-R994. [DOI] [PubMed] [Google Scholar]
- 28.Jac, M., Sumova, A. & Illnerova, H. (2000) Am. J. Physiol. 279, R2270-R2276. [DOI] [PubMed] [Google Scholar]
- 29.Sumova, A., Travnickova, Z. & Illnerova, H. (2000) Am. J. Physiol. 279, R2262-R2269. [DOI] [PubMed] [Google Scholar]
- 30.Sumova, A., Jac, M., Sladek, M., Sauman, I. & Illnerova, H. (2003) J. Biol. Rhythms 18, 134-144. [DOI] [PubMed] [Google Scholar]
- 31.Messager, S., Ross, A. W., Barrett, P. & Morgan, P. J. (1999) Proc. Natl. Acad. Sci. USA 96, 9938-9943. [DOI] [PMC free article] [PubMed] [Google Scholar]
- 32.Messager, S., Hazlerigg, D. G., Mercer, J. G. & Morgan, P. J. (2000) Eur. J. Neurosci. 12, 2865-2870. [DOI] [PubMed] [Google Scholar]
- 33.Nuesslein-Hildesheim, B., O'Brien, J. A., Ebling, F. J., Maywood, E. S. & Hastings, M. H. (2000) Eur. J. Neurosci. 12, 2856-2864. [DOI] [PubMed] [Google Scholar]
- 34.Aida, R., Moriya, T., Araki, M., Akiyama, M., Wada, K., Wadda, E. & Shibata, S. (2002) Mol. Pharmacol. 61, 26-34. [DOI] [PubMed] [Google Scholar]
- 35.Dardente, H., Poirel, V. J., Klosen, P., Pevet, P. & Masson-Pevet, M. (2002) Brain Res. 958, 261-271. [DOI] [PubMed] [Google Scholar]
- 36.King, V. M., Chahad-Ehlers, S., Shen, S., Harmar, A. J., Maywood, E. S. & Hastings, M. H. (2003) Eur. J. Neurosci. 17, 822-832. [DOI] [PubMed] [Google Scholar]
- 37.Kuhlman, S. J., Silver, R., Le Sauter, J., Bult-Ito, A. & McMahon, D. G. (2003) J. Neurosci. 23, 1441-1450. [DOI] [PMC free article] [PubMed] [Google Scholar]
- 38.Reed, H. E., Meyer-Spasche, A., Cutler, D. J., Coen, C. W. & Piggins, H. E. (2001) Eur. J. Neurosci. 13, 839-843. [DOI] [PubMed] [Google Scholar]
- 39.Schwartz, W. J., Carpino, A., Jr., de la Iglesia, H. O., Baler, R., Klein D. C., Nakabeppu, Y. & Aronin, N. (2000) Neuroscience 98, 535-547. [DOI] [PubMed] [Google Scholar]
Associated Data
This section collects any data citations, data availability statements, or supplementary materials included in this article.


