Abstract
Macromolecular conformation dynamics, which span a wide range of time scales, are fundamental to the understanding of properties and functions of their structures. Here, we report direct imaging of structural dynamics of helical macromolecules over the time scales of conformational dynamics (ns to subsecond) by means of four-dimensional (4D) electron microscopy in the single-pulse and stroboscopic modes. With temporally controlled electron dosage, both diffraction and real-space images are obtained without irreversible radiation damage. In this way, the order-disorder transition is revealed for the organic chain polymer. Through a series of equilibrium-temperature and temperature-jump dependencies, it is shown that the metastable structures and entropy of conformations can be mapped in the nonequilibrium region of a “funnel-like” free-energy landscape. The T-jump is introduced through a substrate (a “hot plate” type arrangement) because only the substrate is made to absorb the pulsed energy. These results illustrate the promise of ultrafast 4D imaging for other applications in the study of polymer physics as well as in the visualization of biological phenomena.
Keywords: materials, polymers, biopolymers
Macromolecular structural dynamics, unlike those of small molecular systems, involve complex free-energy landscapes with numerous possible conformations (1, 2). A prime example is that of protein folding that occurs as a result of a search from a high-entropy state of many conformations to the low-entropy native structure (3–5). This process is best described by the balance between the entropic and enthalpic free-energy contributions, as well as the “diffusion” through a multitude of energy barriers that form nucleation centers or misfolded structures on the path to the final state. The behavior has been likened to phase transitions, and in this regard it is also applicable to other large systems including organic polymers (6–8).
In the transition, these macromolecules maintain the constituents or sequence of repeating units, but the conformations must undergo rearrangements from, for example, folded chains to random coils or extended chains (9). It is, therefore, important to understand conformational dynamics of macromolecules, biological (10) or abiological (11), and to elucidate the nature of the free-energy landscape that exhibits the multiple metastable states that are separated by entropic and enthalpic barriers. Visualization of the structures can be achieved using both real-space and diffraction imaging of electron microscopy, but these macromolecules are organics with facile bonds and, thus, probing of their motions represents a real challenge because of radiation damage. Moreover, the probing must span the time scales involved, from ps for rotational orientation to ns and microsecond (μs) for barrier crossings, and to hundreds of ms for refolding into the native structure.
Here, we report real-time visualization of helical-macromolecular dynamics using diffraction and real-space imaging methodology of four-dimensional (4D) electron microscopy (12, 13). The time scales spanned are those of conformational changes, and for such studies, it is shown that temporal control of dosage is an effective way for enabling such visualization prior to radiation damage. With this approach, we were able to explore various experimental variables that elucidate the nature of the free-energy landscape, and they include: the study of structural dynamics as a function of the nonequilibrium temperature (T)-jump; the effect of the initial equilibrium temperature of the system on dynamics; and the loss of order for different orientations and interchain separations. The model system examined is prototypical organic helical poly(ethylene) oxide (PEO) chains that form folded lamellar structures. Each unit is a macromolecule with a typical molecular weight of 8,000 dalton and with approximately 200 repeating units. From these studies, the entropic bottleneck in the “funnel” description of free-energy landscape (3, 4) is experimentally demonstrated directly in the conformational changes.
Because of its fundamental properties and a whole range of applications (14–16), thermodynamic and static-structure studies of PEO have been made using a plethora of experimental techniques (e.g., 17–21). However, investigations of structural dynamics have been mainly focused on local segmental motions in the chains using molecular dynamics simulations and frequency-domain dielectric spectroscopy and neutron scattering (22–25). On the time scale of minutes, studies involving time-resolved small-angle X-ray scattering have been concerned with the formation of macroscopic lamellae (26, 27). In general, the phase behavior is considered in terms of both the conformation of individual macromolecules in the ordered state, “secondary structure,” and the arrangement of these molecules into the 3D architecture, the “tertiary structure.” Real-time experimental probings in the critical ns to ms range are, thus, essential for investigations of conformational changes.
Spatiotemporal Imaging and Diffraction
All experiments reported here were performed using Caltech’s second-generation ultrafast electron microscope (UEM-2) (28, 29), the operation of which in the single-pulse mode has been described elsewhere (30, 31). Briefly, two synchronized pulses are utilized, an optical one for inducing a T-jump and a probing electron pulse for recording an image or diffraction pattern at a well-defined time (t) with respect to the initiation of the structural change at t0. These frames are taken over the time scale of interest, spanning different ranges, from ns to subsecond. Two temperatures are defined here: the equilibrium temperature of the system, Te, which is varied using a temperature controller in the microscope and the T-jump, ΔT, which is induced in situ by varying the fluence of the optical pulse. Diffraction patterns were acquired in a single shot (pulse of 105 electrons) with good signal-to-noise ratio; the use of two to five shots per frame was also possible, and for a dark-field (DF) image 100 shots per frame were recorded. From the electron-energy-loss-spectroscopy measurements made, the thickness of crystals used was obtained to be 25–50 nm. For all T-jump experiments, the rate of heating is higher than 109 K/s.
Static Structures
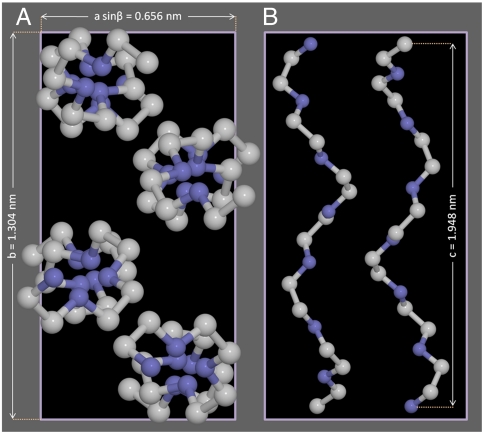
The chain-folded lamellar crystals (32) preserve the helical conformation with slight local distortions caused by intermolecular interactions (33). In the unit cell, the molecule bears seven repeat units, -(CH2CH2O)-, which consist of two helical turns over the length of 2 nm. Fig. 1 displays the unit cell of the monoclinic structure of the space group P21/a (17, 33). The lattice parameters of PEO are: a = 8.05 Å, b = 13.04 Å, and c = 19.48 Å with β = 125.4° (where β is the oblique angle between the a- and c-axis), and the chain conformation depicts the four helical molecules (two right- and two left-handed helices) in one unit cell.
Fig. 1.
Molecular structure and morphology of helical macromolecules. (A) The PEO monoclinic unit cell, projected onto a plane perpendicular to the c-axis. The lattice parameters are a = 8.05 Å, b = 13.04 Å, and c = 19.48 Å with β = 125.4°, where β is the angle between the a- and c-axes. (B) Side view of left- and right-handed helices.
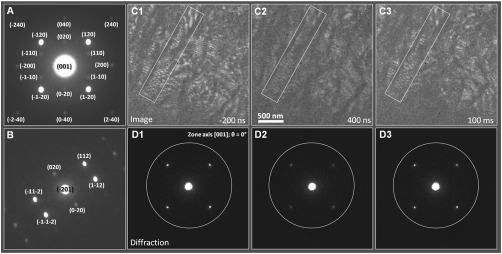
Fig. 2 A and B display the indexed electron diffraction patterns recorded at θ = 0° and 25°, where θ is the specimen-tilt angle, for the [001] and [-201] zone axis, respectively; for the [001] zone axis, the c-axis of the crystal is parallel to the electron beam direction. The indexing was performed using kinematical diffraction simulations (34). The orientation of the helix is along the [001] c-axis and chain folding follows the (120) planes (17, 33). The (120) reflections taken along the [001] zone axis have information about interchain separations and chain conformations, whereas the (112) reflections, when taken at θ = 25°, contains structural information along the c-axis; i.e., the helicity of the macromolecule (Fig. 2B).
Fig. 2.
Images and diffraction patterns, static and time-resolved. (A) and (B) Static diffraction patterns for two orientations: (A) θ = 0° and (B) θ = 25°. The pattern in (A) is taken along the [001] zone axis and the one in (B) is taken along the [-201] zone axis. The (120) reflection in (A) is sensitive to the interchain separation and chain conformation in the ab-basal plane and the (112) reflection in (B) is sensitive to changes also in the c-axis. (C) and (D) Time-resolved DF images and corresponding diffraction patterns shown for three representative frames at -200 ns, 400 ns, and 100 ms; the full time dependence is given in Fig 3. In the diffraction the electron beam diameter is 4 μm. The DF images were obtained by selecting with an objective aperture the (120) reflection. The bright lines are due to structures diffracting in Bragg conditions.
Structural Dynamics
Having determined the static structure (at 25 °C), we performed time-resolved image and diffraction measurements over the time scale of up to 400 ms, following the T-jump*. In Fig. 2 C and D, we show time-resolved DF images and diffraction patterns at specified times. In DF imaging, when the unscattered (direct) beam is blocked, a desired Bragg reflection is selected with an objective aperture to form an image, thus enhancing the contrast for time-dependent morphological changes. The images shown in Fig. 2C were taken by selecting the (120) reflection. The regions of the specimen that undergo Bragg scatterings contribute differently to image formation; brighter regions in the image are from the structures oriented to satisfy Bragg conditions (37). The regions diffracting in the [120] direction appear bright and those out-of-Bragg condition, with respect to the objective aperture position, appear dark.
At different times, the diffraction frames are presented in Fig. 2D. The intensity drop in the Bragg peaks of, for example, the (120) family, which are recoverable at longer times, clearly illustrates the loss of macromolecular structural order as evidenced in the emergence of diffused diffraction rings (see the caption of Fig. S1)†. This structural change is also apparent in the time-resolved DF images. The bright lines in the images (Fig. 2C) are consistent with those of a typical morphology common in lamellar structures (38); for thick specimens of stacked lamellae, moiré fringes may also contribute to the contrast. Because DF imaging is very sensitive to changes in structural order (lamellar crystallinity and orientation), the intensity variation in the images taken at different times is a complementary indication of the structural change. With time, as a result of the induced disorder, the bright lines in the image become darker, because the lamellar crystal loses crystallinity. We note that morphological changes or mechanical movements could result in alteration of intensities (loss or gain), but as shown here we observe only loss in all recorded diffraction (accompanied by rise of halo rings) and the same effect is dominant in images. Thus structural changes are responsible for the observed order-disorder transition. The image taken at t = 100 ms illustrates that the structure has almost recovered back to the original one.
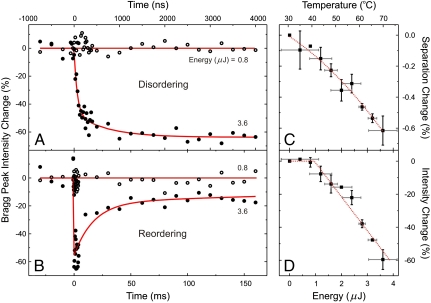
To quantify the spatiotemporal behavior, diffraction intensity (and peak separation) profiles of hundreds of frames were constructed by measuring the average intensity of Bragg peaks (or the average separation of symmetric pairs of Bragg peaks) at different times; each Bragg diffraction spot profile was fit to a Gaussian function. The time dependencies are given in Figs. 3 and 4. The intensity change reflects the degree of helical order (local) and chain conformation (global), as the observed changes were obtained for Bragg reflections of smaller scattering vectors. From these results, one can see that the macromolecular structure begins to lose its order in approximately 100 ns upon pulsed heating and continues to do so for approximately 1 µs, but then recovers on the tens of ms time scale with cooling (in a few ms) being the driving force (see below)*. The intensity change reaches up to 60% (90% at Te = 40 °C) and the separation change, for example, for the 4.625 Å spacing of molecular planes represented by the Bragg (120) peaks, is up to 3 pm. The observed behavior at different ΔT values has a threshold at approximately 1 microjoule (µJ) of energy (Fig. 3D), and details of such dependence are given in SI Text (see Fig. S2).
Fig. 3.
Structural temporal profiles of macromolecules. (A) Disordering through T-jump. Shown is the change of the average intensity for a set of Bragg spots (120). The changes are normalized to those measured before t0. The temporal profiles of the intensity change were fit to multiexponential functions and the time constants were deduced, reflecting the range of rates for restructuring. We note that the 1-μs component appears only at the highest energy for heating (see Fig. S2). (B) Reordering on the ms time scale. See also Fig. 4 (and Fig. S2). (C) The expansion observed as a decrease in Bragg peaks separations and as a function of heating energy (μJ). The amplitudes plotted were obtained from both the ns and ms transients (A and B). The temperature scale shown corresponds to the energy for pulsed heating using the observed separations at different equilibrium temperatures (see Fig. S3B). (D) Energy dependence of the maximum Bragg peak intensity change, which displays a threshold at approximately 1 µJ, corresponding to the temperature of 40 °C. Above the threshold, intensity decreases linearly with energy.
Fig. 4.
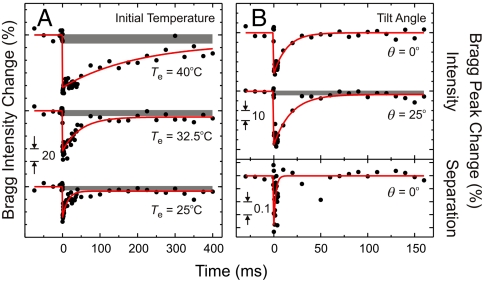
Restructurring dynamics at different initial-equilibrium temperatures and for different orientations. (A) Time-dependent integrated intensities for a set of Bragg (120) spots as a function of initial equilibrium temperature (Te) of the system. The striking retardation of ordering upon increasing Te is evident in the rates that decrease by more than an order of magnitude (see text). Gray bands represent ≥400-ms components (see Fig. S2). (B) Time-dependent intensity change for (120) and (112) Bragg peaks for two different tilt angles θ = 0° and 25°, respectively, at Te = 25 °C (Upper). At θ = 25°, the diffraction of the (112) planes contains molecular information along the c-axis, that is not possible at θ = 0°. The separation change with time observed for θ = 0° is also displayed (Lower).
In the absence of the T-jump, we also varied Te over the range of 25°C to 70°C to confirm the intensity dependence of diffraction. This dependence was found to display a hysteresis (see Fig. S3A), a behavior characteristic of these macromolecular systems, with an equilibrium melting temperature of 63 °C. However, melting occurs at much higher temperatures when the heating rate increases (39), in our case more than 109 K/s. When the system completely loses its order (amorphous), a diffused ring manifests in the diffraction pattern at the expense of the well-defined Bragg peaks (see Fig. S3B, Inset).
With both the dynamics and the temperature control at hand, we explored, in a series of experiments, the initial-temperature (Te) dependence of dynamics and the effect of orientation. In Fig. 4A, the recovery time, which reflects a rate averaged over the different searches to the original crystalline structure, was found to vary from 14 ± 2 to 47 ± 9 and to 201 ± 90 ms as Te was changed from 25 to 32.5 and to 40 °C, respectively; for all these Te-varying experiments, we kept ΔT (= 40 ± 6 °C) the same. The observation that restructuring slows down as Te of the system is raised is in line with nucleation theory in polymer crystallization (40); the smaller the “quench depth,” (i.e., the difference between Te and a crystallization temperature) the slower the nucleation. The diffraction intensity and Bragg spot separation, for a fixed θ and Te (= 25 °C), behave differently; the separation recovery time is 2 ms (Fig. 4B), shorter than that of intensity recovery (approximately 15 ms). Because the interchain distance of 4.625 Å was obtained for the (120) set of spots, it is not as sensitive to changes in helicity, but is affected by an increase in temperature, in analogy with the behavior of an optical phonon of a unit cell (see caption of Fig. S2). Thus, the change of Bragg spot separation is a measure of the temperature*. On the other hand, diffraction intensity change maps the increased disorder of the helical macromolecules. The intensity of a set of Bragg (112) peaks at θ = 25° changes by 30% more than that at θ = 0°, suggesting that structural order along the c-axis (i.e., helicity) is prone to decrease more than that in the ab-plane representing chain conformation. Because the recovery time is similar at θ = 0° and θ = 25° (14 ± 4 and 18 ± 4 ms, respectively), noting that the electron probing for the former being down the chains whereas for the latter it is at an angle, it is suggested that helical and chain conformational (bending/twisting) motions are cooperative in nature.
Free-Energy Landscape
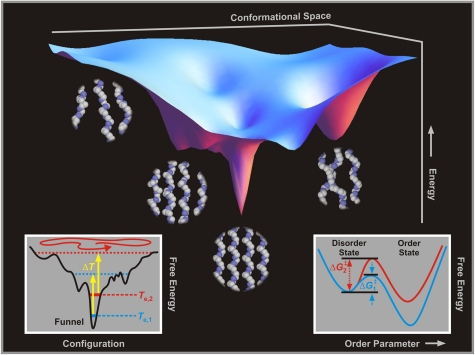
The totality of the above results of 4D imaging elucidates the nature of the energy landscape. Macromolecular motions on the free-energy surface of molecular conformations can be rationalized using a funnel-like picture (3, 4) in which the funnel is reached after many visits or trappings in “misfolded” conformations. Fig. 5 pictorially depicts a free-energy landscape together with some representative conformations. Following the T-jump the macromolecular structure heats up to a nonequilibrium state at a rate of more than 109 K/s. The disordering of the local chain conformation (i.e., the decrease in helicity and hence loss of Bragg reflections) follows after the build up of atomic motions (41) for collective unwinding on the time scale of approximately 100 ns. Because of the insensitivity of this rate to ΔT, the disordering is a barrierless process.
Fig. 5.
Free-energy landscape. Shown is an energy funnel in molecular conformation space. For this representation, the entropy is reflected in the width whereas the enthalpy is given by the depth. With the T-jump, nonequilibrium macromolecular conformations are populated above the initial, ordered state, and a search for this initial state follows across entropic barriers. Also displayed are pictorial snapshots for representative macromolecular conformations, including: a low-temperature one showing rigid helicity with segmental motions being suppressed, a softened one with segmental motions prevalent and less helicity, another one with the loss of helicity and interchain orientations near melting, and, eventually, the amorphous state of conformations (liquid-like phase) with random coils. (Inset) Simplified free-energy surfaces showing (Left) the effect of initial equilibrium temperature when a T-jump experiment is carried out, and (Right) the order/disorder two-state representation as the order parameter changes (see text).
The recovery of helicity and chain conformation to the original ordered state, passing the “intramolecular nucleation” conformations, is on the ms time scale, but unlike the 100-ns process, it crucially depends on the initial equilibrium temperature, Te (see Fig. 5, Inset). The reported dynamic experiments made at different initial Te values, therefore, demonstrate the increased influence of conformations in the observed structural changes. The fact that the rate of restructuring decreases by more than an order of magnitude in the 15 °C change of Te indicates that the landscape “opens up” for higher Te values when the number of conformations increases significantly. As a consequence, the chain conformations become more randomly oriented and it must take longer times for them to reach the original structure.
The entropic and enthalpic contributions to the barrier can be estimated by considering a two-state description (42, 43) in an analogy with a first-order phase transition described by the so-called order parameter (Fig. 5, Inset). The observed rate (k) gives the activation free energy at different Te values, ΔG(Te)‡ = RTe ln(k0/k), with k0 being the measured (100 ns)-1 rate, which is consistent with values obtained for other macromolecules (44). At room temperature, we obtained ΔG‡ to be 7 ± 3 kcal/mol, which is comparable to typical values for protein folding barriers (1, 2). From the plot of ΔG‡ vs. Te, the following values were obtained: ΔH‡ = -33 ± 2 kcal/mol and ΔS‡ = -134 ± 7 cal/(K·mol), which are significantly below those of an amorphous-to-crystalline transition (36).
The critical temperature for the order-disorder transition, when ΔG‡ = 0, is 250 ± 20 K, which is in good agreement with the reported values from calorimetric and spectroscopic measurements (45, 46) when molecular motions are greatly suppressed. It follows that the disorder in 100 ns is due to “softening” or premelting, which possibly involves the rotation of chains about their long axes and the translational diffusion along the long axes (47).§ When the T-jump is high enough, ΔT≥40 °C, the system is promoted above the equilibrium melting temperature. The emergence of a slower disorder in 1 μs is thus related to the partial melting or “unfolding” (i.e., the loss of lateral interchain order in the heterogeneous lamellar crystal) followed by refolding on the time scale of ≥100 ms (Fig. S2). This behavior is entirely consistent with the fact that diffraction and images recover without changes or irreversibility of the initial patterns.
Dose Control and Radiation Damage
All of the above 4D imaging studies would not have been possible without the temporal control of the dosage. For beam-sensitive specimens, there are stringent requirements on the dose (49, 50) used to form an image or diffraction pattern; the critical dose, Jc, is defined as the electron flux through unit sample area at which the intensity from a reflection of a specific spacing reduces to 1/e of that at zero dose. Because Jc for organic/biological specimens is typically a few electrons/Å2, static images in conventional electron cryomicroscopy are traditionally recorded in the three regimes of search, focus, and exposure (51), whereby the region of interest is exposed only during the acquisition time of seconds.
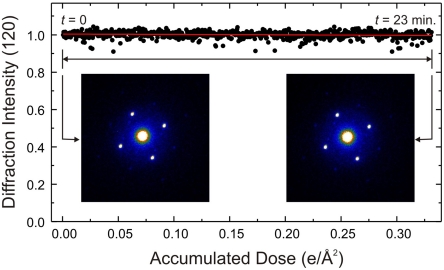
Ultrafast electron microscopy (UEM) has the fastest shutter that enables electron-beam irradiation in a very short exposure time and with accurate control of dosage. Thus, it is possible to achieve imaging on a time scale shorter than that of radiation damage at room temperature. This is what was achieved here, and Fig. 6 illustrates the change in the integrated intensity of (120) family of Bragg spots when the electron-beam dose was temporally controlled. Our specimen was exposed to approximately 7,000 single shots in 23 minutes with the accumulated dose of 0.3 e/Å2, which is an order of magnitude lower than typical Jc values (51) for biological specimens. And, to reach 3 e/Å2, four hours of recording can be made at room temperature. For each diffraction frame, recorded with one pulse, the dosage is five orders of magnitude below the critical dose for radiation damage.
Fig. 6.
Diffraction intensity dependence on accumulated electron dose. The change in the integrated intensity of the (120) Bragg peaks family with increasing electron beam dose is robust for 23 minutes with no observed decay at room temperature. At the typical critical dosage of radiation damage (a few e/Å2) continuous recording for four hours is possible (see text).
Conclusion
The ability to study structural dynamics of macromolecules on various time scales with 4D electron microscopy enables real- and Fourier-space imaging during the order-disorder processes of conformational change. The temperature jump achieved through pulsed optical excitation of a substrate (“hot plate” type heating) and the ultrashort pulsed electron probing in UEM make possible the study of these structures in the far-from-equilibrium state directly from their diffraction and images. Of significance is the nature of the free-energy landscape and the influence of conformational evolution that can be mapped at higher temperatures when entropy increases. For the system studied here, the time scales cover such conformational polymer dynamics, and, given the recent report by Shaw et al. (10), the approach is ideal for the study of protein dynamics. The temporal control of electron dosage was the key for the success in imaging of radiation-sensitive organic matter, and that too should be of significance to applications in other studies of biological and abiological macrostructures (52).
Supplementary Material
Acknowledgments.
We thank Dr. J. S. Baskin for the fruitful comments and reading of the manuscript. We gratefully acknowledge very helpful and thorough reports by Professors Edwin L. Thomas and M. Muthukumar. A.H.Z. thanks Professor David Tirrell for his insightful remarks. This work was supported by National Science Foundation Grant DMR-0964886 and Air Force Office of Scientific Research Grant FA9550-07-1-0484 in the Physical Biology Center for Ultrafast Science and Technology at Caltech supported by the Gordon and Betty Moore Foundation.
Footnotes
The authors declare no conflict of interest.
This article contains supporting information online at www.pnas.org/lookup/suppl/doi:10.1073/pnas.1103109108/-/DCSupplemental.
*The T-jump was carried out using laser pulses. The highest fluence (for pulses of 10 ns at 532 nm) was up to 100 mJ/cm2. The lamellar crystalline PEO was formed by depositing a drop of an aqueous PEO solution onto a transmission electron microscopy (TEM) grid and following the solvent evaporation. The PEO crystal sits on a carbon substrate that in turn is on a Formvar supporting membrane of a 75-mesh TEM grid. The crystal itself is transparent at the pump wavelength of 532 nm, and amorphous carbon is the absorbing medium. Because of the thickness involved (≤ 100 nm total), heat transfer in that dimension is ultrafast within the used T-jump pulse as evidenced in the rise time (≤ 20 ns) of the diffraction peak separations. The dissipation of heat in the specimen occurs laterally and for this 2D diffusion one can estimate the time constant (30). Knowing the value of thermal conductivity [0.24 W/(K·m) (35)], specific heat [0.489 kcal/(kg·K) at 25 °C and 0.358 kcal/(kg·K) at 70 °C (36)], and the density (1.12 g/cm3), the time for the axial temperature to drop to one half of its initial value, t1/2 is 2.1 to 3.2 ms, depending on the value of specific heat; the radius at half-height of the initial pulsed-heat distribution is 30 μm. For the amorphous carbon layer and the Formvar substrate, similar time constants were obtained (3–4 ms). These values are consistent with the observed time for the Bragg peaks separation recovery (Fig. 4B).
†The loss of Bragg peak intensity was found to be concomitant with an increase of a diffraction halo ring, a signature for the onset of amorphous structure formation (Fig. S3).
§A recent molecular dynamics simulation shows that the interchain CH2 orientational disorder precedes the loss of helicity (intrachain ordering) (48). The former retains the helicity and the chain conformation, thus the invariance of the Bragg intensity with the T-jump up to the threshold at 40 °C in our study may be related to the aforementioned transition (Fig. 3D); above the threshold significant unwinding of helices (premelting) leads to the loss of the Bragg intensity.
References
- 1.Wales DJ. Energy Landscapes. Cambridge: Cambridge University Press; 2003. [Google Scholar]
- 2.McMillan PF, Clary DC, editors. Configurational energy landscapes and structural transitions in clusters, fluids, and biomolecules. Philos T R Soc A. 2005;363:311–607. [Google Scholar]
- 3.Onuchic JN, Luthey-Schulten Z, Wolynes PG. Theory of protein folding: The energy landscape perspective. Annu Rev Phys Chem. 1997;48:545–600. doi: 10.1146/annurev.physchem.48.1.545. [DOI] [PubMed] [Google Scholar]
- 4.Frauenfelder H, et al. A unified model of protein dynamics. Proc Natl Acad Sci USA. 2009;106:5129–5134. doi: 10.1073/pnas.0900336106. [DOI] [PMC free article] [PubMed] [Google Scholar]
- 5.Dobson CM. Protein folding and misfolding. Nature. 2003;426:884–890. doi: 10.1038/nature02261. [DOI] [PubMed] [Google Scholar]
- 6.Gutin A, Sali A, Abkevich V, Karplus M, Shakhnovich EI. Temperature dependence of the folding rate in a simple protein model: search for a “glass” transition. J Chem Phys. 1998;108:6466–6483. [Google Scholar]
- 7.Angell CA. Energy landscapes for cooperative processes: Nearly ideal glass transitions, liquid–liquid transitions and folding transitions. Philos T R Soc A. 2005;363:415–432. doi: 10.1098/rsta.2004.1500. [DOI] [PubMed] [Google Scholar]
- 8.Muthukumar M. Shifting paradigms in polymer crystallization. Lect Notes Phys. 2007;714:1–18. [Google Scholar]
- 9.Wunderlich B. Macromolecular Physics. Vol. 2 and 3. New York: Academic; 1980. [Google Scholar]
- 10.Shaw DE, et al. Atomic-level characterization of the structural dynamics of proteins. Science. 2010;330:341–346. doi: 10.1126/science.1187409. [DOI] [PubMed] [Google Scholar]
- 11.Sprik M, Röthlisberger U, Klein ML. Structure of solid poly(tetrafluoroethylene): A computer simulation study of chain orientational, translational, and conformational disorder. J Phys Chem B. 1997;101:2745–2749. [Google Scholar]
- 12.Zewail AH, Thomas JM. 4D Electron Microscopy: Imaging in Space and Time. London: Imperial College Press; 2009. [Google Scholar]
- 13.Zewail AH. Four-dimensional electron microscopy. Science. 2010;328:187–193. doi: 10.1126/science.1166135. [DOI] [PubMed] [Google Scholar]
- 14.Harris JM, Zalipsky S, editors. Poly(ethylene glycol): Chemistry and Biological Applications. Vol. 680. Washington, DC: American Chemical Society; 1997. [Google Scholar]
- 15.Tarascon J-M, Armand M. Issues and challenges facing rechargeable lithium batteries. Nature. 2001;414:359–367. doi: 10.1038/35104644. [DOI] [PubMed] [Google Scholar]
- 16.Zhang C, et al. Alkali metal crystalline polymer electrolytes. Nat Mater. 2009;8:580–584. doi: 10.1038/nmat2474. [DOI] [PubMed] [Google Scholar]
- 17.Tadokoro H. Structure and properties of crystalline polymers. Polymer. 1984;25:147–164. [Google Scholar]
- 18.Carlsson P, et al. The segmental dynamics of a polymer electrolyte investigated by coherent quasielastic neutron scattering. J Chem Phys. 2001;114:9645–9656. [Google Scholar]
- 19.Mao G, Perea RF, Howells WS, Price DL, Saboungi M-L. Relaxation in polymer electrolytes on the nanosecond timescale. Nature. 2000;405:163–165. doi: 10.1038/35012032. [DOI] [PubMed] [Google Scholar]
- 20.Kovacs AJ, Straupe C. Isothermal growth, thickening, and melting of poly(ethylene oxide) single crystals in the bulk. Faraday Discuss Chem Soc. 1979;68:225–238. [Google Scholar]
- 21.Richardson RH, Richards RW, Blundell DJ, MacDonald WA, Mills P. Differential scanning calorimetry and optical microscopy investigations of the isothermal crystallization of a poly(ethylene oxide)-poly(methyl methacrylate) block copolymer. Polymer. 1995;36:3059–3069. [Google Scholar]
- 22.Neyertz S, Brown D. A computer simulation study of the chain configurations in poly(ethylene oxide)-homolog melts. J Chem Phys. 1995;102:9725–9735. [Google Scholar]
- 23.Siqueira LJA, Ribeiro MCC. Molecular dynamics simulation of the polymer electrolyte poly(ethylene oxide)/LiClO4. II Dynamical properties. J Chem Phys. 2006;125:214903. doi: 10.1063/1.2400221. [DOI] [PubMed] [Google Scholar]
- 24.Jin X, Zhang S, Runt J. Observation of a fast dielectric relaxation in semi-crystalline poly(ethylene oxide) Polymer. 2002;43:6247–6254. [Google Scholar]
- 25.Mos B, et al. The dynamics in polyethyleneoxide-alkali iodide complexes investigated by neutron spin-echo spectroscopy and molecular dynamics simulations. J Chem Phys. 2000;113:4–7. [Google Scholar]
- 26.Lisowski MS, et al. Crystallization behavior of poly(ethylene oxide) and its blends using time-resolved wide- and small-angle X-ray scattering. Macromolecules. 2000;33:4842–4849. [Google Scholar]
- 27.Baldrian J, et al. Time-resolved SAXS study of crystallization of poly(ethylene oxide)/poly(methyl methacrylate) blends. Polymer. 1999;40:439–445. [Google Scholar]
- 28.Barwick B, Park HS, Kwon O-H, Baskin JS, Zewail AH. 4D imaging of transient structures and morphologies in ultrafast electron microscopy. Science. 2008;322:1227–1231. doi: 10.1126/science.1164000. [DOI] [PubMed] [Google Scholar]
- 29.Kwon O-H, Barwick B, Park HS, Baskin JS, Zewail AH. Nanoscale mechanical drumming visualized by 4D electron microscopy. Nano Lett. 2008;8:3557–3562. doi: 10.1021/nl8029866. [DOI] [PubMed] [Google Scholar]
- 30.Kwon O-H, Barwick B, Park HS, Baskin JS, Zewail AH. 4D visualization of embryonic, structural crystallization by single-pulse microscopy. Proc Natl Acad Sci USA. 2008;105:8519–8524. doi: 10.1073/pnas.0803344105. [DOI] [PMC free article] [PubMed] [Google Scholar]
- 31.Park HS, Kwon O-H, Baskin JS, Barwick B, Zewail AH. Direct observation of martensitic phase-transformation dynamics in iron by 4D single-pulse electron microscopy. Nano Lett. 2009;9:3954–3962. doi: 10.1021/nl9032704. [DOI] [PubMed] [Google Scholar]
- 32.Qiu W, Pyda M, Nowak-Pyda E, Habenschuss A, Wunderlich B. Reversibility between glass and melting transitions of poly(oxyethylene) Macromolecules. 2005;38:8454–8464. [Google Scholar]
- 33.Tadokoro H. Structure of Crystalline Polymer. Malabar, FL: Krieger; 1990. [Google Scholar]
- 34.Oleynikov P. eMap. 2006. Available at http://www.analitex.com/eMap.html.
- 35.Terao T, et al. Thermal conductivity improvement of polymer films by catechin-modified boron nitride nanotubes. J Phys Chem C. 2009;113:13605–13609. [Google Scholar]
- 36.Beaumont RH, et al. Heat capacities of propylene oxide and of some polymers of ethylene and propylene oxides. Polymer. 1966;7:401–417. [Google Scholar]
- 37.Chacko VP, Adams WW, Thomas EL. Imaging of polyethylene films by diffraction contrast. J Mater Sci. 1983;18:1999–2010. [Google Scholar]
- 38.Pearce R, Vancso JG. Imaging of melting and crystallization of poly(ethylene oxide) in real-time by hot-stage atomic force microscopy. Macromolecules. 1997;30:5843–5848. [Google Scholar]
- 39.Madbouly SA, Wolf BA. Crystallization kinetics of poly(ethylene oxide) from its melt and from mixtures with tetrahydronaphthalene and oligo(ethylene oxide-block-dimethylsiloxane) J Polym Sci Pol Phys. 2004;42:820–829. [Google Scholar]
- 40.Muthukumar M. Nucleation in polymer crystallization. Adv Chem Phys. 2004;128:1–63. [Google Scholar]
- 41.Krishnan M, Balasubramanian S. Vibrational dynamics of solid poly(ethylene oxide) Phys Rev B. 2003;68:064304. [Google Scholar]
- 42.Hu W, Frenkel D, Mathot VBF. Intramolecular nucleation model for polymer crystallization. Macromolecules. 2003;36:8178–8183. [Google Scholar]
- 43.Kubelka J, Hofrichter J, Eaton WA. The protein folding “speed limit”. Curr Opin Struct Biol. 2004;14:76–88. doi: 10.1016/j.sbi.2004.01.013. [DOI] [PubMed] [Google Scholar]
- 44.Michalet X, Weiss S, Jäger M. Single-molecule fluorescence studies of protein folding and conformational dynamics. Chem Rev. 2006;106:1785–1813. doi: 10.1021/cr0404343. [DOI] [PMC free article] [PubMed] [Google Scholar]
- 45.Lang MC, Noël C, Legrand AP. Solid-state relaxations in poly(ethylene oxide). I. Study using the differential scanning calorimetry method. J Polym Sci Pol Phys. 1977;15:1319–1327. [Google Scholar]
- 46.Yoshihara T, Tadokoro H, Murahashi S. Normal vibrations of the polymer molecules of helical conformations. IV. Polyethylene oxide and polyethylene-d4 oxide. J Chem Phys. 1964;41:2902–2911. [Google Scholar]
- 47.Granier T, Thomas EL, Gagnon DR, Karasz FE, Lenz RW. Structure investigation of poly(p-phenylene vinylene) J Polym Sci Pol Phys. 1986;24:2793–2804. [Google Scholar]
- 48.Krishnan M, Balasubramanian S. Order-disorder transitions and melting in a helical polymer crystal: molecular dynamics calculations of model poly(ethylene oxide) Chem Phys Lett. 2004;385:351–356. [Google Scholar]
- 49.Henderson R. The potential and limitations of neutrons, electrons, and X-rays for atomic resolution microscopy of unstained biological molecule. Quart Rev Biophys. 1995;28:171–193. doi: 10.1017/s003358350000305x. [DOI] [PubMed] [Google Scholar]
- 50.Howie A. Radiation damage problems in electron microscopy. Revue Phys Appl. 1980;15:291–295. [Google Scholar]
- 51.Grassucci RA, Taylor D, Frank J. Visualization of macromolecular complexes using cryo-electron microscopy with FEI Tecnai transmission electron microscopes. Nat Protoc. 2008;3:330–339. doi: 10.1038/nprot.2007.474. [DOI] [PMC free article] [PubMed] [Google Scholar]
- 52.Zewail AH. Filming the invisible in 4D: New microscopy makes movies of nanoscale objects in action. Sci Am. 2010;303:74–81. doi: 10.1038/scientificamerican0810-74. [DOI] [PubMed] [Google Scholar]
Associated Data
This section collects any data citations, data availability statements, or supplementary materials included in this article.


