Abstract
Mammalian cells such as rat-1 fibroblasts have been shown to exhibit daily oscillations in the expression of several gene transcripts in culture. After induction, these oscillations persist with a period of ≈24 h for several days. This characteristic suggests that the oscillations are controlled by a circadian clock, but the crucial criterion of temperature compensation has not been demonstrated for rat-1 fibroblasts. We have developed an automated assay of circadian expression of the mPer1 promoter in rat-1 fibroblasts that have been stably transfected with a luciferase reporter. Using this cell culture-based in vitro luminescent reporter assay, we found that the daily oscillation of mPer1 promoter activity in rat-1 cells is temperature compensated over the range of 28.5-36.5°C. This finding means that these oscillations are bona fide circadian rhythms. Moreover, the circadian clock of these homeothermic mammalian cells not only is temperature compensated but also is overcompensated such that it runs faster at cooler temperatures (Q10 of 0.85-0.88). The oscillations in rat-1 fibroblasts damp more rapidly at cooler temperatures, and damping is not due to cells becoming unhealthy because a second stimulus will reinitiate a robust rhythm. These data show that rat-1 cell cultures that are stably transfected with luminescence reporters are an excellent model system for studying circadian clocks at the cellular level in mammals.
Keywords: rat-1, luciferase, biological clock, Per1
Circadian rhythms are biological oscillators that are characterized by three salient properties: (i) persisting oscillations in constant conditions with a period of ≈24 h, (ii) entrainment to environmental cycles, and (iii) temperature “compensation.” Temperature compensation means that these oscillators run at about the same rate at different constant ambient temperatures within the physiological range (Q10 ≈ 1). The discovery of temperature compensation 50 yr ago (1-4) defined circadian rhythms as a fascinating and unique class of oscillators and established a research field. How can an oscillator comprised of enzymes be relatively impervious to differences in temperature? Despite the 50 yr that have elapsed since the observation of circadian temperature compensation, there is no adequate molecular explanation for the phenomenon (5).
Temperature compensation has been observed in organisms spanning many phyla (6-9). Although the adaptive value of temperature compensation in poikilothermic organisms is clear (1, 5, 6), it might be predicted that temperature compensation would be unnecessary in homeotherms because their body temperature is relatively constant, and therefore this property might have been lost during the evolution of homeotherms. This prediction is not upheld. When autonomous circadian rhythms have been assayed from tissues of homeotherms isolated in vitro, temperature compensation is preserved. The homeothermic tissues for which temperature compensation has been demonstrated are chicken pinealocytes (7), mammalian retina (8), and the suprachiasmatic nuclei (SCN) of the mammalian hypothalamus (9). However, each of these three tissues is part of the nervous system. What about nonneural tissues from homeotherms? Using a luminescence reporter of the activity of the mPer1 promoter (PmPer1::luc) in transgenic rats, Yamazaki et al. (10) found that nonneural mammalian tissue express circadian rhythms in vitro, but they damp more rapidly than the circadian rhythms from the SCN. This result implies that the circadian system in nonneural tissue might have fundamental differences from that in the SCN and raises the question of whether temperature compensation might be a property that is restricted to neural tissues of mammals.
Rat-1 fibroblasts have become a model system for the study of circadian rhythms in peripheral mammalian tissue (11). In the first report, a serum shock was used to initiate rhythms of gene expression in populations of rat-1 cells in culture (11), but subsequent studies have discovered that a variety of signals can synchronize the rhythms in mammalian fibroblasts (12-14). Several of the same genes that are implicated in the mammalian clockwork are expressed in a similar fashion in fibroblasts and in the suprachiasmatic nuclei, suggesting that their clock mechanisms might be similar (15, 16), but temperature compensation has not been demonstrated for rat-1 fibroblasts. A publication (17) that appeared after this paper was submitted demonstrated that circadian rhythms of mRNA abundance are temperature compensated in the mouse fibroblast line NIH 3T3.
Most of the studies on fibroblast rhythms have used mRNA abundance as the gauge of rhythmic gene expression, but one study that used transient transfection with a luminescence reporter encouraged the possibility of using real-time luminescence recording as a monitor of circadian gene regulation as expressed by promoter activity (18). We have therefore used rat-1 fibroblasts that are stably transfected with a luminescence reporter of PmPer1 activity to develop a model system for highly precise measurements of circadian period and phase in populations of mammalian cells in culture. We use this optimized system to demonstrate that the circadian clock in fibroblasts is temperature compensated and to study the damping of circadian oscillations in vitro. These rhythmically glowing cells are an excellent model system for noninvasive monitoring of circadian clocks in mammalian cells.
Materials and Methods
Reporter Construct. The cytomegalovirus promoter of pcDNA3.1/Hygro(+) (Invitrogen) was replaced by the 3.0-kb region that is immediately upstream of the mPer1 transcription start site (the mPer1 promoter was taken from a PmPer1::GFP construct (19) provided by D. McMahon, Vanderbilt University). The mPer1 promoter was fused to firefly luciferase cDNA (from pGL3-Basic, Promega). This expression vector is hereafter called “pPmPer1::luc/Hyg.”
Generation of Stably Transfected Reporter Rat-1 Lines. Rat-1 fibroblasts (generous gift from M. Bishop, University of California, San Francisco) were transfected with 5 μg of linearized pPmPer1::luc/Hyg by LipoFectin (GIBCO). Forty-eight hours after transfection, hygromycin (200 μg/ml) was added to select stable lines. Among 349 colonies grown in the presence of hygromycin, 99 were viable and luminescent. To further screen the lines that accurately report mPer1 expression, we applied the following two criteria: (i) because the 3.0-kb promoter of mPer1 contains one canonical CRE site, the stable clones should respond to a 50% horse serum shock as reported by Balsalobre et al. (11), and (ii) when assayed for circadian rhythmicity at 100% confluency, the stable clones should exhibit a rhythm of at least two cycles, as shown for mPer1 mRNA expression by Balsalobre et al. (11). Eighteen clones met these criteria. Of these 18 clones, different lines showed different amplitudes of luminescence expression and robustness of rhythmicity. All experiments reported here used a line called 4-43, which was one of the lines that reproducibly showed a robust circadian rhythm of luciferase activity.
Cell Culture and Synchronization. Rat-1 cells were cultured at 36.5°C (5% CO2) in DMEM (catalog no. 11965-092, GIBCO) supplemented with 5% FBS (GIBCO), 50 units/ml penicillin, 50 μg/ml streptomycin, and 2 mM glutamine. Approximately 1 × 10⁶ cells were seeded in a 35-mm dish at least 3 days before the experiment. Two or three days after the cells reached 100% confluency, the cells were treated with serum-rich medium [DMEM plus 50% horse serum (GIBCO), or with 10 μM forskolin (Sigma)] for either 30 min or 2 h (as in Supporting Methods, which is published as supporting information on the PNAS web site). At the end of the serum or forskolin treatment, the medium was replaced with assay medium (serum-free DMEM without phenol red, catalog no. 13000-021, GIBCO) supplemented with bicarbonate (350 mg/liter) and either 10% FBS or 2% B27 (catalog no. 17504-044, GIBCO) and 10 mM Hepes (pH 7.2), antibiotics (25 units/ml penicillin, 25 μg/ml streptomycin), and 0.1 mM luciferin (Promega). Cells were assayed in the 35-mm Petri dishes sealed with coverslips and a bead of silicon grease. During the assay of the rhythm, the samples were sealed in an air atmosphere so they were no longer exposed to a regulated CO2 environment.
Luminescence Monitoring and Data Analyses. Three different apparatuses were used to monitor the luminescence rhythms of the Rat-1/mPer1::luc reporter cells. The data reported in this article were obtained with one of those apparatuses, a custommade, low-light detection system that is similar to one that was successfully used for circadian luminescence recording of cultured mammalian tissue (10, 20) except that the photomultiplier tube (PMT) module was a side-on H6240 MOD1 (Hamamatsu, Bridgewater, NJ). The H6240 module was placed directly over the samples in a 35-mm dish with 2 ml of assay medium. Each H6240 module was housed in a light-tight dark box that was located in a temperature-controlled environment room. The other two apparatuses were a commercially available luminometer, the PolarStar (BMG Labtechnologies, Durham, NC), and a custom-made instrument that was originally designed to monitor the bioluminescence rhythms of microorganisms (refs. 21 and 22; see Supporting Methods for details).
When baseline correction was done (as in Fig. 3B), it was derived from a 24-h moving average. Regression analyses to determine period and phase of the luminescence rhythms were performed with the CHRONO analysis program (courtesy of T. Roenneberg, University of Munich, Munich). Analysis of damping and bandwidth was performed with the LUMICYCLE data analysis program (Actimetrics, Evanston, IL; courtesy of D. Ferster). The program fits the data to a sine wave multiplied by an exponential decay factor. The damping rate (d) is the time constant of the following exponential fit:
 |
[1] |
where d is the damping rate, L is the luminescence (counts/min), A is the amplitude, f is the frequency of the sine wave, Φ is the phase of the oscillation (relative to the onset of forskolin or horse serum pulse, expressed in radians), and t is time. The data are fit to a low-order polynomial to get a baseline, which is then subtracted from the raw data. A Fourier transform is performed to find the dominant frequency and phase. The time points for the peaks and troughs of the dominant sine wave are taken from the baseline-subtracted data, and the time points are then fitted to an exponential decay, which gives the amplitude (A) and the time constant of the damping (d). Damping rate (d) is the number of days required for the amplitude of the rhythm to decrease to 1/e (≈36.79%) of the starting value.
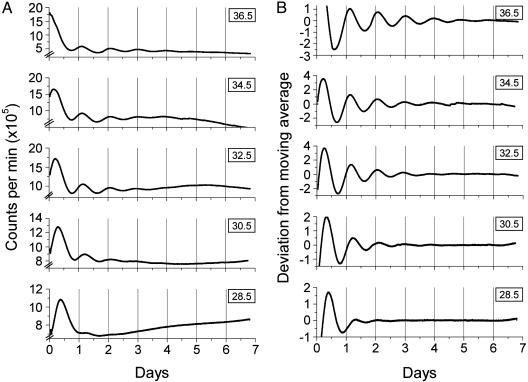
Fig. 3.
Rat-1 luminescence rhythms under five different constant temperatures. Luminescence of Rat-1/PerLuc4-43 cells in DMEM/B27 medium was recorded with the H6240 system. After a 30-min stimulation with 10 μM forskolin, cells were transferred to the constant temperatures shown in the box at the upper right of each trace. Luminescence (counts per min) was recorded for 7 days and plotted against the onset of stimulation time for one representative sample at each temperature (n for each temperature is 8). (A) Raw data. (B) Data after baseline correction. Baseline correction was obtained by calculating a 24-h moving average of the data, and then the deviation of each datum from the moving average was plotted in relative units in B.
Results and Discussion
Luminescence Reporter System to Assay Cell Cultures in Vitro. To facilitate the assay of circadian rhythms in mammalian cell cultures, we established an in vitro luminescence reporter system. We used rat-1 fibroblast cells because (i) this cell line is robust and healthy for days even in fully confluent cultures, and (ii) daily rhythmicity in the mRNA abundance of several genes including rPer1 and rPer2 has already been demonstrated in these cells (11-13, 15, 16). A previous study (18) using luminescence reporters in rat-1 cells relied on transient transfection. However, we reasoned that transient transfections might introduce experiment-to-experiment variability, and therefore we selected and established a rat-1 cell line that stably expressed firefly luciferase driven from the promoter of the mPer1 gene.
We tested three different apparatuses for measuring the luminescence rhythms from the stably transfected rat-1 cells in real time in vitro. The first is a custom-made apparatus that is similar to one used for luminescence monitoring of living tissue from PmPer1::luc transgenic rats (10). It uses a Hamamatsu photon counting module (H6240) to measure the luminescence of rat-1 cells cultured in a 35-mm Petri dish. The other two apparatuses are described in Supporting Methods. In all apparatuses, luminescence was high at the end of the synchronizing treatment (50% serum or forskolin) and then declined to a lower level that oscillates for 3-6 days, with a period that was <24 h (see Fig. 6, which is published as supporting information on the PNAS web site).
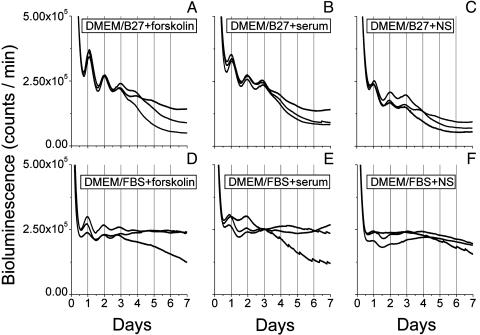
Characterization of the Rat1/PerLuc 4-43 Reporter Assay. Balsalobre et al. (11) used a 2-h pulse of 50% horse serum to induce the daily rhythm in rat-1 cells. That report was followed by other papers that demonstrated that daily oscillations in fibroblasts could also be induced by a 2-h treatment with forskolin (12, 13). Using the Rat1/PerLuc 4-43 reporter cells, we compared these two synchronizing treatments and also tried different durations of the treatments. First, we found that a 30-min treatment with forskolin evoked as robust a luminescence rhythm as a 2-h treatment (see Supporting Methods). Second, we found that both 50% horse serum and 10 μM forskolin acutely activated the mPer1 promoter and triggered the daily oscillation. Representative traces using the H6240 system are depicted in Fig. 1. For free-running measurements in DMEM/B27 medium (see next paragraph), serum or forskolin stimulation gave equivalent, robust oscillations (Fig. 1 A and B). Transfer of cells grown in DMEM plus 5% FBS medium to DMEM/B27 medium also elicited an excellent rhythm (Fig. 1C). On the other hand, when DMEM/FBS medium was used as the free-running condition, forskolin stimulation was significantly better than serum stimulation for eliciting a high amplitude rhythm (Fig. 1, compare D with E). Transfer of cells grown in DMEM plus 5% FBS to fresh DMEM plus 10% FBS (= DMEM/FBS) without stimulation allowed only a weak oscillation (Fig. 1F).
Fig. 1.
Rat-1 luminescence rhythms resulting from forskolin vs. serum stimulation in two different media. Free-running conditions are DMEM/B27 medium for A-C, whereas DMEM/FBS medium was used for D-F. (A and D) Stimulation for 30 min with 10 μM forskolin. (B and E) Stimulation for 30 min with 50% horse serum. (C and F) Cells transferred to fresh media without forskolin or serum stimulation. Three representative examples are shown for each condition. Time 0 = onset of stimulation. Recordings were at 36.5°C (H6240 system).
Balsalobre et al. (11) measured daily mRNA abundance rhythms from rat-1 cells in serum-free medium in a 5% CO2 atmosphere. Our cultures were in containers sealed in an air atmosphere, and, under these conditions, we found that optimal luminescence rhythms from Rat1/PerLuc 4-43 reporter cells were obtained with a more complex medium that included supplements. With their transiently transfected reporter cells, Ueda et al. (18) included 10% FBS in DMEM buffered with Hepes (this is the medium we call DMEM/FBS). As an alternative to FBS, we also tested the B27 supplement that is often used to sustain brain tissue cultures (23). We observed differences between DMEM/FBS and DMEM/B27, depending on which apparatus we used. In the H6240 system, DMEM/B27 medium gave more stable rhythmicity than did DMEM/FBS medium (Fig. 1) whereas DMEM/FBS medium gave more stable oscillations in other monitoring systems (see Supporting Methods).
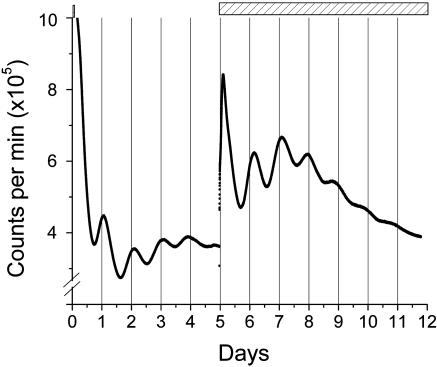
The damping of the oscillation that is obvious in Fig. 1 is not due to the cell cultures becoming unhealthy. This result can be demonstrated by adding forskolin to the cultures after they have damped (Fig. 2). The second treatment with forskolin elicits anew the high amplitude luminescence rhythm.
Fig. 2.
Second forskolin treatment reinitiates rhythmicity. The time of the initial 30-min pulse of 10 μM forskolin is shown as the small bar near the “10” on the ordinate. After 5 days, the luminescence rhythm has damped, but the addition of 10 μM forskolin (now as a continuous treatment without a change of medium, see long bar at top of figure) reinitiates the rhythm. Recording was at 36.5°C (H6240 system).
Temperature Compensation of Luminescence Rhythms in Rat-1 Cells. To determine whether the daily rhythms in rat-1 cells are temperature compensated, we measured the rhythms from Rat-1/PerLuc 4-43 cells over the temperature range of 28.5°C to 36.5°C. The raw data are shown in Fig. 3A, and the same data with baseline correction are shown in Fig. 3B to aid visualization of the rhythms. The phase of the first peak is clearly a function of temperature, with a later phase at colder temperatures (Fig. 3A). This observation is reminiscent of the case of the circadian eclosion rhythm of Drosophila (1), which shows a similar temperature dependence of phase angle. The subsequent oscillation of Rat-1/PerLuc 4-43 cells is most robust at higher temperatures (32.5-36.5°C), but, even at 28.5°C, at least three peaks can be discerned.
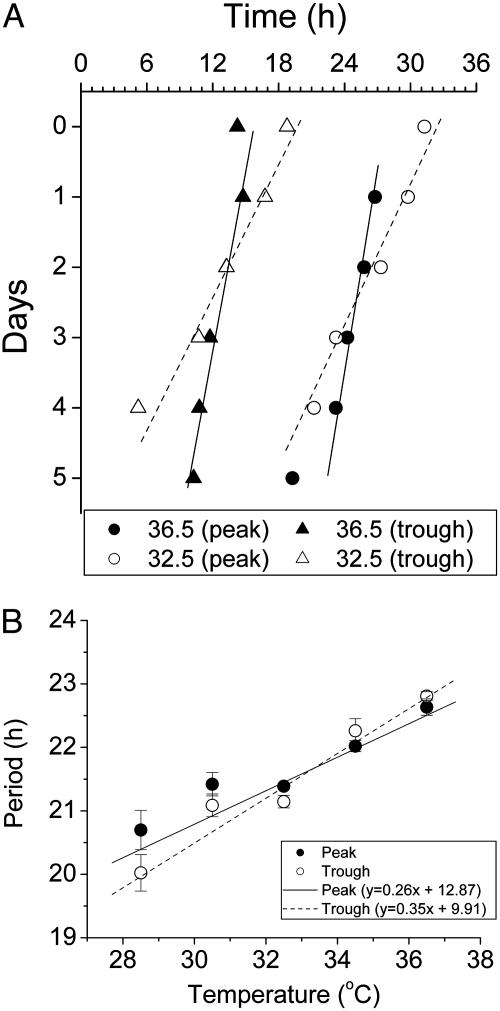
The periods of the rhythms were determined by a regression analysis using both peaks and troughs as phase reference points (Fig. 4A). When the rhythm was assayed at 36.5°C, the period was 22.6 ± 0.13 h when the peaks were taken as phase reference points, and 22.8 ± 0.07 h when troughs were the phase reference points (± SEM). At lower temperatures, the frequency of the rhythm became faster, so that the period became shorter. At 28.5°C, the period was 20.7 ± 0.3 h (by peaks) and 20.0 ± 0.3 h (by troughs). There was an approximately linear trend of the shortening of the period as a function of the temperature decrease (Fig. 4B). The Q10 calculated for these data were 0.88 (by analysis of peaks) and 0.85 (by analysis of troughs). Circadian rhythms of mRNA abundance in NIH 3T3 cells demonstrate a similar Q10 value (Q10 of 0.88) over the temperature range 33°C to 42°C (17).
Fig. 4.
Temperature compensation of the PmPer1::luc rhythm expressed by rat-1 cells (H6240 system). (A) Determination of period by regression analyses. The original raw data (1-min bins) were combined into 30-min bins and analyzed by the chrono program. First, the data were smoothed with a 2-h moving average, and the data were corrected for changes in baseline by calculating the deviation from a 24-h moving average as in Fig. 3B. Peaks and troughs from the baseline-corrected data were used for regression analyses. Two examples (36.5°C and 32.5°C) are shown in A (same data as the 36.5°C and 32.5°C traces shown in Fig. 3). (B) Circadian periods at five different temperatures were determined by regression analysis using the two different phase reference points (peaks vs. troughs). Eight separate cultures were used for each temperature, and the error bars are SEM. The number of cycles used for analyses was three for 28.5°C, three to four for 30.5°C, and four to six for the warmer temperatures. The Q10 calculated from the peak data is 0.88 and from the trough data is 0.85.
Most biochemical reactions are temperature dependent, as indicated by Q10 values of 2-3. As described in the Introduction, a salient characteristic of circadian oscillators is temperature compensation such that the Q10 is usually between 0.8 and 1.2 (1, 5, 6). Temperature compensation has sometimes also been observed for ultradian rhythms, but this result is much less common (see ref. 24 for an example). The temperature compensation inherent in Rat-1/PerLuc cells (Q10 = 0.85-0.88) lies within the range observed for other circadian clocks and confirms that the daily oscillations of rat-1 cells are regulated by a circadian clock. In fact, this temperature dependency indicates that the circadian clock of rat-1 cells is over-compensated; this clock oscillates faster at cooler temperatures. Although temperature overcompensation has been observed previously, Q10 values for circadian clocks that are slightly less than 1.0 are much less common than those that are slightly greater than 1.0 (6).
Role of Temperature Compensation in Nonneural Mammalian Cells. Temperature compensation has been previously observed for circadian oscillators in neural tissue from homeotherms (7-9). We used a stably transfected luminescence reporter system to demonstrate temperature compensation in a nonneural mammalian tissue. A recent study (17) using different techniques and cell lines also found temperature compensation in mammalian cultured cells. A study of mammalian cell cycles suggested that there might be temperature compensation over narrow temperature ranges in the rate of cell division, but this 8- to 12-h cycle is clearly not a circadian rhythm (25). The comparison of neural tissues with fibroblasts with regard to temperature compensation is consistent with the interpretation that the circadian clockworks in neural tissue and in nonneural tissue may be essentially the same.
Why might the circadian clocks of peripheral tissue maintain temperature compensation in an organism that regulates its body temperature? One hypothesis capitalizes on the fact that the body temperature of homeotherms is not constant but usually exhibits a daily (circadian) rhythm with an amplitude of 1-2°C each day (26). Moreover, tissues in the extremities could be exposed to very significant changes in temperature if the temperature of the environment fluctuates dramatically (27). Therefore, peripheral circadian clocks might benefit from temperature compensation so as to buffer themselves from both endogenous and exogenous changes in temperature. However, an independent line of speculation is based on evolutionary considerations. Circadian clocks certainly evolved first in poikilothermic organisms, where the selective pressure toward having a temperature-compensated clock must be strong. This selection may have led to the evolution of clock mechanisms in which temperature compensation was so tightly integrated with the clockworks that compensation was retained in homeothermic organisms where the selective pressure for a temperature-compensated clock is likely to be weaker than in poikilotherms. Whether these hypotheses be true or not, the data reported herein and elsewhere (17) clearly indicate that nonneural mammalian cells are capable of temperature-compensated circadian circuits.
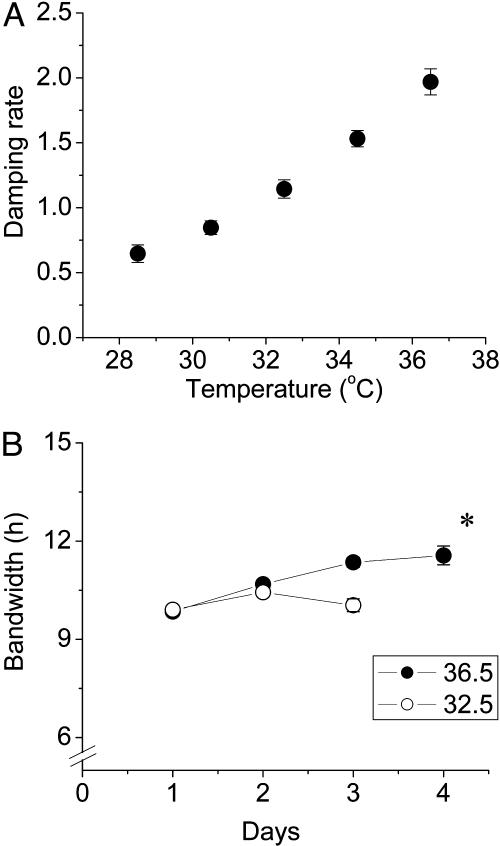
Damping of the Oscillation. The oscillation of Per1 promoter activity damps after several days in rat-1 cells in vitro. A similar phenomenon was observed for slices of peripheral tissue in vitro (10). This damping is not a result of the cell cultures becoming unhealthy, as is demonstrated in Fig. 2 by the reinitiating of rhythmicity by a subsequent forskolin treatment. The luminescence rhythm damps more rapidly at cooler temperatures (Figs. 3B and 5A). The basis of this damping is unknown. One hypothesis to explain damping is that the periods of individual cells are sufficiently different from each other that the population desynchronizes during the free-run, but that the pacemaker in each cell is still oscillating. Another viable hypothesis is that the pacemaker in each cell damps during the free-run in the absence of regular entraining stimuli that presumably occur in vivo.
Fig. 5.
Analyses of damping. (A) Damping rates of rat-1 luminescence rhythms as a function of temperature were determined by using lumicycle data analysis software (Actimetrics, Evanston, IL). As plotted, damping rate (d in the equation) is the number of days (= 24 h) required for the amplitude of the rhythm to decrease to 1/e (≈36.79%) of the starting value. Mean ± SEM for each temperature (n = 8) is depicted. (B) Bandwidth of rhythms for the 36.5°C and 32.5°C data. Bandwidth was measured as the number of hours between the half-maximum of the rising phase and the half-minimum of the falling phase for each cycle. Abscissa is days in the free-run after forskolin stimulation. Data are mean ± SEM; n = 8 for all points except the point marked with an asterisk, where n = 6.
One way to distinguish between these two hypotheses would be to analyze the bandwidth of the rhythm as a function of time. If the “desynchronization” hypothesis is correct, then the bandwidth should broaden as the rhythm dampens whereas, if the “pacemaker damping” hypothesis is correct, the rhythm may dampen without a bandwidth increase. Fig. 5B shows that the bandwidth increases only marginally (<2 h over three cycles) at 36.5°C, and does not increase at 32.5°C. The increase of bandwidth at 36.5°C is not large enough to account for the damping of the rhythms. Although not conclusive, these analyses suggest that the damping of the rhythms are likely to be due to a damping of the rat-1 pacemaker itself and not to desynchronization of cells within the population. Perhaps the self-sustainability of the fibroblast clock is greatest at temperatures near the physiological (≈37°C). This type of temperature-dependent “conditionality” of circadian rhythm expression has been reported (28) for the endogenous bioluminescence rhythm of the dinoflagellate alga Gonyaulax. This analysis implies that the initiation of the rhythm in rat-1 cells is due to the stimulation of a quiescent pacemaker, which was an issue raised in the original publication (11).
Luminescent Mammalian Cell Cultures as a New Model System. Luminescence reporters have been a valuable tool for noninvasive monitoring of circadian rhythms in a number of systems, including the endogenous bioluminescence of Gonyaulax (6, 21), and genetically engineered transgenic strains of cyanobacteria (22), plants (29), and mammals (10, 20). These rhythmically glowing organisms have been indispensable for physiological experiments and for genetic screens. A transiently transfected system for mammalian cell cultures was reported (18), but we have here more fully characterized a stably transfected system whose rhythms are reproducible and convenient to measure. These stably transfected cells combine the advantages of homogenous cell cultures with the precision of continuous luminescence monitoring to provide a beneficial model system.
Supplementary Material
Acknowledgments
We thank Dr. Doug McMahon for the DNA encoding the mPer1 promoter and Ms. Jean Jackson (J. M. Bishop's laboratory) for giving us rat-1 cells. We thank Drs. Aurelio Balsalobre and Ueli Schibler for advice about measuring rhythms from rat-1 cells, and Dr. Tetsuya Mori for advice and assistance in early phases of this project. We also thank Dr. Till Roenneberg for the chrono program and Dr. David Ferster for the lumicycle data analysis program that we used for data analyses. This work was supported by National Institute of Mental Health Grants R01 MH43836 and K02 MH01179 (to C.H.J.).
References
- 1.Pittendrigh, C. S. (1954) Proc. Natl. Acad. Sci. USA 40, 1018-1029. [DOI] [PMC free article] [PubMed] [Google Scholar]
- 2.Kalmus, H. (1940) Nature 145, 72-73. [Google Scholar]
- 3.Pittendrigh, C. S. (1993) Annu. Rev. Physiol. 55, 17-54. [DOI] [PubMed] [Google Scholar]
- 4.Hastings, J. W. (2001) J. Biol. Rhythms 16, 5-18. [DOI] [PubMed] [Google Scholar]
- 5.Johnson, C. H., Elliott, J. A, Foster, R. G., Honma, K.-I. & Kronauer, R. (2003) in Chronobiology: Biological Timekeeping, eds. Dunlap, J. C., Loros, J. J. & Decoursey, P. J. (Sinauer, Sunderland, MA), pp. 66-105.
- 6.Sweeney, B. M. & Hastings, J. W. (1960) Cold Spring Harbor Symp. Quant. Biol. 25, 87-104. [DOI] [PubMed] [Google Scholar]
- 7.Barrett, R. K. & Takahashi, J. S. (1995) J. Neurosci. 15, 5681-5692. [DOI] [PMC free article] [PubMed] [Google Scholar]
- 8.Tosini, G. & Menaker, M. (1998) NeuroReport 9, 1001-1009. [DOI] [PubMed] [Google Scholar]
- 9.Ruby, N. F., Burns, D. E. & Heller, H. C. (1999) J. Neurosci. 19, 8630-8636. [DOI] [PMC free article] [PubMed] [Google Scholar]
- 10.Yamazaki, S., Numano, R., Abe, M., Hida, A., Takahashi, R., Ueda, M., Block, G. D., Sakaki, Y., Menaker, M. & Tei, H. (2000) Science 288, 682-685. [DOI] [PubMed] [Google Scholar]
- 11.Balsalobre, A., Damiola, F. & Schibler, U. (1998) Cell 93, 929-937. [DOI] [PubMed] [Google Scholar]
- 12.Balsalobre, A., Marcacci, L. & Schibler, U. (2000) Curr. Biol. 10, 1291-1294. [DOI] [PubMed] [Google Scholar]
- 13.Yagita, K. & Okamura, H. (2000) FEBS Lett. 465, 79-82. [DOI] [PubMed] [Google Scholar]
- 14.Akashi, M. & Nishida, E. (2000) Genes Dev. 14, 645-649. [PMC free article] [PubMed] [Google Scholar]
- 15.Yagita, K., Tamanini, F., van Der Horst, G. T. & Okamura, H. (2001) Science 292, 278-281. [DOI] [PubMed] [Google Scholar]
- 16.Duffield, G. E., Best, J. D., Meurers, B. H., Bittner, A., Loros, J. J. & Dunlap, J. C. (2002) Curr. Biol. 12, 551-557. [DOI] [PubMed] [Google Scholar]
- 17.Tsuchiya, Y., Akashi, M. & Nishida, E. (2003) Genes Cells 8, 713-720. [DOI] [PubMed] [Google Scholar]
- 18.Ueda, H. R., Chen, W., Adachi, A., Wakamatsu, H., Hayashi, S., Takasugi, T., Nagano, M., Nakahama, K., Suzuki, Y., Sugano, S., et al. (2002) Nature 418, 534-539. [DOI] [PubMed] [Google Scholar]
- 19.Kuhlman, S. J., Quintero, J. E. & McMahon, D. G. (2000) NeuroReport 15, 1479-1482. [PubMed] [Google Scholar]
- 20.Geusz, M. E., Fletcher, C., Block, G. D., Straume, M., Copeland, N. G., Jenkins, N. A., Kay, S. A. & Day, R. N. (1997) Curr. Biol. 7, 758-766. [DOI] [PubMed] [Google Scholar]
- 21.Broda, H., Gooch, V. D., Taylor, W., Aiuto, N. & Hastings, J. W. (1986) J. Biol. Rhythms 1, 251-263. [DOI] [PubMed] [Google Scholar]
- 22.Kondo, T., Strayer, C. A., Kulkarni, R. D., Taylor, W., Ishiura, M., Golden, S. S. & Johnson, C. H. (1993) Proc. Natl. Acad. Sci. USA 90, 5672-5676. [DOI] [PMC free article] [PubMed] [Google Scholar]
- 23.Brewer, G. J., Torricelli, J. R., Evege, E. K. & Price, P. J. (1993) J. Neurosci. Res. 35, 567-576. [DOI] [PubMed] [Google Scholar]
- 24.Murray, D. B, Roller, S., Kuriyama, H. & Lloyd, D. (2001) J. Bacteriol. 183, 7253-7259. [DOI] [PMC free article] [PubMed] [Google Scholar]
- 25.Klevecz, R. R. (1976) Proc. Natl. Acad. Sci. USA 73, 4012-4016. [DOI] [PMC free article] [PubMed] [Google Scholar]
- 26.Rensing, L. & Ruoff, P. (2002) Chronobiol. Int. 19, 807-864. [DOI] [PubMed] [Google Scholar]
- 27.Brown, S. A., Zumbrunn, G., Fleury-Olela, F., Preitner, N. & Schibler. U. (2002) Curr. Biol. 12, 1574-1583. [DOI] [PubMed] [Google Scholar]
- 28.Njus, D., McMurry, L. & Hastings, J. W. (1977) J. Comp. Physiol. 117, 335-344. [Google Scholar]
- 29.Millar, A. J., Carré I. A., Strayer, C. A., Chua, N. H., Kay, S. A. (1995) Science 267, 1161-1163. [DOI] [PubMed] [Google Scholar]
Associated Data
This section collects any data citations, data availability statements, or supplementary materials included in this article.


