

Abstract
Magnetic resonance spectroscopy (MRS), a companion technique to the more familiar MRI scan, has emerged as a powerful technique for studying metabolism noninvasively in a variety of tissues. In this article, we review two techniques that we have developed which take advantage of the unique characteristics of 31P and 13C MRS to investigate two distinct parameters of muscle mitochondrial metabolism; ATP production can be estimated by using the 31P saturation-transfer technique, and oxidation via the TCA cycle can be modeled from 13C MRS data obtained during the metabolism of a 13C-labeled substrate. We will also examine applications of the techniques to investigate how these parameters of muscle mitochondrial metabolism are modulated in insulin resistant and endurance trained individuals.
1. Introduction
The prevalence of type 2 diabetes has dramatically increased over the past 25 years, and has been predicted to maintain this expansion over the next two decades (Wild et al., 2004). Although causal mechanisms remain to be elucidated, the development of insulin resistance assumes a key, early role in the pathogenesis of most cases of diabetes (Haffner et al., 1990; Lillioja et al., 1987; Warram et al., 1990). Elevated, fasting plasma fatty acid concentrations are a hallmark of insulin resistance in obese and diabetic individuals (Boden and Shulman, 2002), and an inverse relationship between insulin sensitivity and circulating fatty acid levels has also been observed in normal-weight offspring of type 2 diabetic patients (Perseghin et al., 1997). Skeletal muscle triglyceride (TG) content, estimated from biopsy samples, was found to be negatively correlated with insulin sensitivity (Pan et al., 1997) and more recently, several studies have demonstrated an even stronger association with intramyocellular lipid (IMCL) content, estimated using magnetic resonance (MR) techniques (Krssak et al., 1999; Perseghin et al., 1999; Szczepaniak et al., 1999), in healthy, as well as insulin resistant individuals. This relationship is conserved in other insulin-responsive tissues, for example, liver (Petersen et al., 2002, 2005; Seppala-Lindroos et al., 2002), suggesting that dysregulation of lipid metabolism may contribute to insulin resistance in these individuals. Substantiated by numerous animal studies, mechanisms for lipid-induced insulin resistance have been proposed (Morino et al., 2006; Savage et al., 2007; Shulman, 2000), that attribute impaired insulin action in muscle and liver to the presence of lipid intermediates, in particular diacylglycerol (DAG), rather than intracellular TG per se, which interfere with the insulin-signaling cascade.
1.1. Mitochondrial fatty acid oxidation and insulin resistance
The net accumulation of intracellular lipid metabolites in muscle could either be caused by increased delivery and uptake of fatty acids, by decreased utilization, or a combination of these factors (Shulman, 2000). Intriguingly, a number of muscle biopsy studies demonstrated that the occurrence of obesity and/or diabetes was accompanied by a decrease in the content and activity of mitochondrial enzymes (Colberg et al., 1995; He et al., 2001; Kelley et al., 1999; Ritov et al., 2005; Simoneau and Kelley, 1997; Simoneau et al., 1999) suggesting that impaired fatty acid oxidation may contribute to the pathogenesis of these conditions. Mitochondrial density was also found to be reduced in the muscle of obese and type 2 diabetics accompanied by smaller and morphologically damaged mitochondria (Kelley et al., 2002) and analysis of gene-chip datasets indicated that down-regulation of genes associated with oxidative metabolism may occur in a coordinate manner in obese, type 2 diabetic individuals (Mootha et al., 2003; Patti et al., 2003) and overweight, nondiabetic subjects with a family history of diabetes (Mootha et al., 2003; Patti et al., 2003). However, one limitation of these muscle biopsy studies is that they provide an index of mitochondrial capacity but may not represent function. We therefore sought to implement techniques by which muscle mitochondrial function could be determined in vivo.
2. In Vivo Magnetic Resonance Spectroscopy
Since its initial demonstration as a viable methodology for in vivo research (Hoult et al., 1974), Magnetic resonance spectroscopy (MRS) has emerged as a powerful technique for studying metabolic function in a variety of tissues in both animals and humans (Dobbins and Malloy, 2003; Prompers et al., 2006; Shulman et al., 1996). MRS is a companion technique to the more familiar magnetic resonance imaging (MRI) scan, which is in widespread use providing clinical anatomical images. Unlike MRI, which measures the spatial distribution of water in the region of interest, MRS determines the content of MR visible nuclei. Isotopes of many biologically relevant elements are MR visible, including hydrogen, carbon, and phosphorus. Each has a characteristic resonance frequency in the presence of a strong static magnetic field, i.e., within the MR scanner. What makes MRS of particular utility is that the chemical environment of a nucleus also influences its precise frequency, a phenomenon which gives rise to the MRS spectrum. Therefore, within a tissue of interest, the content of specific compounds and their constituent chemical groups can be resolved and determined using in vivo MRS. Figure 21.1 illustrates examples of in vivo spectra obtained from muscle showing two nuclei of metabolic relevance, phosphorus (31P) and carbon (13C).
Figure 21.1.

Typical 31P (A) and 13C (B) MRS spectra acquired from the soleus-gastrocnemius muscle complex in vivo.
The advantages of MRS as a tool for investigating muscle metabolism are considerable. It is safe, noninvasive, involves no ionizing radiation and permits repeated measures of metabolites during a single session, or over an extensive study. It is, therefore, ideal for monitoring dynamic metabolic processes. Multinuclear capabilities enable a plethora of information to be collected and provide the flexibility to study independent parameters of metabolism during the same experiment. However, MRS is a relatively insensitive technique compared to other imaging/spectrometry modalities, for example, PET (Positron Emission Tomography) or mass spectrometry, and metabolite concentrations in the millimolar range are required to be observed in vivo. Specialized equipment is necessary, although spectroscopy packages are now available for the new generation of clinical MR scanners.
As can be seen in panel A, a 31P spectrum obtained from muscle is characterized by peaks due to phosphocreatine (PCr), the three (α, β, and γ) phosphate moieties of adenosine tri-phosphate (ATP), unbound inorganic phosphate, and mono- and di-phosphoesters (PME, PDE). With the exception of adenosine di-phosphate (ADP), which is present in too low a concentration to be observed in resting muscle, the principal metabolites involved in energy transduction can be observed which makes in vivo 31P MRS particularly useful for studying muscle energetics.
Since all organic compounds contain carbon atoms, 13C MRS can provide information on a huge number of compounds involved in muscle metabolism. High resolution 13C spectra of muscle extracts contain a myriad of overlapping peaks corresponding to different metabolites and their constituent carbons. In vivo, this situation is somewhat simplified, due to the low natural abundance of 13C (1.1% of total carbon) and the high concentration of lipids compared to other metabolites. An in vivo muscle 13C spectrum (Fig. 21.1B) is dominated by peaks due to the fatty acid and glycerol components of lipid, accompanied by peaks of other metabolites present in relatively high concentrations. However, this potential drawback can be turned to an advantage by infusing a 13C-labeled compound and using 13C MRS to monitor the metabolism of this tracer.
This article focuses on two techniques we have developed which take advantage of the unique characteristics of 31P and 13C MRS to investigate different facets of human muscle mitochondrial metabolism. The terminal stage of mitochondrial energy production can be estimated by using a 31P magnetization-transfer technique to determine the unidirectional flux of Pi → ATP (“ATP synthesis”), and oxidation via the TCA cycle can be assessed by applying a metabolic model to 13C MRS data obtained during the oxidation of a 13C-labeled substrate. After providing a thorough description of the implementation of the techniques, we will describe how these parameters of muscle metabolism are modulated in insulin resistant and endurance trained individuals.
2.1. Examining exchange reactions by magnetization-transfer MRS
Although ATP can be synthesized from several sources, the principal synthetic reaction is from the combination of ADP and Pi which occurs primarily in mitochondria. ATP synthesis is in equilibrium with ATP hydrolysis as shown in Eq. (21.1), forming a phosphate exchange reaction with forward and reverse rate constants, kf and kr. The rate of ATP synthesis (VATP) is therefore equivalent to the forward rate constant multiplied by the concentrations of ADP and Pi, Eq. (21.2). Under steady-state conditions, where the concentration of ADP can be assumed to remain constant, this relationship can be further simplified such that VATP is the product of the pseudo-first-order rate constant (for Pi), , and the Pi concentration, Eq. (21.3).
| (21.1) |
| (21.2) |
| (21.3) |
The unidirectional fluxes involved in an exchange reaction can be studied using MRS since the magnetic equilibrium of the participant metabolites can be perturbed and monitored, while the chemical equilibrium remains intact. This effect can be accomplished using magnetization-transfer techniques (Forsen and Hoffman, 1963; Hoffman and Forsén, 1966). As mentioned above, a 31P MRS spectrum detects signals from the “high-energy phosphates” involved in cellular energetics. Therefore, the ATP synthesis flux (Pi → ATP) can be estimated, since both the ATP and Pi metabolite pools are visible.
During an MRS experiment, the signal of a particular metabolite can be expressed using the Bloch equations (Bloch, 1946), which describe the variation of the MRS signal over time. These can be modified to incorporate chemical exchange (McConnell, 1958). The response of the Pi signal involved in Pi ↔ ATP exchange is shown in Eq. (21.4):
| (21.4) |
where MPi is the Pi magnetization, is the equilibrium Pi magnetization, MATP is the γ-ATP magnetization, and is the longitudinal relaxation time of Pi.
During a magnetization-transfer experiment, the γ-phosphate peak of ATP (i.e., that which participates in exchange) can be selectively irradiated using a long-duration, frequency-selective, saturation pulse to equalize its spin-states and eliminate its signal, i.e., MATP = 0, which simplifies the Bloch equation to Eq. (21.5).
| (21.5) |
Effectively this states that under conditions of γ-ATP saturation, the signal of Pi will decrease due to Pi → ATP flux. A solution to this equation is, Eq. (21.6):
| (21.6) |
Steady-state saturation is attained following a long duration saturation pulse. Under these conditions t → ∞, the second term in Eq. (21.6) vanishes, and it simplifies to:
| (21.7) |
The T1 relaxation times of Pi under γ-ATP saturated ( and non-saturated conditions are related by the expression: . Substitution into Eq. (21.7) and rearranging gives the classic equation of saturation transfer, Eq. (21.8).
| (21.8) |
Therefore, the pseudo-first-order rate constant for ATP synthesis is equivalent to the change in the Pi signal from equilibrium conditions (without saturation, ) to γ-ATP saturated conditions () expressed in units of the T1 of Pi under conditions of γ-ATP saturation ().
2.2. Measuring muscle ATP synthesis in vivo by 31P saturation-transfer MRS
The application of the 31P saturation-transfer technique to a biological system was initially used to measure the kinetics of the bacterial ATPase (Brown et al., 1977), and has since been implemented in a variety of in vitro and in vivo systems (Alger et al., 1982; Brindle et al., 1989; Lei et al., 2003; Matthews et al., 1981). We have successfully used the technique to investigate the synthesis of ATP in resting human muscle using 2.1 T and 4 T whole-body MR systems. Experimentally, our methodology incorporates three separate elements: (1) calculation of the saturation-transfer effect (i.e., ) caused by γ-ATP saturation on Pi; (2) calibration of the T1 of Pi under conditions of γ-ATP saturation (i.e., ), together these parameters can be inserted into Eq. (21.8) to derive the rate constant for ATP synthesis; and (3) determination of the in vivo Pi concentration (i.e., [Pi]), which enables the unidirectional Pi → ATP flux to be calculated by solving Eq. (21.3).
The saturation-transfer effect can be determined by using a simple pulse-acquire MRS sequence preceded by a long, low power, frequency-selective saturation pulse (Fig. 21.2A). In vivo, muscle 31P spectra are typically acquired using surface coils, therefore, adiabatic (B1 insensitive) pulses are preferred for optimal signal excitation (de Graaf, 2008). Pairs of spectra are acquired with the saturation pulse centered on the γ-ATP resonance or at a downfield frequency equidistant from Pi, to partially compensate for off-resonance effects of the saturation pulse, which can be significant, particularly at lower field strengths (Kingsley and Monahan, 2000a,b). Precise acquisition parameters are system dependent; at 4 T, we use a 9 cm surface coil for 31P spectroscopy of the soleus/gastrocnemius muscle complex, an adiabatic half passage (90°) pulse for excitation and a 15 s “soft” pulse for saturation. A typical pair of saturation-transfer spectra acquired with these parameters is shown in Fig. 21.3. The T1 of Pi under conditions of γ-ATP saturation is measured by an 8-point inversion-recovery calibration using a customized sequence (Fig. 21.2B), with γ-ATP saturation not only prior to the adiabatic full passage (180°) inversion pulse, but also during the variable inversion delay to maintain steady-state saturation of the γ-ATP spins. Inversion recovery data is fitted by a 3-parameter model (MacFall et al., 1987), optimized using a nonlinear least squares algorithm. A fully relaxed 31P spectrum acquired without saturation is used to determine intracellular [Pi], assuming a constant muscle ATP concentration of 5.5 mmol/kg (Kemp et al., 2007).
Figure 21.2.
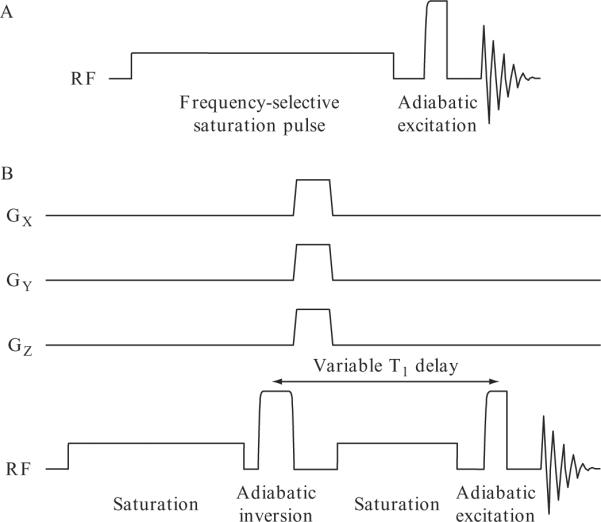
Pulse sequences for the 31P saturation-transfer experiment. (A) Pulse-acquire sequence with RF saturation. A long, low power, frequency-selective saturation pulse precedes signal excitation/detection. Adiabatic excitation pulses are optimal for in vivo MRS using surface coils. (B) Inversion-recovery with RF saturation for calibration. Frequency-selective saturation of the γ-ATP peak is applied prior to the adiabatic inversion pulse, and during the variable inversion-delay to maintain steady-state spin saturation throughout the inversion-recovery measurement.
Figure 21.3.
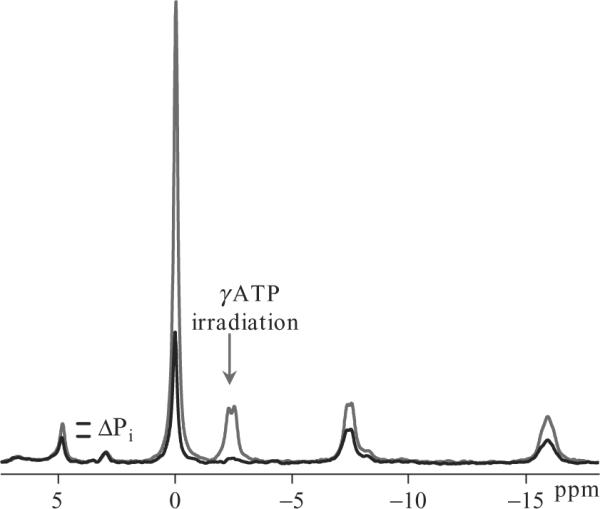
In vivo muscle 31P spectra acquired from the soleus-gastrocnemius muscle complex during a saturation-transfer experiment. Spectra are acquired with (black spectrum) and without (gray spectrum) frequency-selective irradiation of the γ-ATP peak. The rate constant of exchange is equivalent to the decrease in the Pi peak upon γATP saturation divided by the T1 relaxation time .
2.3. Monitoring metabolic fluxes using 13C MRS
As mentioned previously, 13C MRS offers a method to examine the metabolism of carbon-based compounds in vivo. The metabolic fate of a 13C-labeled substrate can be monitored in real time, providing that it is metabolized sufficiently rapidly to induce a significant, dynamic enrichment in one of its metabolic products, that this product can be resolved from other metabolites with 13C MRS and that it is of high enough concentration to be detected in vivo. For mitochondrial metabolism, the TCA cycle, which participates in the oxidation of lipids and carbohydrate, is ideally suited for examination by this technique.
Substrates derived from either source enter the cycle via the common intermediate, acetyl CoA, and are metabolized through a series of condensation, isomerization and oxidation (decarboxylation) reactions in the mitochondrial matrix ultimately producing carbon dioxide, NADH and FADH2, the latter of which are oxidized by the electron transport chain. The 13C label can be introduced into the cycle as shown in Fig. 21.4 by infusing [2-13C]-labeled acetate as an MR-visible tracer, which is rapidly taken up by muscle and other tissues and converted into [2-13C]-acetyl-CoA that enters the TCA cycle by condensing with oxaloacetate to form [4-13C]-citrate. The position of the 13C label is conserved through the initial steps of the TCA cycle, labeling α-ketoglutarate at the C4 position. The principal TCA-cycle intermediates (TCAI) are present in concentrations that are too low to be observed in vivo using 13C MRS. However, glutamate, which is present in millimolar concentrations in muscle, is in relatively rapid exchange with α-ketoglutarate and will also become 13C enriched at C4. As the TCA cycle progresses, the 13C label becomes scrambled between the C2 and C3 positions due to the symmetry of the succinate molecule; a second turn of the TCA cycle yields [2-13C] and [3–13C]-glutamate.
Figure 21.4.

Oxidation via the TCA cycle: substrate derived from carbohydrate and lipid enters the cycle via the common intermediate acetyl CoA. Infused plasma [2-13C]-acetate is converted to acetyl CoA, and the 13C label (denoted by *) becomes incorporated into the muscle TCA-cycle intermediate and glutamate pools forming [4-13C] glutamate on the first turn of the TCA cycle. The 13C label becomes scrambled between the C2 and C3 positions due to the symmetry of the succinate molecule; a second turn of the cycle forms [2-13C] and [3-13C]-glutamate. Reaction rates incorporated into the metabolic model to calculate the TCA cycle flux (VTCA) are shownand described in the text. Adapted and reprinted from Befroy et al. (2008a); © 1993–2008 by The National Academy of Sciences of the United States of America, all rights reserved.
Unlike brain, where natural abundance [4-13C]-glutamate can be resolved in an in vivo 13C MRS spectra, the C4 glutamate peak at 34.3 ppm in muscle is obscured by overlapping lipid resonances as shown in Fig. 21.1. The contribution from sub-cutaneous fat can be eliminated by using a localized MRS sequence to selectively acquire signal from muscle only. The IMCL contribution is also significant, but can be minimized by an inversion-null strategy which takes advantage of the more rapid T1 relaxation times of lipid moieties compared to other metabolites as shown in Fig. 21.5. At 4 T, we use an adiabatic 1H–13C polarization-transfer (PT) sequence (Burum and Ernst, 1980; Shen et al., 1999) for 13C acquisition with WALTZ 16 decoupling. PT echo-times are optimized for C4 glutamate detection. Spectra are acquired using a 9 cm diameter 13C surface coil positioned underneath the soleus-gastrocnemius muscle complex of the calf, with twin, orthogonal 13 cm diameter 1H surface coils arrayed in quadrature for decoupling and excitation/inversion on the 1H channel. Voxel localization is achieved using 2-dimensional outer volume suppression (OVS) to select a ~90 cm3 volume within the calf muscles. OVS enables the maximal 13C metabolite signal to be acquired, although an ISIS-based localization scheme could also be implemented. IMCL is suppressed using adiabatic T1-selective nulling, as described above, optimized for the lipid resonance at 34.7 ppm. Previously, we have used direct 13C detection with decoupling at 2.1 T (Lebon et al., 2001); however, the acquired 13C signal is enhanced approximately 2-fold in vivo by using a PT sequence, and localization and lipid suppression can be performed on the 1H channel where there is less error due to chemical shift dispersion.
Figure 21.5.
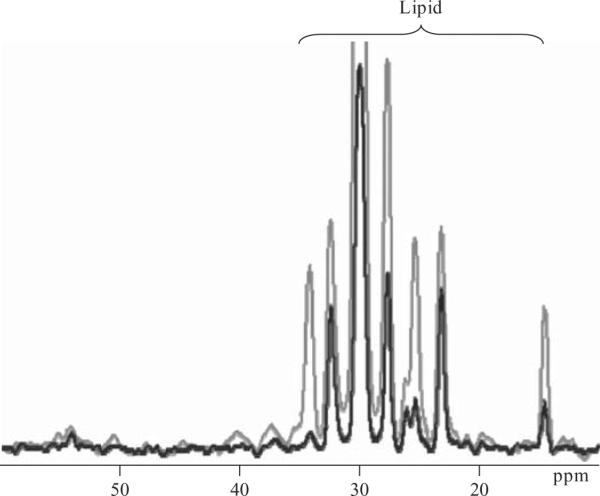
Natural abundance 13C spectra acquired from the soleus-gastrocnemius muscle complex demonstrating the use of lipid suppression techniques to minimize the contribution of subcutaneous fat and IMCL resonances to the spectrum.
To determine the TCA cycle flux, the time course of 13C incorporation into C4-glutamate is monitored during a 120-min infusion of 99% enriched [2-13C]-acetate (350 mmol/l sodium salt) at a rate of 3.0 mg/kg/min. 13C spectra are acquired with ~5 min time resolution for 20 min prior to the infusion to establish a baseline, and continuously until the end of the experiment. Plasma samples are obtained at 10 min intervals throughout the experiment for the measurement of plasma acetate concentration and fractional enrichment by gas chromatography/mass spectrometry (Befroy et al., 2007). Steady-state enrichment of plasma acetate is attained within 5 min of originating the infusion and reaches ~85%; with the concentration of plasma acetate approximately 0.80 mM, consistent with functioning as a tracer-level substrate. To eliminate any residual contribution of lipid, the increment in the C4-glutamate peak during the infusion is determined from difference spectra created by subtracting averaged baseline spectra from the 13C spectrum for each time-point. The maximal enrichment in the [4-13C]-glutamate peak is calculated relative to that of the C2-glutamate peak assuming partial (5%) dilution of the C2 pool due to anaplerosis. The absolute enrichment of the C2-glutamate peak at the end of infusion is determined relative to the natural abundance enrichment (1.1%) of the baseline spectra.
2.4. Metabolic modeling of the TCA cycle flux
The TCA cycle flux (VTCA) is determined by using CWave software to model the incorporation of 13C label from plasma [2-13C]-acetate into the muscle [4-13C]-glutamate pool. The CWave model consists of isotopic mass balance equations shown below that describe the metabolic fate of the plasma [2-13C]-acetate. The corresponding reaction rates are noted in Fig. 21.4. The 13C label enters the TCA cycle following the conversion of [2-13C]-acetate into [2-13C]-acetylCoA (VAC). Entry of unlabeled substrates via acetyl CoA is incorporated into the model as a separate reaction (VPDH + FA). CWave determines VTCA as the rate of total carbon flow from acetyl CoA to α-ketoglutarate using a non-linear least-squares algorithm to fit the curve of C4-glutamate enrichment. The rate of α-ketoglutarate/glutamate exchange has been determined in previous studies and is fixed at 150 nmol/g(muscle)/min which is significantly faster than the TCA cycle flux, and therefore non-limiting. In this model, VTCA is equal to the sum of (VAC + VPDH + FA) but is independent of the absolute fractional enrichment at C4-glutamate (VAC/VPDH + FA). The intracellular concentration of glutamate has been determined by enzymatic analysis of muscle biopsy samples from healthy individuals, and is assumed to be 2.41 mmol/l in all subject groups (Lebon et al.,2001). In our in vivo studies to date, the ratio of natural abundance C2-glutamate/C2-creatine is unaffected by the study population indicating that the intracellular concentration of glutamate is stable (Befroy et al., 2007, 2008a). The concentrations of the other TCAI are very low and therefore not critical to the accuracy of the model and have been taken from the literature (Hawkins and Mans, 1983). The curve of muscle [4-13C]-glutamate enrichment for a typical healthy individual is shown in Fig. 21.6 with the fit of the CWave metabolic model of these data superimposed, along with the calculated VTCA.
Figure 21.6.
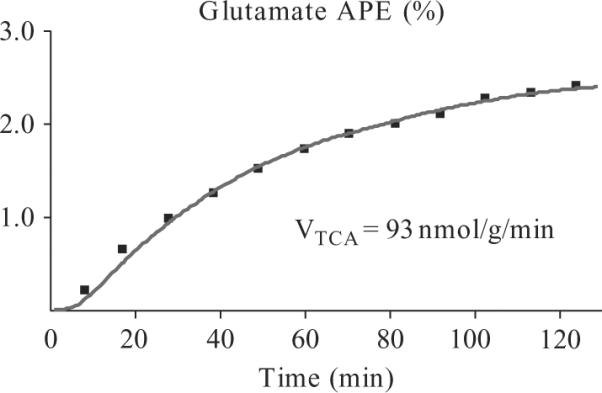
Time course of muscle [4-13C]-glutamate enrichment measured by 13C MRS in a typical healthy individual during a [2-13C]-acetate infusion. The fit of the data using the CWave metabolic model of the TCA cycle is superimposed along with the calculatedTCA cycle flux (VTCA).
2.4.1. Isotopic mass balance equations
2.4.1.1. Mass balance
2.4.1.2. Isotope balance
2.4.1.3. Muscle metabolite concentrations
This relatively simple metabolic model, which incorporates only a single turn of the TCA cycle, and requires only plasma C2-acetate and muscle C4-glutamate enrichment, performs well in resting muscle. The advantage of the single-turn model is that the 13C MRS methods can be optimized to detect [4-13C]-glutamate with the maximum possible sensitivity and time-resolution and therefore obtain the most accurate time course of enrichment. This scheme generates the same rates of VTCA as a more robust 2-turn model that also requires data for muscle C2-glutamate which is enriched during a second turn of the TCA cycle. We have previously used this more complex model to estimate VX which confirmed our assumption that VX > VTCA (Befroy et al., 2007; Lebon et al., 2001). We also investigated the influence of anaplerosis on the calculated rate of TCA cycle flux by using a model that incorporated an anaplerotic flux via pyruvate carboxylase (Vana). The calculated VTCA is unaffected by incremental increases in Vana up to 20% of VTCA (Befroy et al., 2007), which is significantly greater than is likely in resting muscle. We have also found that the absolute fractional enrichment of C2-glutamate at the end of the [2-13C]-acetate infusion is not different between subject groups in our studies, indicating that rates of anaplerosis in quiescent muscle are similar between study populations (Befroy et al., 2007, 2008a). However, this condition may not be preserved for all subject cohorts or in other tissues.
3. Insulin Resistance and Resting Mitochondrial Metabolism
Using the techniques outlined above, we have examined how these parameters of resting mitochondrial metabolism are affected in two different cohorts of insulin-resistant individuals. Both VTCA and VATP were decreased by ~40% in the muscle of insulin-resistant elderly subjects (mean age ~70 years) compared with activity-matched young adults (mean age ~27 years) (Petersen et al., 2003), demonstrating that these older individuals had decreased resting mitochondrial function. Similarly, both parameters were decreased ~30% in insulin-resistant offspring of type 2 diabetic patients compared with insulin-sensitive controls (Befroy et al., 2007; Petersen et al., 2004), consistent with the ~40% reduced mitochondrial density observed in a similar cohort of subjects (Morino et al., 2005). Average curves of muscle [4-13C]-glutamate enrichment for each group are shown in Fig. 21.7, with the fits of the CWave model superimposed, demonstrating the difference in the rates of enrichment and the resultant TCA cycle flux between these cohorts. It is worth noting that these studies were performed in lean, otherwise healthy individuals and the subject groups were matched for body composition, to prevent the confounding factor of obesity, and to try to isolate effects occurring early in the pathogenesis of insulin resistance. Activity levels were also matched, since many of the age-related effects on muscle metabolism can be attributed to the decrease in physical activity that typically occurs in older individuals (Chilibeck et al., 1998; Kent-Braun and Ng, 2000). These spectroscopy techniques are also independent of the mass of tissue from which the MRS signal is detected and are therefore not directly affected by the muscle atrophy that is commonly associated with aging (Frontera et al., 1991).
Figure 21.7.
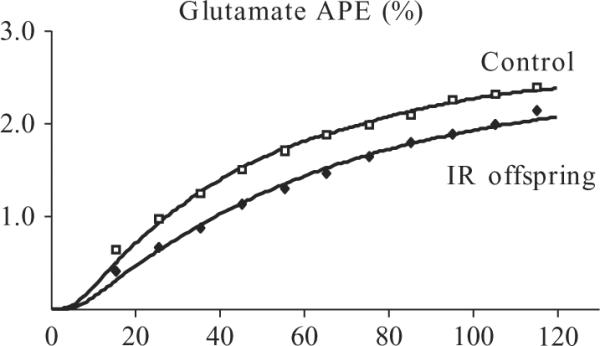
Muscle [4-13C]-glutamate enrichment (averaged data) measured by 13C MRS in a group of healthy, insulin-sensitive control subjects and insulin-resistant (IR) offspring of type 2 diabetic patients. CWave fits of the data are superimposed demonstrating the difference in the rates of enrichment and the resultant TCA cycle flux between the groups. Adapted and reprinted from Befroy et al. (2007); © American Diabetes Association (ADA).
We have also investigated how resting mitochondrial metabolism is modulated in endurance trained muscle, which is characterized by increased mitochondrial number and content of oxidative enzymes. Although VTCA was increased in the muscle of trained individuals, VATP was unaltered (Befroy et al., 2008a) suggesting a decrease in the efficiency of energy production at rest. This elevated “idling” rate of the mitochondria may enable a more rapid response to the increased energy demand at the onset of exercise. We did not observe any significant effect on whole-body energy expenditure demonstrating that whole-body indirect calorimetry techniques are too insensitive to detect significant changes in muscle oxidation rates.
Comparison of the absolute rates of VATP, calculated by the 31P-saturation-transfer technique, and of oxygen consumption, estimated by a number of techniques (including VTCA by 13C MRS), give rise to P:O ratios in resting muscle which are higher than the theoretical maximum (Brindle et al., 1989; Kemp, 2008). This is in contrast to other tissues which have higher respiration rates, for example, kidney (Freeman et al., 1983) and brain (Du et al., 2008; Lei et al., 2003), where good agreement is observed between these parameters. The total Pi → ATP flux from all cellular contributions (oxidative + glycolytic) is evaluated using the saturation-transfer technique; although the glycolytic contribution in resting muscle is low (Jucker et al., 2000); and unpublished data) it has been postulated that in quiescent muscle reversible Pi → ATP exchange via the mitochondrial F1F0 ATPase may contribute to the elevated absolute VATP (Brindle and Radda, 1987; Campbell-Burk et al., 1987). It is worth noting that even if exchange is the dominating contribution, it is likely to be proportional to the F1 ATPase activity. We have successfully miniaturized the saturation-transfer technique to study mouse muscle and have found that the Pi → ATP flux responds as expected to perturbations in the expression of mitochondrial genes in transgenic mice including UCP3 knock-out (Cline et al., 2001) and UCP3 overexpression (Befroy unpublished data) and PGC1α overexpression (Choi et al., 2008) confirming that the rate of ATP synthesis determined by the saturation-transfer technique is an effective biomarker of mitochondrial function.
3.1. Resting mitochondrial metabolism versus maximal capacity
In counterpoint to our in vivo MRS studies investigating resting muscle mitochondrial metabolism, other groups have observed that mitochondrial oxidative capacity, estimated in vivo from PCr kinetics during exercise, was unaffected by aging (Chilibeck et al., 1998; Lanza et al., 2005) when activity patterns were accounted for, and was unchanged throughout the development of insulin-resistance and diabetes in the ZDF rat (De Feyter et al., 2008). Muscle biopsy studies also suggest that mitochondrial capacity is increased in Asian-Indians despite severe insulin resistance (Nair et al., 2008). The disparity between these studies highlights the fact that capacity and resting function are different parameters of mitochondrial metabolism, likely to be regulated or limited by different factors, and that the term mitochondrial “dysfunction,” which has become commonly used in the field and the source of some controversy, is misleading since it has no precise definition and could refer to reduced capacity, function or a combination of both. Furthermore, the findings of these studies will also have been influenced by the precise characteristics of the populations studied and the muscle chosen for analysis. Different muscle groups exhibit distinct metabolic and functional phenotypes (Essen et al., 1975; Pette and Spamer, 1986) and respond differently to aging (Houmard et al., 1998) and potentially disease. Therefore, it is highly likely that there are muscle-group specific differences in mitochondrial function and capacity in healthy subjects and in the modulation of energy production by aging/disease. With this issue in mind, we have recently implemented the saturation-transfer methodology in a localized manner to obtain muscle-group specific rates of Pi → ATP flux (Befroy et al., 2008b).
4. Conclusions
Because of its distinct characteristics, MRS is a unique tool for investigating metabolism across a wide range of systems, encompassing human, animal and cellular models, a wide array of tissues, and in vivo as well as in vitro applications. Multinuclear capabilities further extend these possibilities and since the technique is non-invasive, dynamic processes can be studied using repeated measurements in addition to static estimates of metabolite concentrations. By taking advantage of these unique properties, we have developed techniques that allow us to monitor muscle mitochondrial metabolism in vivo and investigate how it is modulated in health and disease. The implementation of spectroscopy packages on clinical MR scanners will allow these methodologies to reach a wider audience of investigators. With the progression to higher-field MR systems, which increase spectral resolution and sensitivity, and the continued development of enhanced detection techniques, there are a multitude of possibilities for future research.
REFERENCES
- Alger JR, den Hollander JA, Shulman RG. In vivo phosphorus-31 nuclear magnetic resonance saturation transfer studies of adenosinetriphosphatase kinetics in Saccharomyces cerevisiae. Biochemistry. 1982;21:2957–2963. doi: 10.1021/bi00541a024. [DOI] [PubMed] [Google Scholar]
- Befroy DE, Petersen KF, Dufour S, Mason GF, de Graaf RA, Rothman DL, Shulman GI. Impaired mitochondrial substrate oxidation in muscle of insulin-resistant offspring of type 2 diabetic patients. Diabetes. 2007;56:1376–1381. doi: 10.2337/db06-0783. [DOI] [PMC free article] [PubMed] [Google Scholar]
- Befroy DE, Petersen KF, Dufour S, Mason GF, Rothman DL, Shulman GI. Increased substrate oxidation and mitochondrial uncoupling in skeletal muscle of endurance-trained individuals. Proc. Natl. Acad. Sci. USA. 2008a;105:16701–16706. doi: 10.1073/pnas.0808889105. [DOI] [PMC free article] [PubMed] [Google Scholar]
- Befroy DE, Petersen KF, Shulman GI, Rothman DL. Localized 31P saturation transfer reveals differences in gastrocnemius and soleus rates of ATP synthesis in-vivo. Proc. Int. Soc. Mag. Reson. Med. 2008b:2565. [Google Scholar]
- Bloch F. Nuclear induction. Phys. Rev. 1946;70:460. [Google Scholar]
- Boden G, Shulman GI. Free fatty acids in obesity and type 2 diabetes: Defining their role in the development of insulin resistance and beta-cell dysfunction. Eur. J. Clin. Invest. 2002;32(Suppl. 3):14–23. doi: 10.1046/j.1365-2362.32.s3.3.x. [DOI] [PubMed] [Google Scholar]
- Brindle KM, Blackledge MJ, Challiss RA, Radda GK. 31P NMR magnetization-transfer measurements of ATP turnover during steady-state isometric muscle contraction in the rat hind limb in vivo. Biochemistry. 1989;28:4887–4893. doi: 10.1021/bi00437a054. [DOI] [PubMed] [Google Scholar]
- Brindle KM, Radda GK. 31P-NMR saturation transfer measurements of exchange between Pi and ATP in the reactions catalysed by glyceraldehyde-3-phosphate dehydrogenase and phosphoglycerate kinase in vitro. Biochim. Biophys. Acta. 1987;928:45–55. doi: 10.1016/0167-4889(87)90084-x. [DOI] [PubMed] [Google Scholar]
- Brown TR, Ugurbil K, Shulman RG. 31P nuclear magnetic resonance measurements of ATPase kinetics in aerobic Escherichia coli cells. Proc. Natl. Acad. Sci. USA. 1977;74:5551–5553. doi: 10.1073/pnas.74.12.5551. [DOI] [PMC free article] [PubMed] [Google Scholar]
- Burum DP, Ernst RR. Net polarization transfer via a J-ordered state for signal enhancement of low-sensitivity nuclei. J. Magn. Reson. 1980;39:163–168. 1969. [Google Scholar]
- Campbell-Burk SL, Jones KA, Shulman RG. 31P NMR saturation-transfer measurements in Saccharomyces cerevisiae: Characterization of phosphate exchange reactions by iodoacetate and antimycin A inhibition. Biochemistry. 1987;26:7483–7492. doi: 10.1021/bi00397a043. [DOI] [PubMed] [Google Scholar]
- Chilibeck PD, McCreary CR, Marsh GD, Paterson DH, Noble EG, Taylor AW, Thompson RT. Evaluation of muscle oxidative potential by 31P-MRS during incremental exercise in old and young humans. Eur. J. Appl. Physiol. Occup. Physiol. 1998;78:460–465. doi: 10.1007/s004210050446. [DOI] [PubMed] [Google Scholar]
- Choi CS, Befroy DE, Codella R, Kim S, Reznick RM, Hwang Y, Liu Z, Lee H, Distefano A, Samuel VT, Zhang D, Cline GW, et al. Paradoxical effects of increased expression of PGC-1α on muscle mitochondrial function and insulin-stimulated muscle glucose metabolism. Proc. Natl. Acad. Sci. USA. 2008;105:19926–19931. doi: 10.1073/pnas.0810339105. [DOI] [PMC free article] [PubMed] [Google Scholar]
- Cline GW, Vidal-Puig AJ, Dufour S, Cadman KS, Lowell BB, Shulman GI. In vivo effects of uncoupling protein-3 gene disruption on mitochondrial energy metabolism. J. Biol. Chem. 2001;276:20240–20244. doi: 10.1074/jbc.M102540200. [DOI] [PubMed] [Google Scholar]
- Colberg SR, Simoneau JA, Thaete FL, Kelley DE. Skeletal muscle utilization of free fatty acids in women with visceral obesity. J. Clin. Invest. 1995;95:1846–1853. doi: 10.1172/JCI117864. [DOI] [PMC free article] [PubMed] [Google Scholar]
- De Feyter HM, Lenaers E, Houten SM, Schrauwen P, Hesselink MK, Wanders RJ, Nicolay K, Prompers JJ. Increased intramyocellular lipid content but normal skeletal muscle mitochondrial oxidative capacity throughout the pathogenesis of type 2 diabetes. FASEB J. 2008;22:3947–3955. doi: 10.1096/fj.08-112318. [DOI] [PubMed] [Google Scholar]
- de Graaf RA. In vivo NMR Spectroscopy: Principles and Techniques. Wiley, Chichester: 2008. [Google Scholar]
- Dobbins RL, Malloy CR. Measuring in-vivo metabolism using nuclear magnetic resonance. Curr. Opin. Clin. Nutr. Metab. Care. 2003;6:501–509. doi: 10.1097/00075197-200309000-00003. [DOI] [PubMed] [Google Scholar]
- Du F, Zhu XH, Zhang Y, Friedman M, Zhang N, Ugurbil K, Chen W. Tightly coupled brain activity and cerebral ATP metabolic rate. Proc. Natl. Acad. Sci. USA. 2008;105:6409–6414. doi: 10.1073/pnas.0710766105. [DOI] [PMC free article] [PubMed] [Google Scholar]
- Essen B, Jansson E, Henriksson J, Taylor AW, Saltin B. Metabolic characteristics of fibre types in human skeletal muscle. Acta Physiol. Scand. 1975;95:153–165. doi: 10.1111/j.1748-1716.1975.tb10038.x. [DOI] [PubMed] [Google Scholar]
- Forsen S, Hoffman RA. Study of moderately rapid chemical exchange reactions by means of nuclear magnetic double resonance. J. Chem. Phys. 1963;39:2892–2901. [Google Scholar]
- Freeman D, Bartlett S, Radda G, Ross B. Energetics of sodium transport in the kidney. Saturation transfer 31P-NMR. Biochim. Biophys. Acta. 1983;762:325–336. doi: 10.1016/0167-4889(83)90087-3. [DOI] [PubMed] [Google Scholar]
- Frontera WR, Hughes VA, Lutz KJ, Evans WJ. A cross-sectional study of muscle strength and mass in 45- to 78-yr-old men and women. J. Appl. Physiol. 1991;71:644–650. doi: 10.1152/jappl.1991.71.2.644. [DOI] [PubMed] [Google Scholar]
- Haffner SM, Stern MP, Mitchell BD, Hazuda HP, Patterson JK. Incidence of type II diabetes in Mexican Americans predicted by fasting insulin and glucose levels, obesity, and body-fat distribution. Diabetes. 1990;39:283–288. doi: 10.2337/diab.39.3.283. [DOI] [PubMed] [Google Scholar]
- Hawkins RA, Mans AM. Intermediary metabolism of carbohydrates and other fuels. In: Lajtha A, editor. Handbook of Neurochemistry. Vol. 3. Plenum; New York: 1983. pp. 259–294. [Google Scholar]
- He J, Watkins S, Kelley DE. Skeletal muscle lipid content and oxidative enzyme activity in relation to muscle fiber type in type 2 diabetes and obesity. Diabetes. 2001;50:817–823. doi: 10.2337/diabetes.50.4.817. [DOI] [PubMed] [Google Scholar]
- Hoffman RA, Forsén S. High resolution nuclear magnetic double and multiple resonance. Prog. NMR Spectrosc. 1966;1:15–204. [Google Scholar]
- Hoult DI, Busby SJ, Gadian DG, Radda GK, Richards RE, Seeley PJ. Observation of tissue metabolites using 31P nuclear magnetic resonance. Nature. 1974;252:285–287. doi: 10.1038/252285a0. [DOI] [PubMed] [Google Scholar]
- Houmard JA, Weidner ML, Gavigan KE, Tyndall GL, Hickey MS, Alshami A. Fiber type and citrate synthase activity in the human gastrocnemius and vastus lateralis with aging. J. Appl. Physiol. 1998;85:1337–1341. doi: 10.1152/jappl.1998.85.4.1337. [DOI] [PubMed] [Google Scholar]
- Jucker BM, Ren J, Dufour S, Cao X, Previs SF, Cadman KS, Shulman GI. 13C/31P NMR assessment of mitochondrial energy coupling in skeletal muscle of awake fed and fasted rats. Relationship with uncoupling protein 3 expression. J. Biol. Chem. 2000;275:39279–39286. doi: 10.1074/jbc.M007760200. [DOI] [PubMed] [Google Scholar]
- Kelley DE, Goodpaster B, Wing RR, Simoneau JA. Skeletal muscle fatty acid metabolism in association with insulin resistance, obesity, and weight loss. Am. J. Physiol. Endocrinol. Metab. 1999;277:E1130–E1141. doi: 10.1152/ajpendo.1999.277.6.E1130. [DOI] [PubMed] [Google Scholar]
- Kelley DE, He J, Menshikova EV, Ritov VB. Dysfunction of mitochondria in human skeletal muscle in type 2 diabetes. Diabetes. 2002;51:2944–2950. doi: 10.2337/diabetes.51.10.2944. [DOI] [PubMed] [Google Scholar]
- Kemp GJ. The interpretation of abnormal 31P magnetic resonance saturation transfer measurements of Pi/ATP exchange in insulin-resistant skeletal muscle. Am. J. Physiol. Endocrinol. Metab. 2008;294:E640–E642. doi: 10.1152/ajpendo.00797.2007. author reply E643–E644. [DOI] [PubMed] [Google Scholar]
- Kemp GJ, Meyerspeer M, Moser E. Absolute quantification of phosphorus metabolite concentrations in human muscle in vivo by 31P MRS: A quantitative review. NMR Biomed. 2007;20:555–565. doi: 10.1002/nbm.1192. [DOI] [PubMed] [Google Scholar]
- Kent-Braun JA, Ng AV. Skeletal muscle oxidative capacity in young and older women and men. J. Appl. Physiol. 2000;89:1072–1078. doi: 10.1152/jappl.2000.89.3.1072. [DOI] [PubMed] [Google Scholar]
- Kingsley PB, Monahan WG. Corrections for off-resonance effects and incomplete saturation in conventional (two-site) saturation-transfer kinetic measurements. Magn. Reson. Med. 2000a;43:810–819. doi: 10.1002/1522-2594(200006)43:6<810::aid-mrm6>3.0.co;2-j. [DOI] [PubMed] [Google Scholar]
- Kingsley PB, Monahan WG. Effects of off-resonance irradiation, cross-relaxation, and chemical exchange on steady-state magnetization and effective spin-lattice relaxation times. J. Magn. Reson. 2000b;143:360–375. doi: 10.1006/jmre.2000.2018. [DOI] [PubMed] [Google Scholar]
- Krssak M, Falk Petersen K, Dresner A, DiPietro L, Vogel SM, Rothman DL, Roden M, Shulman GI. Intramyocellular lipid concentrations are correlated with insulin sensitivity in humans: A 1H NMR spectroscopy study. Diabetologia. 1999;42:113–116. doi: 10.1007/s001250051123. [DOI] [PubMed] [Google Scholar]
- Lanza IR, Befroy DE, Kent-Braun JA. Age-related changes in ATP-producing pathways in human skeletal muscle in vivo. J. Appl. Physiol. 2005;99:1736–1744. doi: 10.1152/japplphysiol.00566.2005. [DOI] [PubMed] [Google Scholar]
- Lebon V, Dufour S, Petersen KF, Ren J, Jucker BM, Slezak LA, Cline GW, Rothman DL, Shulman GI. Effect of triiodothyronine on mitochondrial energy coupling in human skeletal muscle. J. Clin. Invest. 2001;108:733–737. doi: 10.1172/JCI11775. [DOI] [PMC free article] [PubMed] [Google Scholar]
- Lei H, Ugurbil K, Chen W. Measurement of unidirectional Pi to ATP flux in human visual cortex at 7 T by using in vivo 31P magnetic resonance spectroscopy. Proc. Natl. Acad. Sci. USA. 2003;100:14409–14414. doi: 10.1073/pnas.2332656100. [DOI] [PMC free article] [PubMed] [Google Scholar]
- Lillioja S, Young AA, Culter CL, Ivy JL, Abbott WG, Zawadzki JK, Yki-Jarvinen H, Christin L, Secomb TW, Bogardus C. Skeletal muscle capillary density and fiber type are possible determinants of in vivo insulin resistance in man. J. Clin. Invest. 1987;80:415–424. doi: 10.1172/JCI113088. [DOI] [PMC free article] [PubMed] [Google Scholar]
- MacFall JR, Wehrli FW, Breger RK, Johnson GA. Methodology for the measurement and analysis of relaxation times in proton imaging. Magn. Reson. Imaging. 1987;5:209–220. doi: 10.1016/0730-725x(87)90022-1. [DOI] [PubMed] [Google Scholar]
- Matthews PM, Bland JL, Gadian DG, Radda GK. The steady-state rate of ATP synthesis in the perfused rat heart measured by 31P NMR saturation transfer. Biochem. Biophys. Res. Commun. 1981;103:1052–1059. doi: 10.1016/0006-291x(81)90915-3. [DOI] [PubMed] [Google Scholar]
- McConnell HM. Reaction rates by nuclear magnetic resonance. J. Chem. Phys. 1958;28:430–431. [Google Scholar]
- Mootha VK, Lindgren CM, Eriksson KF, Subramanian A, Sihag S, Lehar J, Puigserver P, Carlsson E, Ridderstrale M, Laurila E, Houstis N, Daly MJ, et al. PGC-1alpha-responsive genes involved in oxidative phosphorylation are coordinately downregulated in human diabetes. Nat. Genet. 2003;34:267–273. doi: 10.1038/ng1180. [DOI] [PubMed] [Google Scholar]
- Morino K, Petersen KF, Dufour S, Befroy D, Frattini J, Shatzkes N, Neschen S, White MF, Bilz S, Sono S, Pypaert M, Shulman GI. Reduced mitochondrial density and increased IRS-1 serine phosphorylation in muscle of insulin-resistant offspring of type 2 diabetic parents. J. Clin. Invest. 2005;115:3587–3593. doi: 10.1172/JCI25151. [DOI] [PMC free article] [PubMed] [Google Scholar]
- Morino K, Petersen KF, Shulman GI. Molecular mechanisms of insulin resistance in humans and their potential links with mitochondrial dysfunction. Diabetes. 2006;55(Suppl. 2):S9–S15. doi: 10.2337/db06-S002. [DOI] [PMC free article] [PubMed] [Google Scholar]
- Nair KS, Bigelow ML, Asmann YW, Chow LS, Coenen-Schimke JM, Klaus KA, Guo ZK, Sreekumar R, Irving BA. Asian Indians have enhanced skeletal muscle mitochondrial capacity to produce ATP in association with severe insulin resistance. Diabetes. 2008;57:1166–1175. doi: 10.2337/db07-1556. [DOI] [PMC free article] [PubMed] [Google Scholar]
- Pan DA, Lillioja S, Kriketos AD, Milner MR, Baur LA, Bogardus C, Jenkins AB, Storlien LH. Skeletal muscle triglyceride levels are inversely related to insulin action. Diabetes. 1997;46:983–988. doi: 10.2337/diab.46.6.983. [DOI] [PubMed] [Google Scholar]
- Patti ME, Butte AJ, Crunkhorn S, Cusi K, Berria R, Kashyap S, Miyazaki Y, Kohane I, Costello M, Saccone R, Landaker EJ, Goldfine AB, et al. Coordinated reduction of genes of oxidative metabolism in humans with insulin resistance and diabetes: Potential role of PGC1 and NRF1. Proc. Natl. Acad. Sci. USA. 2003;100:8466–8471. doi: 10.1073/pnas.1032913100. [DOI] [PMC free article] [PubMed] [Google Scholar]
- Perseghin G, Ghosh S, Gerow K, Shulman GI. Metabolic defects in lean nondiabetic offspring of NIDDM parents: A cross-sectional study. Diabetes. 1997;46:1001–1009. doi: 10.2337/diab.46.6.1001. [DOI] [PubMed] [Google Scholar]
- Perseghin G, Scifo P, De Cobelli F, Pagliato E, Battezzati A, Arcelloni C, Vanzulli A, Testolin G, Pozza G, Del Maschio A, Luzi L. Intramyo-cellular triglyceride content is a determinant of in vivo insulin resistance in humans: A 1H-13C nuclear magnetic resonance spectroscopy assessment in offspring of type 2 diabetic parents. Diabetes. 1999;48:1600–1606. doi: 10.2337/diabetes.48.8.1600. [DOI] [PubMed] [Google Scholar]
- Petersen KF, Befroy D, Dufour S, Dziura J, Ariyan C, Rothman DL, DiPietro L, Cline GW, Shulman GI. Mitochondrial dysfunction in the elderly: Possible role in insulin resistance. Science. 2003;300:1140–1142. doi: 10.1126/science.1082889. [DOI] [PMC free article] [PubMed] [Google Scholar]
- Petersen KF, Dufour S, Befroy D, Garcia R, Shulman GI. Impaired mitochondrial activity in the insulin-resistant offspring of patients with type 2 diabetes. N. Engl. J. Med. 2004;350:664–671. doi: 10.1056/NEJMoa031314. [DOI] [PMC free article] [PubMed] [Google Scholar]
- Petersen KF, Dufour S, Befroy D, Lehrke M, Hendler RE, Shulman GI. Reversal of nonalcoholic hepatic steatosis, hepatic insulin resistance, and hyper-glycemia by moderate weight reduction in patients with type 2 diabetes. Diabetes. 2005;54:603–608. doi: 10.2337/diabetes.54.3.603. [DOI] [PMC free article] [PubMed] [Google Scholar]
- Petersen KF, Oral EA, Dufour S, Befroy D, Ariyan C, Yu C, Cline GW, DePaoli AM, Taylor SI, Gorden P, Shulman GI. Leptin reverses insulin resistance and hepatic steatosis in patients with severe lipodystrophy. J. Clin. Invest. 2002;109:1345–1350. doi: 10.1172/JCI15001. [DOI] [PMC free article] [PubMed] [Google Scholar]
- Pette D, Spamer C. Metabolic properties of muscle fibers. Fed. Proc. 1986;45:2910–2914. [PubMed] [Google Scholar]
- Prompers JJ, Jeneson JA, Drost MR, Oomens CC, Strijkers GJ, Nicolay K. Dynamic MRS and MRI of skeletal muscle function and biomechanics. NMR Biomed. 2006;19:927–953. doi: 10.1002/nbm.1095. [DOI] [PubMed] [Google Scholar]
- Ritov VB, Menshikova EV, He J, Ferrell RE, Goodpaster BH, Kelley DE. Deficiency of subsarcolemmal mitochondria in obesity and type 2 diabetes. Diabetes. 2005;54:8–14. doi: 10.2337/diabetes.54.1.8. [DOI] [PubMed] [Google Scholar]
- Savage DB, Petersen KF, Shulman GI. Disordered lipid metabolism and the pathogenesis of insulin resistance. Physiol. Rev. 2007;87:507–520. doi: 10.1152/physrev.00024.2006. [DOI] [PMC free article] [PubMed] [Google Scholar]
- Seppala-Lindroos A, Vehkavaara S, Hakkinen AM, Goto T, Westerbacka J, Sovijarvi A, Halavaara J, Yki-Jarvinen H. Fat accumulation in the liver is associated with defects in insulin suppression of glucose production and serum free fatty acids independent of obesity in normal men. J. Clin. Endocrinol. Metab. 2002;87:3023–3028. doi: 10.1210/jcem.87.7.8638. [DOI] [PubMed] [Google Scholar]
- Shen J, Petersen KF, Behar KL, Brown P, Nixon TW, Mason GF, Petroff OA, Shulman GI, Shulman RG, Rothman DL. Determination of the rate of the glutamate/glutamine cycle in the human brain by in vivo 13C NMR. Proc. Natl. Acad. Sci. USA. 1999;96:8235–8240. doi: 10.1073/pnas.96.14.8235. [DOI] [PMC free article] [PubMed] [Google Scholar]
- Shulman GI. Cellular mechanisms of insulin resistance. J. Clin. Invest. 2000;106:171–176. doi: 10.1172/JCI10583. [DOI] [PMC free article] [PubMed] [Google Scholar]
- Shulman RG, Rothman DL, Price TB. Nuclear magnetic resonance studies of muscle and applications to exercise and diabetes. Diabetes. 1996;45(Suppl. 1):S93–S98. doi: 10.2337/diab.45.1.s93. [DOI] [PubMed] [Google Scholar]
- Simoneau JA, Kelley DE. Altered glycolytic and oxidative capacities of skeletal muscle contribute to insulin resistance in NIDDM. J. Appl. Physiol. 1997;83:166–171. doi: 10.1152/jappl.1997.83.1.166. [DOI] [PubMed] [Google Scholar]
- Simoneau JA, Veerkamp JH, Turcotte LP, Kelley DE. Markers of capacity to utilize fatty acids in human skeletal muscle: Relation to insulin resistance and obesity and effects of weight loss. FASEB J. 1999;13:2051–2060. doi: 10.1096/fasebj.13.14.2051. [DOI] [PubMed] [Google Scholar]
- Szczepaniak LS, Babcock EE, Schick F, Dobbins RL, Garg A, Burns DK, McGarry JD, Stein DT. Measurement of intracellular triglyceride stores by H spectroscopy: Validation in vivo. Am. J. Physiol. Endocrinol. Metab. 1999;276:E977–E989. doi: 10.1152/ajpendo.1999.276.5.E977. [DOI] [PubMed] [Google Scholar]
- Warram JH, Martin BC, Krolewski AS, Soeldner JS, Kahn CR. Slow glucose removal rate and hyperinsulinemia precede the development of type II diabetes in the offspring of diabetic parents. Ann. Intern. Med. 1990;113:909–915. doi: 10.7326/0003-4819-113-12-909. [DOI] [PubMed] [Google Scholar]
- Wild S, Roglic G, Green A, Sicree R, King H. Global prevalence of diabetes: Estimates for the year 2000 and projections for 2030. Diabetes Care. 2004;27:1047–1053. doi: 10.2337/diacare.27.5.1047. [DOI] [PubMed] [Google Scholar]