Abstract
Treatment of aqueous zinc solutions with incremental additions of a ditopic fluorescent sensor of the Zinpyr family, based on pyridine/pyrazine-containing metal recognition units, affords a fluorescence titration curve with a sharp maximum at a sensor:Zn2+ ratio of 0.5 (Zhang, X-a.; Hayes, D.; Smith, S. J.; Friedle, S.; Lippard, S. J. J. Am. Chem Soc. 2008, 130, 15788–15789). This fluorescence response enables the quantification of readily chelatable zinc in biological samples by a simple titration protocol. In the present work a new set of ditopic fluorescence zinc sensors functionalized with pyridine/pyrazine-containing metal chelating units is described, and through detailed studies the principles governing the characteristic “OFF-ON-OFF” fluorescence behavior and quantification capabilities of the family are delineated. Incorporation of carboxylate/ester groups in the 6 position of the fluorescein allows for control of the spatial distribution of the sensor for selective extra- or intracellular imaging of mobile zinc, without introducing significant changes in zinc-binding properties. A combination of spectrophotometric and potentiometric measurements provided a complete description of the H+ and Zn2+ binding properties of the compounds and their correlation with the observed fluorescence profile. The first zinc-binding event has an apparent affinity, K1′, of 1.9–3.1×10⁹ M−1, whereas for coordination of the second Zn2+ ion, responsible for fluorescence turn on, the apparent formation constant K2′ is 5.5–6.9×10⁷ M−1. A detailed chemical and mathematical analysis of the system demonstrated that the difference in emission efficiencies of the dimetalated (LZn2) vs. monometalated (LZn) and metal free (L) forms, a consequence of the combined quenching effects of the two metal-chelating units, significantly influences the shape of the titration curve. The scope of the titration method was investigated mathematically, and a lower boundary for the range of concentrations that can be determined was established as a function of the magnitude of K2′. Our results suggest that the principles governing the response of the ZPP1 series are applicable to other analogues of the Zinpyr family. Moreover, they may guide the design of other ditopic sensors suitable for determining the concentrations of a wide range of mobile metal ions and other chemical signaling agents of relevance in biological systems.
Keywords: Zinc quantification, mobile zinc, fluorescent sensor, titration, cell permeability
INTRODUCTION
Zinc is an essential element involved in both physiological and pathological processes in living organisms. Zn2+ ions serve as key structural components of a large number of proteins and also perform catalytic roles in enzymes central to many cellular processes.1 In addition to these tightly bound forms of zinc, deposits of “mobile” or “readily exchangeable” zinc weakly bound to small molecules have been identified in multiple locations including brain,2 prostate,3 intestine,4 and pancreas.5 The specific role of such mobile Zn2+ pools in cells, and its relevance to physiological processes and/or disease, are very active topics of research that are still incompletely understood. The availability of better imaging techniques that facilitate the study of Zn2+ in biological samples has the potential to solve many unanswered questions about zinc biology.6 In particular, the development of improved methods to quantify mobile zinc is of great importance for the investigation of the interconnection between regulation of zinc levels and the occurrence of disease states.
Fluorescence-based detection methods developed in the last two decades have proved to be particularly useful for imaging mobile Zn2+, providing both spatial and temporal information regarding trafficking and accumulation of this ion that is not accessible with other histochemical staining methods such as autometallography.6–9 The application of fluorescent probes to quantify metal ions in biological samples is well established in the field of calcium sensing.10–12 In recent years, much effort has been devoted to extend this capability to quantitate levels of mobile zinc. Methods based on the complexation of Zn2+ by fluorescent sensors offer the potential to establish zinc concentrations with high sensitivity and selectivity for readily chelatable mobile zinc versus tightly bound forms of the ion commonly encountered in biological specimens. A fundamental understanding of the Zn2+ -binding properties of such probes in aqueous solution is essential for quantitative applications in zinc biology and may inform the design of quantitative probes for other biological analytes.
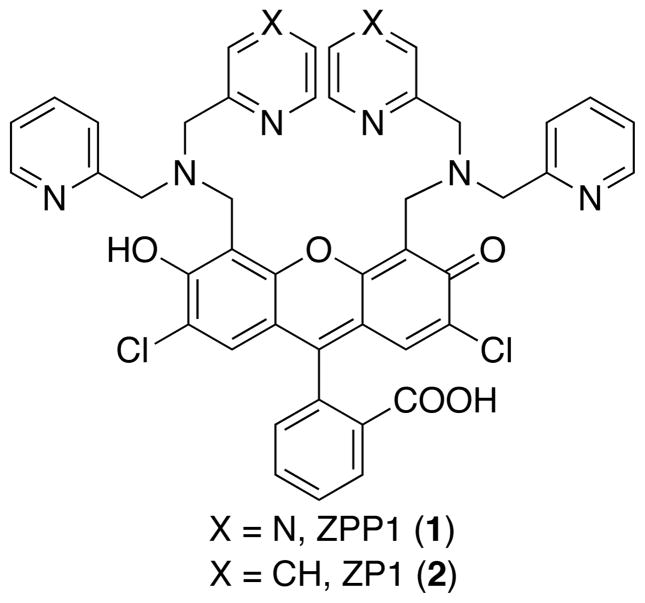
As part of an ongoing effort to develop new tools for the study of mobile zinc, we devised a series of fluorescent sensors that allow for rapid and selective detection of Zn2+ ions in a variety of settings, covering a range of binding affinities and dynamic ranges.13–17 Our probes have most often included a di(2-picolyl)amine (DPA) moiety as the zinc-binding unit18,19 because of its selectivity for Zn2+ over alkali and alkaline-earth metal ions abundant in cellular milieu. Attachment of DPA and DPA-derived chelating moieties to the xanthenone system of a fluorescein platform resulted in the family of mono- and ditopic Zinpyr (alternatively ZP) fluorescent Zn2+ probes,13,20,21 where mono- and ditopic refer respectively to the presence of one or two zinc-binding units attached to the xanthenone. More recently, we reported the synthesis of a related sensor incorporating a pyrazine arm in place of one of the pyridine groups of a Zinpyr-type scaffold.15 The new probe, ZPP1 (Figure 1), exhibits reduced background emission and improved turn-on in comparison to the ZP120,21 analogue. Of greatest interest, however, was the discovery that addition of ZPP1 to a pool of mobile Zn2+ generated a distinctive two-step OFF–ON–OFF fluorescence response, with a sharp “ON” maximum in fluorescence intensity when the probe-to-metal ratio reaches 1:2. This behavior provides a simple protocol for quantifying Zn2+ concentrations in solution. The method has been applied to quantitate zinc released from Min6 pancreatic β-cells upon stimulation with KCl and glucose15 and to monitor changes in mobile zinc from prostate during progression of disease in a transgenic model for prostate cancer in mouse (TRAMP mouse).22
Figure 1.
Zinpyr fluorescent sensors ZP1 and ZPP1.
The studies presented here were aimed at (i) providing a better understanding of the underlying principles involved in the quantification capabilities of this type of ditopic sensor and (ii) developing a series of derivatives that would offer better control of the spatial distribution of the sensor in the sample, specifically, intra- vs. extracellular localization, while retaining the zinc-binding properties of the ZPP1 design. A combination of spectrophotometric and potentiometric titrations were employed to elucidate the proton and zinc binding properties of ZPP1, and two cell-permeable and impermeable derivatives incorporating carboxylate/ester moieties were synthesized. Through the use of graphical and analytical methods, we investigated the scope of the proposed zinc quantification method based on fluorescence titration, focusing on establishing the effect of the binding affinities, turn-on ratio, and analyte concentration on the shape of the titration curve. From these principles, we provide a series of guidelines to inform the design of new sensors suitable for similar quantification procedures.
EXPERIMENTAL SECTION
General Materials and Methods
All synthetic procedures were performed under a nitrogen atmosphere unless otherwise specified. ZPP1 and (2-picolyl)(pyrazin-2-yl-methyl)amine were prepared according to literature procedures.15 3′,6′-Diacetyl-2′,7′-dichloro-6-carboxyfluorescein was obtained by dissolving the pyridinium salt23 in acetic anhydride and precipitating the free acid by slow addition of water; the solid obtained was used without further purification. All other reagents were purchased from commercial sources and used as received. Solvents were purified and degassed by standard procedures. NMR spectra were acquired on Bruker Avance 400 spectrometers. 1H NMR chemical shifts are reported in ppm relative to SiMe4 (δ = 0) and were referenced internally with respect to residual protons in the solvent (δ 7.24 for CHCl3, 2.50 for DMSO-d5).24 13C NMR chemical shifts are reported in ppm relative to SiMe4 (δ = 0) and were referenced internally with respect to the solvent signal (δ 77.16 for CDCl3, 39.52 for DMSO-d6).24 Coupling constants are reported in Hz. Infrared spectra were acquired on an Avatar 360 FTIR instrument. Melting points were collected on an Electrothermal Mel-Temp melting point apparatus and are reported uncorrected. High-resolution mass spectrometry (HRMS) was conducted by staff at the MIT Department of Chemistry Instrumentation Facility on a Bruker Daltonics APEXIV 4.7 Tesla FT-ICR-MS.
Synthesis of 3′,6′-Diacetyl-2′,7′-dichlorofluorescein-6-carboxylate Ethyl Ester, 6
3′,6′-Diacetyl-2′,7′-dichloro-6-carboxyfluorescein (250 mg, 0.472 mmol) was mixed with triethylorthoformate (7.5 mL) and the solution was refluxed for 3 h. After this period the volatiles were removed by distillation and the residue was taken up into dichloromethane. The solution was passed through a short plug of silica gel, eluting with additional dichloromethane, and dried under vacuum to afford 3′,6′-diacetyl-2′,7′-dichlorofluorescein-6-carboxylate ethyl ester as a white solid (229 mg, 87% yield). Characterization of the product obtained by this method matches that of 3′,6′-diacetyl-2′,7′-dichlorofluorescein-6-carboxylate ethyl ester reported previously.23
Synthesis of ZPP1(6-CO2H), 3
A mixture of (2-picolyl)(pyrazin-2-yl-methyl)amine (76 mg, 0.38 mmol) and paraformaldehyde (17 mg, 0.57 mmol) in acetonitrile (6 mL) was refluxed for 1 h. A suspension of 3′,6′-diacetyl-2′,7′-dichloro-6-carboxyfluorescein (50 mg, 0.094 mmol) in acetonitrile (6 mL) was added to the reaction mixture and reflux was continued for 20 h. After this period, the crystalline product was collected by filtration and washed with acetonitrile (3 mL) followed by water (3 mL), acetonitrile (3 mL), and diethyl ether (3×3 mL), and dried under vacuum to afford ZPP1(6-CO2H) as a pink solid (40 mg, 49% yield). The crude product can be recrystallized from ethanol. 1H NMR (400 MHz, DMSO-d6, room temperature): δ 8.56 (m, 4H), 8.54 (m, 2H), 8.44 (m, 2H), 8.23 (d, 3JHH= 8, 1H), 8.10 (d, 3JHH= 8, 1H), 7.84 (m, 2H), 7.81 (s, 1H), 7.44 (d, 3JHH= 8, 2H), 7.35 (m, 2H), 6.63 (s, 2H), 4.18 (s, 4H), 4.09 (s, 4H), 4.06 (s, 4H). 13C{1H} NMR (100 MHz, DMSO-d6): 156.8, 153.4, 148.6, 147.9, 144.9, 143.8, 137.4, 129.6, 129.5, 126.9, 126.8, 126.0, 123.50, 123.45, 122.8, 121.7, 111.7, 109.4, 58.6, 58.9, 49.0; carbonyl and some of the quaternary carbons were not detected. Selected IR data (KBr disc, cm−1): 1759, 1714 (CO). (ESI, m/z): calcd. for [M-H]− 867.1849, found 867.1866. Mp = 210 °C (dec).
Synthesis of ZPP1(6-CO2Et), 4
A mixture of (2-picolyl)(pyrazin-2-yl-methyl)amine (162 mg, 0.809 mmol) and paraformaldehyde (32 mg, 1.1 mmol) in acetonitrile (6 mL) was refluxed for 1 h. A solution of 3′,6′-diacetyl-2′,7′-dichloro-6-carboxyfluorescein ethyl ester (150 mg, 0.269 mmol) in acetonitrile (6 mL) was added to the reaction and reflux was continued for an additional 48 h. After this period, the reaction mixture was concentrated to ca. half of the original volume and reflux was continued for another 12 h. The crystalline product was collected by filtration and washed with acetonitrile:water (5 mL 1:1 mixture) followed by acetonitrile (5 mL), and diethyl ether (5 mL), and dried in vacuo to afford ZPP1(6-CO2Et) as a pink solid (120 mg, 49% yield). 1H NMR (400 MHz, CDCl3, room temperature): δ 8.66 (m, 4H), 8.52 (m, 2H), 8.45 (m, 2H), 8.34 (d, 3JHH= 8, 1H), 8.10 (d, 3JHH= 8, 1H), 7.84 (s, 1H), 7.71 (dt, 3JHH= 8, 4JHH= 2, 2H), 7.30 (d, 3JHH= 8, 2H) 7.25 (overlapping m), 6.60 (s, 2H), 4.36 (q, 3JHH= 7, 2H, -OCH2CH3), 4.23 (m, 4H), 4.07 (m, 4H), 4.04 (m, 4H), 1.35 (t, 3JHH= 7, 3H, -OCH2CH3); 13C{1H} NMR (100 MHz, CDCl3): 168.0, 165.1, 156.7, 156.1, 156.4, 151.8, 149.0, 148.6, 145.4, 143.8, 143.7, 137.5, 137.0, 131.5, 130.5, 128.0, 125.6, 126.4, 123.4, 122.9, 118.0, 111.3, 109.5, 83.5, 62.1, 58.9, 57.6, 49.6, 14.3. Selected IR data (KBr disc, cm−1): 1759, 1725 (CO). HRMS (ESI, m/z): calcd. for [M-H]− 895.2162, found 895.2159. Mp = 207.5–209.0 °C (dec).
Potentiometric Titrations
Potentiometric titrations were performed with a Mettler Toledo T70 automated titrator equipped with a DG-111-SG glass electrode calibrated against standard buffers. The water-jacketed titration vessel was maintained at 25.0 ± 0.5 °C by circulating temperature-regulated water. For each titration, a sample of the sensor or (2-picolyl)(pyrazin-2-yl-methyl)amine was predissolved in a known excess of HCl and diluted with water in the titration vessel (50 mL). The final concentration of sensor was ca. 0.5 mM and of the amine, 1.0 mM. All measurements were conducted in the presence of 100 mM KCl to maintain constant ionic strength. Solutions were titrated with 0.0700 M NaOH, which was prepared with degassed water and standardized with potassium hydrogen phthalate before each series of titrations. Data analysis was performed with the HYPERQUAD2006 version 3.1.48 computer program,25 using a logKW value of 13.78.26 Zn2+ binding constants were determined from titrations performed in the presence of 1 to 2 equiv of ZnCl2, using the previously determined pKa values. Because of poor solubility of the sensor at high pH in the presence of zinc, only datapoints collected below pH 8.5 were included in the refinement of binding constants. All reported constants represent averages of the results obtained from a minimum of three independent runs. Speciation plots and titration simulations were built with HySS2009.27
Spectroscopic Methods
All aqueous solutions were prepared using de-ionized water having a resistivity of ≥ 18 MΩ/cm. Other solvents were supplied by Aldrich and used as received. Piperazine-N,N′-bis(2-ethanesulfonic acid) (PIPES) and 99.999% KCl were purchased from Calbiochem. High purity 25% HCl, 45% KOH, and 50% NaOH, and 99.999% ZnCl2 were purchased from Aldrich. Stock solutions of the sensors in DMSO were prepared in the 0.5–1.0 mM range, stored at −20 °C in 100–200 μL aliquots, and thawed immediately before each experiment. Measurements at pH 7.0 were conducted in aqueous buffer containing 50 mM PIPES and 100 mM KCl. Buffers were treated with Chelex resin (Bio-Rad) according to the manufacturer’s protocol, unless otherwise noted. pH measurements were made using an Orion 720A pH meter with glass electrode. UV-visible spectra were acquired on a Cary 1E spectrophotometer using quartz cuvettes from Starna (1 cm path length). Fluorescence spectra were acquired on a QuantaMaster 4 Photon Technology International fluorimeter. All measurements were conducted at 25.0 ± 0.5 °C kept by circulating water baths. Extinction coefficients were determined in the 0.1–1.0 μM range in aqueous buffer at pH 7.0, in the presence of 2 μM EDTA for the metal-free form, or of 10 μM ZnCl2 for the metal-bound form of the sensor. Fluorescence quantum yields were determined using 0.2–1.0 μM solutions of the sensor in aqueous buffer at pH 7.0, exciting at the corresponding excitation maximum of the compound. Solutions of fluorescein in 0.1 N NaOH, with a reported quantum yield of 0.95, were used as standards. Fluorescence emission spectra were integrated from 480 to 700 nm.
Study of pH-Dependent Fluorescence
The pH dependence of the fluorescence emission of the sensors was determined using 1.0 μM solutions of the compound in 100 mM KCl, 1 mM EDTA, adjusted to pH 11 with 45% KOH, then gradually lowered by addition of small aliquots of 6, 2, 1, 0.1, and 0.01 M HCl, ensuring less than 2% change in total volume. A non-linear curve fit according to eq 1 was applied to compute apparent pKa values associated with the increase in fluorescence emission going from high to low pH. IL, IHL, and IH2L are proportionality constants related to fluorescence emission of the fully deprotonated sensor (L), the singly protonated species (HL), and the doubly protonated species (H2L), respectively. The emission intensity was integrated from 480 to 700 nm.
| (1) |
Metal-Ion Selectivity
Cation selectivity was determined by recording the fluorescence emission spectrum of a 1.0 μM solution of the sensor in aqueous buffer at pH 7.0, both before and after treatment with NaCl, CaCl2, MgCl2, MnCl2, FeSO4 (freshly prepared), CoCl2, NiCl2, CuCl2, CdCl2, or HgCl2 stock solution in water, for a final cation concentration of 50 μM. Fluorescence was then recorded after subsequent addition of ZnCl2 at a total concentration of 50 or 500 μM. In each case, the integrated fluorescence emission (480 to 700 mn) was normalized with respect to that of the metal-free control spectrum, arbitrarily assigned as unity.
Determination of Apparent Zinc Binding Constants
In a typical experiment, a 1–2.5 μM solution of the sensor in aqueous buffer at pH 7.0 was treated with increasing amounts of a ZnCl2 solution, and the fluorescence emission spectrum was recorded at each incremental step. Spectra were integrated from 480 to 700 nm. The plot of the integrated fluorescence vs. concentration of added Zn2+, corrected for dilution during the experiment, was analyzed with a non-linear regression using OriginPro 8.0.
Simulation of Zinc Quantification by Titration with Fluorescent Sensor
In a typical experiment, 3 mL of a 1–10 μM solution of ZnCl2 in aqueous buffer at pH 7.0 was treated with increasing amounts of a DMSO stock solution of the sensor of known concentration, 0.1–1.0 mM, and the fluorescence emission spectrum was recorded at each incremental step. Spectra were integrated from 480 to 700 nm. A blank sample without zinc was run in parallel for each titration.
Fluorescence Microscopy
Fluorescence imaging experiments were performed with a Zeiss Axiovert 200M inverted epifluorescence microscope equipped with a Hamamatsu EM-CCD digital camera C9100 and a MS200 XY Piezo Z stage (Applied Scientific Instruments, Inc.). An X-Cite 120 metal-halide lamp (EXFO) was used as the light source. Zeiss standard filter sets 49, 38 HE, and 43 HE were employed for imaging of Hoechst 33258, zinc sensors, and BODIPY TR ceramide/Mitotracker Red, respectively. The microscope was operated with Volocity software (Improvision). The exposure time for acquisition of fluorescence images was kept constant for each series of images. For comparison, images before and after addition of zinc are shown on the same intensity scale. Images corresponding to co-localization studies were deconvoluted using Volocity restoration algorithms. Z-sectioned images at 1 μm intervals were employed to discern possible effects of organelle overlap along the z-axis.
Cell Cultures and Staining Procedures
HeLa cells were incubated in Dulbecco’s Modified Eagle Medium (DMEM, GIBCO), supplemented with 10% heat deactivated fetal bovine serum (FBS) and 1% penicillin-streptomycin at 37 °C in a humidified atmosphere with 5% CO2. Cells were plated in 35 mm glass bottom culture dishes with 14 mm opening (MatTek) 48 h before imaging. A confluence level of 50–70% had been reached at the time of study. Cells were incubated with the sensor at 37 °C for a period of 3 to 12 h before imaging. For the application of the sensor, the growth medium was replaced with fresh medium treated with an aliquot of the sensor (from a 1 mM stock solution in DMSO) in order to provide the desired concentration in the plate (10 μM). The organelle-specific dyes Hoechst 33258 (Aldrich, final concentration 4 μM), Mitotracker Red (Invitrogen, final concentration 0.2 μM), and BODIPY-TR ceramide (Invitrogen, 4 μM, for labeling of Golgi apparatus) were applied during the last stage of incubation, 30 min before imaging. At the time of imaging, cells were rinsed with PBS buffer (2×2 mL), then washed with dye-free DMEM without serum (2 mL), and finally bathed in dye-free DMEM without serum (2 mL). For investigation of zinc-induced turn-on fluorescence response, cells were treated with aliquots of an equimolar mixture of ZnCl2 and sodium pyrithione (2-pyridinethiol-1-oxide) in DMSO, applied to the culture dish on the microscope stage to 50 μM final concentration. Reversibility of the zinc-induced response was confirmed by applying aliquots of a 100 mM N,N,N′,N′-tetrakis(2-pyridyl-methyl) ethylenediamine (TPEN) to the culture dish directly on the microscope stage.
RESULTS AND DISCUSSION
Synthesis of the Sensors
With the aim of controlling the spatial distribution of ZPP1, we incorporated carboxylate/ester groups that would modulate the overall charge of the sensor and influence its ability to cross the cell membrane. The additional negative charge introduced by a carboxylate moiety is expected to confine the sensor to the intra- or extracellular space.28,29 Moreover, the carboxylate can be easily capped to form an ester, thus rendering the molecule membrane-permeable and potentially cell-trappable, due to the action of intracellular esterases capable of cleaving the ester moiety and uncovering the masked negative charge.30,31 The phenyl ring of the fluorescein was chosen as a suitable location for such carboxylate/ester groups, providing the possibility of functionalization of various types with minimal effect on the metal binding sites. Substitution at the 5 and 6 position has been employed previously in our group for the synthesis of membrane permeable and impermeable derivatives of other Zinpyr sensors, specifically, ZP1(6-CO2H), ZP1(6-CO2Et), and their 5-functionalized isomers.23
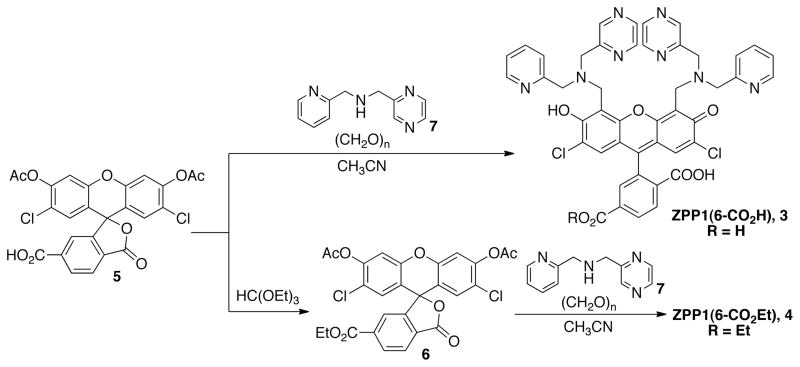
Synthetic routes to sensors functionalized at the 6 position of the fluorescein are depicted in Scheme 1. The 3′,6′-diacetyl-2′,7′-dichloro-6-carboxyfluorescein precursor (single isomer) is readily obtained as its pyridinium salt by literature procedures.23 The acetylation step locks the fluorescein in its lactone form, thus protecting the carboxylate in the 3-position from undergoing esterification in subsequent steps. Derivatization of the 6-carboxylate as its ethyl ester is accomplished by treatement with triethylorthoformate, a procedure that proved to be faster and more efficient than methods reported previously by our group23 and others.28 Both the pyridinium salt and free acid form of the 6-carboxyfluorescein diacetate are suitable starting materials for the synthesis of the ester derivative 6.
Scheme 1.
Synthesis of ZPP1(6-CO2R) Derivatives.
With the appropriate precursors in hand, installation of the metal binding groups was accomplished via Mannich-type reactions, affording new derivatives ZPP1(6-CO2R) (R = H, Et). This synthetic strategy is compatible with other ester functionalities that can be installed at the 6 position to further tune the lipophilicity of the sensor and its membrane permeability/trappability properties.
Spectroscopic Properties
The photophysical properties of the new probes were investigated in aqueous buffer at pH 7, and the characteristic spectroscopic constants are summarized in Table 1. Both 6-functionalized derivatives display absorption properties similar to those of the parent ZPP1 (λabs=517 nm), with maxima at 519 and 522 nm for the free acid and the ethyl ester, respectively. The absorption maxima undergo a gradual hypsochromic shift upon treatment with increasing amounts of ZnCl2 solution, reaching a maximum change of −14 nm for both probes. This shift is consistent with participation of the phenolic oxygen atom, part of the xanthenone conjugated π system, in metal coordination. In their zinc-free form, both sensors are largely quenched due to photoinduced electron transfer (PET)32 from the amine moieties,33,34 thus exhibiting quantum yields below 0.05. Saturation with Zn2+, which occurs in each case upon addition of two equivalents of the metal ion (vide infra), induces a 14- or 19-fold increase in the quantum yield of ZPP1(6-CO2H) or its ethyl ester derivative, respectively. The increase in fluorescence emission is a result of the inhibition of the PET mechanism due to coordination of the nitrogen electron donors to the zinc ions. As observed for the parent ZPP115 by comparison to ZP133, the ZPP1(6-CO2R) derivatives have higher turn-on ratios than their ZP1(6-CO2R)23 analogues, mainly as a consequence of lower quantum yields of the metal-free forms. Changes in the absorption and emission spectra observed upon metal coordination can be easily reversed by treatment with chelators such as EDTA or TPEN that compete with the sensor for zinc binding (Figures S1 and S2, SI).
Table 1.
Spectroscopic Properties of Ditopic ZPP1 Derivatives
| Absorption maximuma λ (nm), ε×103 (M−1cm−1) |
Excitation maximuma λ (nm) |
Emission maximuma λ (nm), Φb |
Fluorescence pKac | ||||
|---|---|---|---|---|---|---|---|
| unbound | Zn(II)-saturated | unbound | Zn(II)-saturated | unbound | Zn(II)-saturated | ||
| ZPP1 | 517, 75(5) | 505, 82(2) | 505 | 505 | 532, 0.052d | 523, 0.70d | 6.24(1)e |
| ZPP1(6-CO2H) | 519, 77(3) | 505, 84(3) | 507 | 505 | 534, 0.0452(5) | 525, 0.67(2) | 6.21(1) |
| ZPP1(6-CO2Et) | 522, 74(2) | 508, 81(2) | 515 | 508 | 535, 0.031(5) | 528, 0.60(2) | 6.04(1) |
Measurements performed in aqueous buffer at pH 7.0, 50 mM PIPES, 100 mM KCl.
Fluorescein (Φ=0.95 in 0.1 M NaOH)35 was used as standard for quantum yield determinations.
pKa associated with the fluorescence increase going from high to low pH.
From reference 15.
Value as determined in the present work. Numbers in parentheses represent standard deviations in the last significant digit.
pH-Dependent Response
The diverse nature of the biological environments where mobile zinc may be localized demands the development of sensors that display a fluorescence response that varies minimally with pH. The pKa values of the metal-binding pockets of most of the Zinpyr family members imply a significant level of protonation at pH 7.13,33 This effect evokes proton-induced background emission, which in turn diminishes the turn-on response upon zinc coordination. Introduction of a pyrazine group in the ZPP1 design, replacing one of the pyridine groups of the original ZP1 sensor, accomplished two goals, namely, (i) to decrease the basicity of the binding pocket with concomitant reduction of proton-induced background fluorescence and (ii) to lower the zinc-binding affinity.
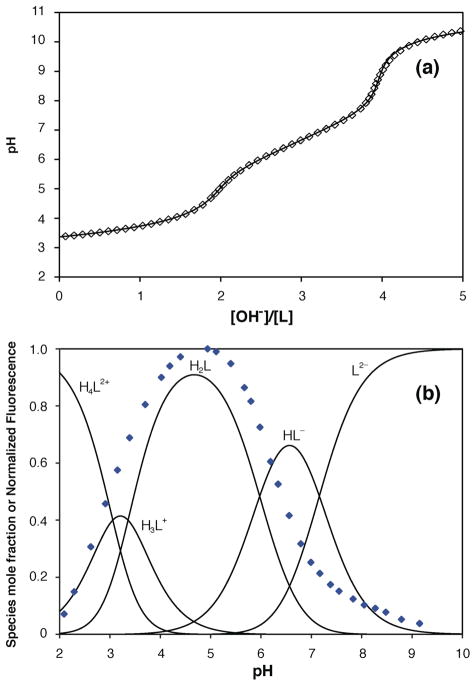
pH-dependent fluorescence profiles of ZPP1 and its 6-functionalized derivatives, in the range of 2–11 pH units, are depicted in Figure 2. The pKa values associated with proton-induced increase in emission, moving from high to low pH, were estimated from the resulting curves (see Supporting Information), yielding values ranging from 6.04 to 6.24, as summarized in Table 1. The gradual decrease in emission at pH < 4 is associated with formation of the non-emissive lactone form of the fluorescein in solution, as indicated by a decrease in the absorption of the sensor in the same pH range.36,37 Estimates for the pKa values corresponding to the different protonation events, including, but not limited to, those involved in changes in the fluorescence properties of the sensors, were obtained from potentiometric titrations. A representative data set for a titration experiment employing ZPP1 is shown in Figure 3a. The experimental data was fitted with HYPERQUAD 200625 to a model including four protonation events. At the given titration conditions, the concentration of the conjugated acids resulting from further protonation steps possibly occurring below pH 3 is too low to be reflected in the shape of the titration curve; therefore, no additional protonation equilibria were considered in the model. The average macroscopic dissociation constants resulting from the refinement of three independent runs are summarized in Table 2. The pKa values estimated for ZPP1 are appreciably lower than those obtained from potentiometric titration of the pyridine-based analogue ZP1,33 by approximately 1 pKa unit.
Figure 2.
Normalized integrated fluorescence emission of ZPP1 (squares), ZPP1(6-CO2H) (circles), and ZPP1(6-CO2Et) (triangles) over the pH range 2–11. Measurements were performed with 1 μM aqueous solutions of the fluorophore, 100 mM KCl, and 1 mM EDTA at 25 °C.
Figure 3.
(a) Potentiometric titration curve for ZPP1 (diamonds), and calculated curve (solid line) from estimated pKa values. Conditions: 0.5 mM of sensor in 100 mM KCl at 25 °C, treated with a known excess of HCl and titrated with 0.0700 M NaOH. (b) Calculated speciation plot from acid dissociation constants, overlaid on the pH-dependent fluorescence emission profile (diamonds) of ZPP1 in aqueous solution.
Table 2.
Acid Dissociation Constants for Zinpyr Sensors ZPP1 and ZP1, and for Related Secondary Amines.
| Reaction | pKaa | |||||
|---|---|---|---|---|---|---|
| ZPP1, 1 | ZP1, 2b | 7 | DPAc | |||
| HL− | ⇌ | L2− + H+ | 7.16(4) | 8.12 | 6.578(3) | 7.27 |
| H2L | ⇌ | HL− + H+ | 5.97(4) | 6.96 | < 2.5d | 2.41 |
| H3L+ | ⇌ | H2L + H+ | 3.4(1) | 4.59 | -- | 1.75 |
| H4L2+ | ⇌ | H3L+ + H+ | 3.1(2) | 3.81 | -- | |
| H5L3+ | ⇌ | H4L2++ H+ | 2.8 | |||
| H6L4+ | ⇌ | H5L3+ + H+ | 2.3 | |||
Acid dissociation constants measured at 25 °C.
Values from reference 32.
Values from reference 18.
Could not be determined reliably under the conditions employed for the analysis, and is therefore considered an upper limit; no further protonation events were detectable for (2-picolyl)(pyrazin-2-ylmethyl)amine 7. Numbers in parenthesis represent standard deviation in the last significant digits, estimated from the analysis of three separate runs.
The pKa values obtained for ZPP1 were used to construct the speciation plot for the fluorophore in the pH range 2–10 (Figure 3b). The overlaid pH-dependent fluorescence profile shows a correlation between the increase in fluorescence emission and the formation of the diprotonated H2L species, with minor contribution from emission of HL−. Accordingly, the pKa value obtained for the second protonation event from the analysis of potentiometric data resembles that established from the fluorescence titrations. This observation is consistent with the first two protonation events occurring at the metal-binding pockets,33 involving the nitrogen donors related to the PET quenching mechanism. This quenching effect can be mainly attributed to electron transfer from the tertiary amine donor; however, previous studies of other members of the Zinpyr family,33,38 have provided evidence for a contribution of the pyridyl groups to the quenching that cannot be ruled out in the related ZPP1 platform. Similar to what was previously reported for ZP1,33 a gradual hypsochromic shift is observed in the absorption profile concomitant with decreasing pH, in the range corresponding to the first two protonation events for ZPP1, thus suggesting participation of the oxygen atoms of the xanthenone system in proton binding.
The estimated acid dissociation constants confirm that the incorporation of pyrazine groups in the ZPP1 design helps to lower the overall basicity of the metal-binding pockets with respect to that of all-pyridine-based sensors such as ZP1. For comparison, potentiometric titrations of (2-picolyl)(pyrazin-2-yl-methyl)amine, 7, used as the metal-binding group of the ZPP1 probes, reveal a pKa of 6.578(3) for the protonated tertiary nitrogen atom (Figure S6). This value is significantly lower than that for dipicolylamine (pKa3 = 7.27)18, consistent with the trend observed for the corresponding sensors.
Metal Binding Properties
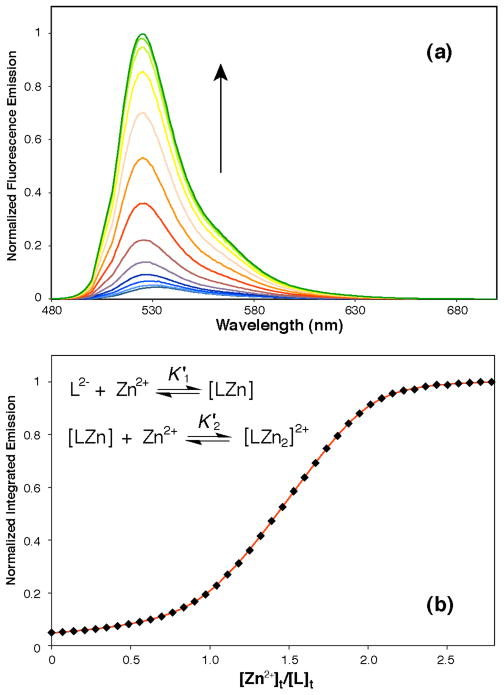
Titration of aqueous solutions of ZPP1(6-CO2H) or its ethyl ester derivative with ZnCl2 at pH 7.0, produce a blueshift in the absorption maximum of the dye and a gradual increase in the fluorescence emission (Figure 4a), which saturates upon addition of two equivalents of zinc. The resulting binding isotherm (Figure 4b) displays two regions with markedly different slopes, which reflect two sequential binding events, each yielding species with distinct fluorescence properties. More specifically, the small increase in fluorescence emission observed up to the adittion of the first zinc equivalent corresponds to the formation of a monometalated species that is only slightly more emissive than the metal-free sensor. Subsequently, a pronounced increase in emission intensity is observed upon addition of the second equivalent of zinc, thus indicating that occupation of both metal-binding sites of the sensor is required for full fluorescence turn on. This observation is consistent with a combined quenching effect of the two amine-based metal binding groups, as reported for other fluorescein scaffolds functionalized with multiple quenching units,39 and suggested from the analysis of the pH-dependent fluorescence profile of our ZP133 and ZPP1 probes (vide supra).
Figure 4.
Zinc binding properties of ZPP1(6-CO2H). (a) Fluorescence response of the sensor to incremental additions of ZnCl2. Conditions: 1 μM solution of sensor in aqueous buffer at pH 7, 25 °C, λex = 505 nm. Shown are selected traces for 0.2 μM increments in zinc concentration. (b) Integrated fluorescence emission of a 1 μM solution in aqueous buffer at pH 7, 25 °C, as a function of added zinc (squares), and theoretical curve calculated from a model considering two sequential binding events (solid line).
The apparent binding constants corresponding to two sequential zinc coordination events, occurring at fixed pH (Figure 4b, inset), can be extracted from the analysis of the binding isotherm through a nonlinear curve fit to eq 2. The parameters I1, I2, and I3 represent proportionality constants related to the emission efficiency of each fluorescent species in solution, namely L (unbound sensor), LZn (monometalated sensor), and LZn2 (doubly occupied sensor), respectively (Scheme 2).
Scheme 2.
Zinc Binding to ZPP1 and Derivatives.a
aThis simplified scheme does not reflect the different possible protonation states of each species. [L] denotes the sum of L2− (shown) and protonated forms LH− and LH2 present in solution at neutral, constant pH. This convention also applies to the term [LZn], which represents a combination of LZn and HLZn+ at pH 7.
| (2) |
| (3) |
Because of the tight metal binding displayed by the probes under study, reflected by the shape of the binding isotherm, the concentration of mobile zinc in solution, [Zn], is expected to be significantly lower than the total concentration of zinc, [Zn]t. Under these conditions, the cubic expression in eq 3 must be solved to estimate the concentration of mobile zinc at each point of the titration,15,40 while simultaneously fitting the experimental data using eq 2. This analysis was performed through a two-step user-defined iterative procedure implemented in OriginPro 8.0, as described in the literature.41 The apparent binding constants calculated from fluorescence titration data of the 6-functionalized ZPP1(6-CO2R) derivatives are summarized in Table 3. To assure the validity of any comparison, we deemed it appropriate to re-evaluate the apparent binding affinities of the parent ZPP1 sensor applying the same data analysis procedure as that employed for the 6-functionalized derivatives (see Supporting Information). The results reveal similar affinities for ZPP1 and its derivatives, with a two order of magnitude difference between binding of the first and second equivalent of zinc; the first binding occurs in the subnanomolar range and the second, responsible for the fluorescence turn on, occurs in the mid-nanomolar range.
Table 3.
Apparent Metal Binding Constants of ZPP1 and 6-Functionalized Derivatives.
| K′1a,b (M−1) | K′2a,b (M−1) | |
|---|---|---|
| ZPP1 | 2.6(2)×109 | 6.4(2)×107 |
| ZPP1(6-CO2H) | 1.9(1)×109 | 5.5(3)×107 |
| ZPP1(6-CO2Et) | 3.1(3)×109 | 6.9(1)×107 |
Measurements performed in aqueous buffer at pH 7.0, 50 mM PIPES, 100 mM KCl.
K′ represents the conditional equilibrium constant corresponding to stepwise zinc binding events at fixed pH. Numbers in parenthesis represent standard deviations in the last significant digits, estimated from the analysis of three separate runs.
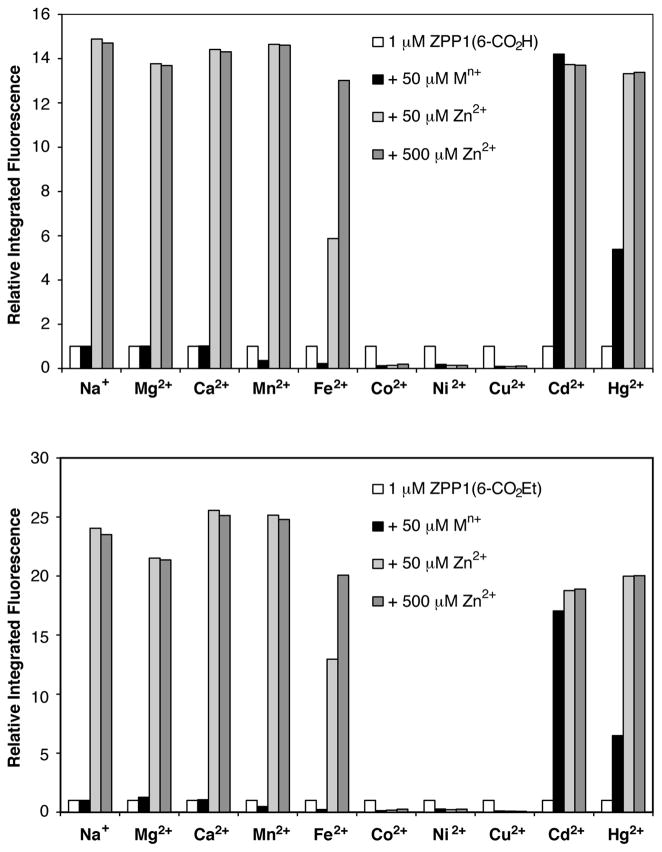
The observed resemblance in the zinc binding constants displayed by the 6-functionalized derivatives and the parent ZPP1 is consistent with the hypothesis that incorporation of carboxylate/ester moieties in the phenyl ring of the fluorescein has no significant influence on the metal binding properties of the compounds. Based on this notion, similar metal selectivity properties are expected for all members of the family. To evaluate this hypothesis, the fluorescence response of the new derivatives ZPP1(6-CO2R) to a variety of biologically relevant metal ions was investigated. As shown in Figures 5a and 5b, the observed selectivity is qualitatively equivalent to that obtained for the parent ZPP1.15 Treatment with alkali and alkaline earth metals has no effect in the fluorescence, whereas paramagnetic transition metal ions such as Co2+, Ni2+, and Cu2+ completely quench the emission in a virtually irreversible manner. Despite a potential interference of these ions with zinc detection due to competitive binding, the quenching of the fluorescence by Co2+, Ni2+, and Cu2+ assures that no ‘false positive’ turn-on response would be induced by such metals in the analysis of biological samples. Treatment with Fe2+ and Mn2+ results in fluorescence quenching that can be reversed by displacement with Zn2+. Finally, as expected from the similarities in binding properties between members of the same group, Cd2+ and Hg2+ also bind to both ZPP1(6-CO2R) derivatives inducing a fluorescence turn-on response. However, because of the low content of these heavier congeners in typical biological samples, there should be no interference with zinc detection. The emission spectra obtained upon binding of either Cd2+ or Hg2+ display maxima at longer wavelengths than those observed upon zinc coordination. For ZPP1(6-CO2H), the emission maximizes at 532 nm in the presence of Cd2+ and at 539 nm in the presence of Hg2+; for the ethyl ester derivative, the fluorescence spectra display maxima at 535 and 540 nm in the presence of Cd2+ and Hg2+, respectively. Addition of Zn2+ to solutions of sensors containing either Cd2+ or Hg2+ produces a blueshift of the emission wavelengths to values typical of zinc coordination (λem= 525 and 528 nm for the acid and ester, respectively), which is consistent with metal displacement by zinc.
Figure 5.
Metal selectivity of ZPP1(6-CO2H) and ZPP1(6-CO2Et) in aqueous buffer at pH 7.0. For each sample, a 1 μM solution of the sensor (white bar) was mixed with 50 μM of the cation of interest (black bar), and then subsequently treated with 50 μM (light gray) or 500 μM (dark gray) ZnCl2. Integrated fluorescence after each addition is normalized with respect to the fluorescence of the metal-free sensor. λex = 505 nm for ZPP1(6-CO2H), λex = 508 nm for ZPP1(6-CO2Et)
Potentiometric titrations of ZPP1 were performed in the presence of 1 to 2 equiv of Zn2+ to obtain a more detailed description of the metal and proton binding properties of the sensor. The experimental titration curves were analyzed with HYPERQUAD 200625 to obtain formation constants for the different zinc-bound species (Table 4), using previously determined pKa values for the metal-free sensor. Because of the low solubility of the compounds at high pH in the presence of zinc, only data collected below pH 8.5 were employed to refine the binding constants. The formation of precipitates at higher pH values is most likely due to formation of zinc hydroxo species,42 but no attempt was made to characterize the solids. Incorporation of possible metal hydroxo species into the model did not significantly alter fits of the data in the pH range considered, and consequently they were neglected.
Table 4.
Formation Constants for Zinc Complexes of Zinpyr Sensors ZPP1 and ZP1at 25 °C.
| Reaction | log Ka | |||
|---|---|---|---|---|
| ZPP1, 1 | ZP1, 2b | |||
| L2− + Zn2+ | ⇌ | LZn | 8.3(2) | 13.4 |
| LZn + Zn2+ | ⇌ | LZn2 2+ | 7.1(4) | 8.9 |
| LZn + H+ | ⇌ | HLZn+ | 5.9(2) | 6.57 |
| HLZn+ + H+ | ⇌ | H2LZn2+ | 4.1(4) | 4.02 |
| H2LZn2++ H+ | ⇌ | H3LZn2+ | -- | 3.19 |
Equilibrium constants correspond to the association of protons or zinc as described in the equations displayed in the left hand column.
Values were obtained from ref. 32. Numbers in parentheses represent standard deviations in the last significant digits, estimated from analysis of three separate runs.
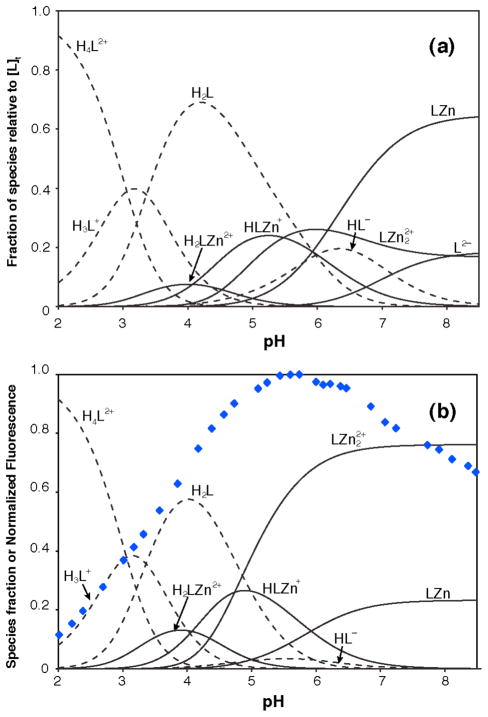
Based on the calculated formation and acid dissociation constants, speciation diagrams as a function of pH were calculated for a solution containing 1 μM of ZPP1 in the presence of one or two equivalents of Zn2+ (Figures 6a and 6b). Such plots reveal that, at micromolar sensor concentrations, protonation does not compete effectively with zinc binding in a biologically relevant pH range. LZn and LZn2 2+ are the major species in solution for the two respective cases considered. Overlaid onto the species distribution diagram in Figure 6b is the pH-dependent emission of a 1 μM ZPP1/2 μM ZnCl2 solution, which reflects a minor contribution from HLZn+ fluorescence.43
Figure 6.
Calculated speciation plots as a function of pH in the range 2–8.5 for (a) an aqueous solution containing 1 μM ZPP1 and 1 μM ZnCl2, and (b) an aqueous solution containing 1 μM ZPP1 and 2 μM ZnCl2. Overlaid in (b), blue diamonds, is the fluorescence emission of a solution containing 1 μM ZPP1, 2 μM ZnCl2, and 100 mM KCl as a function of pH.
Quantification of Zinc by Titration with ZPP1 Sensors
Because of the paucity of readily available ratiometric sensors having a reliable, well-calibrated response to zinc, quantification of mobile Zn2+ is commonly based on protocols that can be conducted in a cuvette with intensity-based sensors at fixed wavelengths. A typical estimate of zinc concetration is obtained from an expression such as eq 4, where F is the fluorescence intensity of the sample of unknown concentration, Fmax is the intensity corresponding to a sample saturated with excess zinc, and Fmin is the fluorescence of the metal-free probe obtained, for example, in the presence of a strong chelator.44
| (4) |
This protocol yields satisfactory results when the dissociation constant Kd approaches the mean concentration of the analyte under study; however, it can lead to important errors in the determination of low zinc concentrations as well as in situations when the sensor is present at near-saturation levels. These circumstances limit significantly the practical concentration range for such measurements. A different method relies on the interpolation of a fluorescence intensity reading mapped onto a previously established calibration curve. This procedure also suffers from only being applicable over a narrow concentration range for most available sensors.45 Further complications arise with the interpretation of results obtained from experiments carried out with sensors with multiple binding sites or coordination modes. The wide range of zinc concentrations in biological samples of interest, spanning the picomolar to submillimolar range,2 demands the availability of alternative fluorescence-based protocols for quantification.
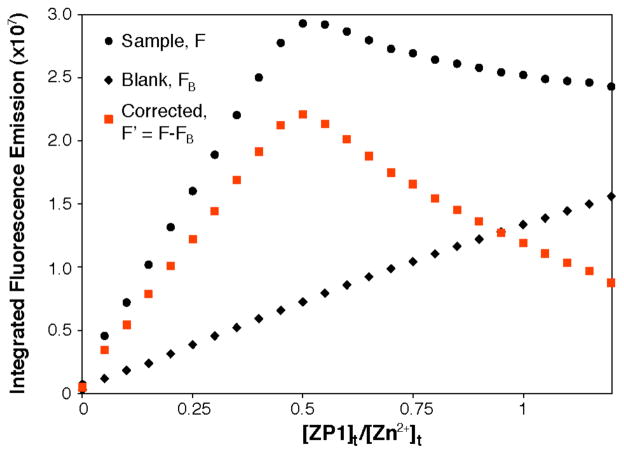
Initial studies performed with ZPP1 indicated that, when an aqueous solution of zinc is titrated with a solution of the free sensor at pH 7, a two-step fluorescence response is obtained having a distinctive maximum (Figure 7). After subtraction of a blank titration performed in the absence of zinc (F′= F − FB), the plot of corrected fluorescence F′ versus added sensor has a maximum at the point where the ratio of total added sensor is half that of the total zinc concentration. This behavior can be exploited to determine unknown concentrations of zinc, based on titrations with probe solutions of known concentration. The value of this method was exemplified by determining the concentration of mobile zinc released from pancreatic Min6 cells upon glucose stimulation15 and, more recently, by evaluating mobile zinc content in cell lysates from normal and transformed prostate adenocarcinoma cell lines RWPE1 and RWPE2.22 The major focus of the present investigation has been to establish the underlying principles associated with this behavior and to determine the conditions under which such a titration method is likely to provide the desired quantitative results.
Figure 7.
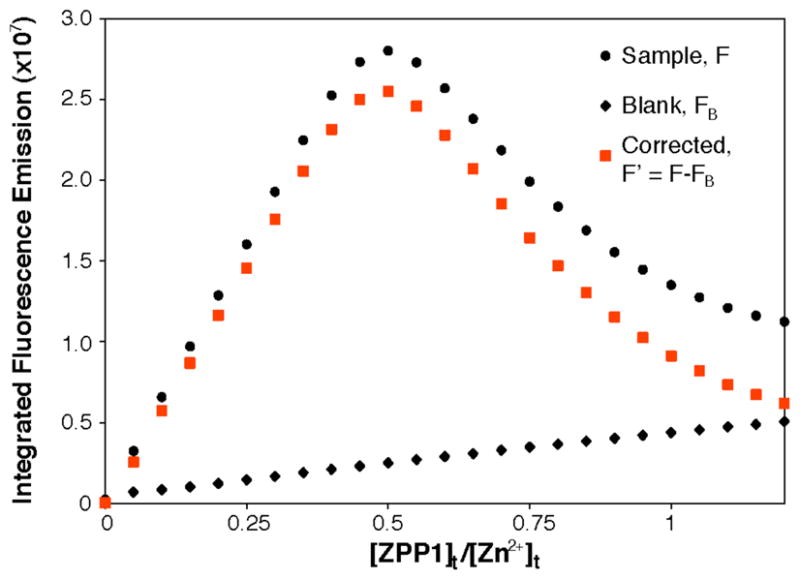
Fluorescence titration of 1.0 μM Zn2+ in aqueous buffer at pH 7.0 with incremental additions of ZPP1 sensor. Corrected fluorescence F′ (■) was obtained by subtraction of a blank (◆) to the sample titration (●).
With the use of metal binding constants provided by analysis of the binding isotherm, a species distribution diagram for the titration of 1.0 μM Zn2+ with ZPP1 at pH 7.0 was constructed (Figure 8; see also Figure S11 in the SI for a detailed speciation plot that takes into consideration protonation equilibria). The increase in fluorescence intensity upon addition of sensor correlates with the buildup of the strongly fluorescent dimetalated species LZn2 in solution. The intensity of the emission reaches a maximum when the L:Zn2+ ratio equals the corresponding 1:2 stoichiometry of the complex, and then decreases as the equilibria favor the formation of the much more weakly fluorescent LZn species. Notably, this behavior is not attainable with monotopic turn-on sensors, for which a plateau in the curve of emission intensity vs. added sensor is common. The proportionality constants corresponding to the emission intensity of L, LZn, and LZn2, designated I1, I2, and I3, respectively as summarized in Table S1, estimated from a nonlinear curve fit of the binding isotherm, were employed to calculate the individual contribution of each species to the overall fluorescence emission. As shown in Figure 8, the predicted corrected emission F′, calculated according to eq 5, matches the experimental data very well.
Figure 8.
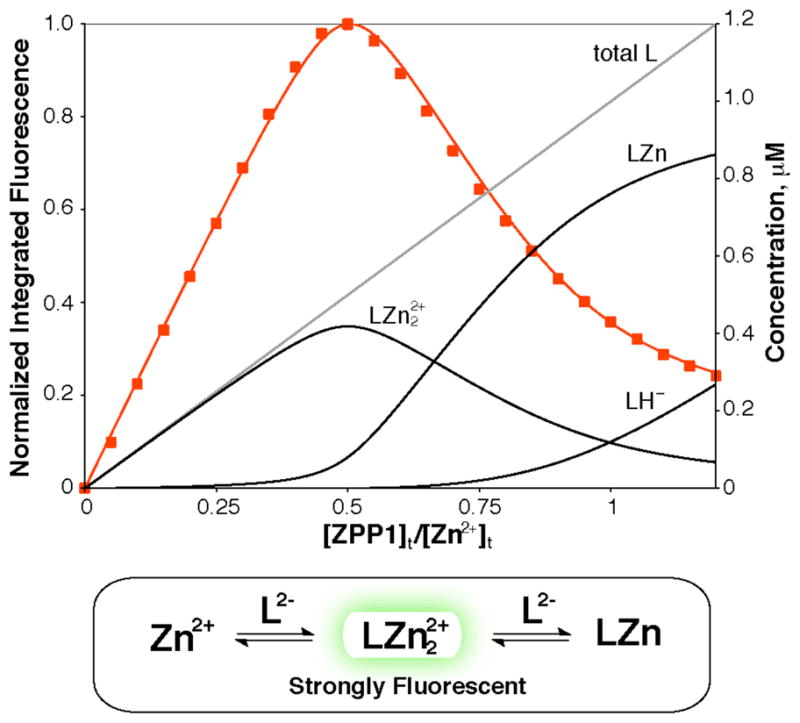
Species distribution diagram for a fluorescence titration of 1.0 μM Zn2+ in aqueous buffer at pH 7.0, treated with incremental additions of ZPP1 sensor. Overlaid is the observed corrected fluorescence F′ (red squares) and the theoretical corrected fluorescence (red solid line), calculated based on contributions of the individual species to the overall fluorescence emission. The theoretical corrected fluorescence was calculated as , using the proportionality constants previously determined from the fit of the binding isotherm.
Inflection or break points in binding curves have traditionally been employed to determine the stoichiometry of metal-ligand complexes.40 As illustrated for the extensively employed “mole ratio” method,46 a plot of a physical property that is directly proportional to the concentration of a complex, AaBb, as a function of sample composition expressed in mole ratio, provides a means to determine the composition of the complex of interest. With the use of a series of samples prepared such that the analytical concentration of one component A remains constant while that of a second component B changes, a plot can be generated that displays a marked change in slope and typically reaches a plateau at the point where the ratio of [A] and [B] corresponds to the stoichiometry of the complex. The fluorescence properties of ditopic Zinpyr sensors, which exhibit two sequential binding events with a significantly higher fluorescence emission for the dimetalated LZn2 form compared with those of the free ligand L and monometalated LZn form, produce a change in slope of the fluorescence vs. mole ratio plot that leads to appearance of a maximum when the added sensor is half the zinc ion concentration. Such a maximum in the titration curve can be readily identified without complicated data analysis procedures, thus offering a clear equivalence point that renders the protocol particularly valuable for determining unknown concentrations of chelatable zinc in solution. Because the determination of zinc concentration requires knowledge of the sensor concentration at the fluorescence maximum, the proposed titration protocol is not applicable for analyzing mobile zinc content in samples with non-homogeneous dye accumulation, such as might occur within intracellular compartments.
In the mole ratio method,40,46 the appearance of a clear break point in the binding curve requires that the extent of dissociation of the complex under study be kept to a minimum under the chosen experimental conditions. This situation also obtains for the proper application of the related Method of Continuous Variations (Job’s method)47 in the determination of complex stoichiometry. In particular, the dissociation constant of the complex must be small with respect to the total concentration of its components in solution. As a result, the aforementioned methods are typically applied to the analysis of complexes having large stability constants. For cases in which the extent of dissociation is significant, i.e. weak complex formation, the binding curves appear ‘rounded’, and an inflection point or change in slope is difficult to identify.48,49 When multiple complexes form in solution, distinct break points will be observed at mole ratios associated with each corresponding stoichiometry, assuming that the difference in magnitude between successive stepwise binding constants is appropriately large.50
Based on the above considerations, the appearance of a maximum in the fluorescence titration curve obtained upon addition of increasing amounts of the sensor to a solution of mobile zinc will be analyzed in terms of two main components, namely, (i) the difference in emission of LZn2 vs. LZn and L, and (ii) the combination of K values for the first and second binding events with respect to the concentration of mobile zinc being titrated. The analysis is not restricted to our Zinpyr sensors, and illustrates the general applicability of the titration method for the quantification of mobile zinc with other ditopic probes. The results can conceivably be extended to studies of other analytes.
At any point along the fluorescence titration curve, the integrated emission is determined by the sum of individual contributions from each fluorescent species in solution. The corrected fluorescence intensity F′, obtained by subtraction of emission from a sample containing only the sensor, is given by eq 5. This expression can also be written as a function of zinc concentration (eq 6), where [Zn]
| (5) |
| (6) |
represents the concentration of unbound Zn2+ in solution at each point of the titration, given by the cubic eq 3. Before attempting an analytical solution of this equation, we devised a simple graphical approach to estimate whether the titration curve obtained with a given sensor would display a well-defined maximum at [L]t/[Zn]t = 1/2 for a particular analyte concentration. For this purpose, the known thermodynamic constants K′1 and K′2, and the characteristic fluorescence turn-on profile of a probe, i.e. the relative emission intensity of LZn2 vs. LZn and L represented by I3, I2, and I1, are used to compute the fluorescence emission at two specific points along the titration curve, namely, the expected maximum at [L]t/[Zn]t = 1/2, denoted F′12, and the second equivalence point, denoted F′11, for which [L]t/[Zn]t = 1 (Figure 9). For a titration curve with a clear maximum at [L]t/[Zn]t = 1/2, the ratio F′12/F′11 must be greater than one.
Figure 9.
Graphical approach for predicting the appearance of a maximum in the fluorescence response for the analysis of a Zn2+ solution treated with incremental additions of a ditopic sensor. Shown is a generic curve displaying the two equivalence points F′12 and F′11 used for the analysis: a fluorescence curve displaying a maximum at [L]t/[Zn]t =1/2 will be characterized by a F′12/F′11 ratio greater than one.
The use of the F′12/F′11 ratio offers a simple means by which to estimate the range of zinc concentrations where the titration protocol described here would produce a curve with a distinguishable maximum. The F′12/F′11 ratio provides a coarse evaluation of the detection limits associated with the use of any given ditopic sensor in the quantitation of zinc by fluorescence titration. Employing the previously established apparent binding constants and relative fluorescence emission of the different metal-bound and -free forms of ZPP1 and its derivatives (Tables 3 and S1), predicted F′12/F′11 ratios were computed for a range of biologically relevant mobile zinc concentrations (Figure 10). Values of [Zn2+] for which the F′12/F′11 < 1.0 will not produce a maximum at [L]t/[Zn]t =1/2 and are therefore considered below the detection limit of the method. Based on the instrumentation employed for the titration experiment, the user can choose a minimum value of F′12/F′11 for which the change of slope in the titration curve can be reliably distinguished from inherent errors in the data.
Figure 10.
F′12/F′11 ratio as a function of total analyte concentration for the sensors ZPP1 (—) and derivatives ZPP1(6-CO2H) (---) and ZPP1(6-CO2Et) (-·-), calculated based on the thermodynamic and photophysical paramaters previously determined for each probe. Zinc concentration levels for which F′12/F′11 is smaller than one will not lead to the appearance of a fluorescence maximum in the titration curve, and therefore are considered below the detection limit of the method.
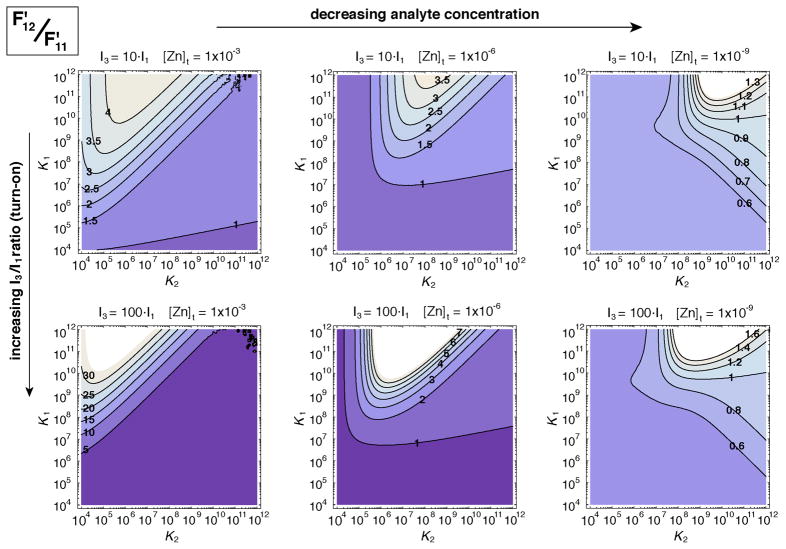
The use of the F′12/F′11 ratio can be extended to evaluate the effect of the different paramaters in the fluorescence response obtained for any generic ditopic sensor displaying two sequential binding events characterized by K1 and K2, and with given turn-on ratios described by constants I3/I1 and I2/I1. Such an analysis not only offers insight into the behavior of the ditopic members of the Zinpyr family, but also provides guidelines for the design of other ditopic sensing platforms suitable for the implementation of the proposed strategy for zinc quantification in solution. Combining eqs 3 and 6, a series of contour plots were constructed, displaying the F′12/F′11 ratio as a function of K1 and K2 for given [Zn]t analyte concentrations and turn-on ratios (Figure 11). Ratios I3/I1 corresponding to 10 and 100 turn-on were chosen as representative values of typical responses reported for fluorescent sensors. A smaller I2/I1 ratio of 2 was employed, based on the knowledge that there is an additive quenching effect produced by two amine-based chelating arms and from values obtained for ZPP1 and ZPP1(6-CO2R) derivatives.
Figure 11.
Influence of metal binding affinities, total analyte concentration [Zn]t, and relative emission of dimetalated vs. metal-unbound sensor (represented by I3/I1) on the appearance of a maximum in a titration of zinc by a ditopic fluorescent probe. Contour plots show the ratio of corrected fluorescence intensity F′12/F′11 as a function of K1 and K2 for sensors characterized by 10- or 100-fold overall turn-on response in the analysis of hypothetical samples containing nanomolar, micromolar, or millimolar concentrations of chelatable zinc. Ratios of F′12/F′11 less than one indicate the absence of a fluorescence maximum at [L]t/[Zn]t = 1/2. All plots were constructed using I2/I1 = 2.
Each contour plot contains a region, defined by combinations of K1 and K2, which produces a fluorescence intensity maximum in the titration curve, characterized by F′12/F′11 ratios greater than one. Marked differences between the emission efficiency of the metal-bound and metal-free forms, described by larger values of I3/I1 (higher turn-on ratio) lead to more pronounced maxima, yielding large F′12/F′11 ratios and improved detection. Larger values of K1 are favorable for the appearance of a maximum, but the dependence on the magnitude of K2 is less obvious. Chemical considerations suggest that K2 must be large enough for the strongly fluorescent dimetalated species LZn2 to accumulate in solution, yet small enough to assure that the second binding event is effectively reversible such that the equilibrium can be shifted to form the more weakly fluorescent monometalated species LZn under the conditions of the experiment. In general, for a typical host with multiple metal binding sites and in the absence of cooperativity, the magnitude of successive stepwise binding constants will decrease such that K2 < K1. The lower boundary value for K2 to facilitate this titration method will be influenced by the concentration of analyte to be determined (vide infra).
Examination of the contour plots in Figure 11 suggests that the observed response will not be limited to ZPP1 but should occur for other ditopic sensors that display an appropriate change in fluorescence upon binding of the second zinc equivalent, with relatively tight zinc binding. This observation prompted us to investigate the behavior of the all-pyridine-based parent sensor ZP120,21 in a fluorescence titration experiment with a zinc solution of known concentration. As shown in Figure 12, the ZP1 titration curve also displays a two-step OFF–ON–OFF fluorescence response, with a clear maximum at [L]t/[Zn]t = 1/2. As anticipated from the greater zinc binding constants of ZP1 compared to those of ZPP1 (see Table 4), the curve displays a sharper break point that more closely resembles the intersection of two straight-line segments at the point of change of slope. Although sharper, the maximum is less pronounced than that obtained for ZPP1, mainly due to smaller differences between emission efficiencies of LZn2, Lon, and L associated with the smaller turn-on ratio, 6-fold for ZP1,33 versus 13-fold for ZPP1.15
Figure 12.
Fluorescence titration of 1.0 μM Zn2+ in aqueous buffer at pH 7.0 with incremental additions of ZP1. Corrected fluorescence F′ (■) was obtained by subtraction of a blank titration, performed with buffer devoid of zinc (◆), from the sample titration (●).
Thus far we have adopted a relatively simple graphical approach to assess the possible occurrence of a maximum in the fluorescence titration curve. This approach is mathematically simple and offers a means to visualize the influence of the different variables in the shape of the curve, thus aiding in the interpretation of the system from a chemical perspective. However, for the titration method to be of practical use, the maximum must be located at the point where the ratio of components in the sample matches the stoichiometry of the complex being formed, which remains to be demonstrated. We therefore re-examined the system to obtain an analytical solution for the maximum. In particular, we constructed a series of contour plots that display the [L]t/[Zn]t ratio at the maximum of corrected fluorescence, as a function of K1 and K2 (see Supporting Information for details). From this analytical solution, two important conclusions were derived. Firstly, K2 must be greater than a critical value, given by the inequality in eq 7, for the titration curve to have a real maximum and, secondly, for complexes with weak binding, or for experiments conducted at very low concentrations of zinc that approach the magnitude of the dissociation constants, the location of the maximum shifts to values of [L]t/[Zn]t larger than the expected . value, leading to potential errors in the determination.
| (7) |
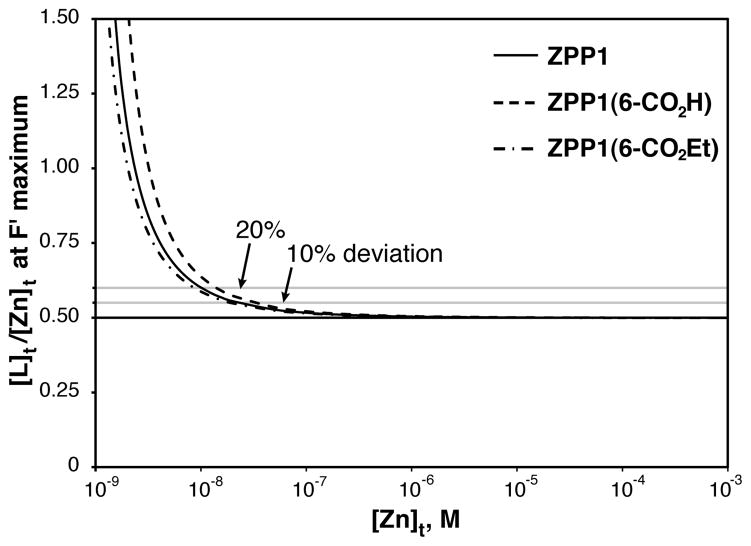
Based on the thermodynamic and photophysical parameters determined for ZPP1 and its derivatives, we calculated the expected [L]t/[Zn]t ratio at the point of maximum emission in the fluorescence titration, spanning a range of biologically relevant zinc concentrations (see Supporting Information for details). As shown in Figure 13, the location of the maximum shifts to larger [L]t/[Zn]t ratios for zinc concentrations in the low nanomolar range. A similar plot can be constructed based on known parameters of any ditopic sensor, thus allowing the user to assess the lower concentration limit for which the titration method will be applicable. Unlike concentration estimates based on single intensity readings, such as those described at the beginning of this section, the titration protocol presented here does not have an upper limit on the range of analyte concentrations that can be determined, other than that associated with instrumentation limitations.
Figure 13.
Theoretical ratio [L]t/[Zn]t at the point of maximum emission in fluorescence titration curves using ZPP1 and ZPP1(6-CO2R) derivatives, for a range of biologically relevant Zn2+ concentrations. In the low nanomolar range the maximum in fluorescence will no longer correspond to the mole ratio expected for a 1:2 stoichiometry, and calculation of zinc concentrations would be biased.
Live Cell Imaging – ZPP1(6-CO2Et) and ZPP1(6-CO2H)
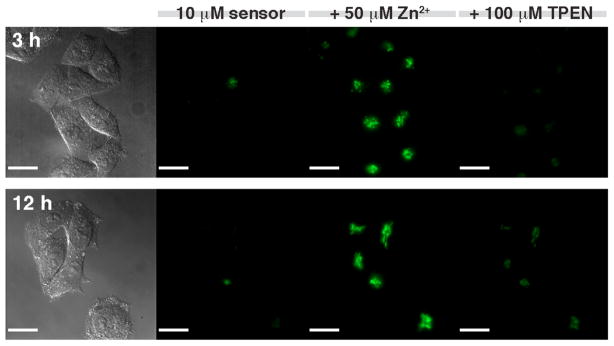
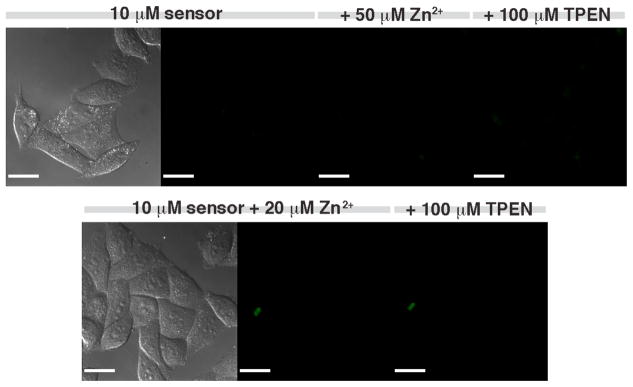
The relative abilities of the two new sensors to permeate cell membranes and detect changes in intracellular mobile zinc was evaluated in live HeLa cells, following addition of exogenous zinc. As shown in Figure 14, cells incubated with 10 μM of the ZPP1(6-CO2Et) ester for 3 – 12 h display distinctive bright fluorescence in response to addition of exogenous zinc carried by the ionophore pyrithione (2-mercaptopyridine-N-oxide). The observed staining resembles that obtained with ZPP1 using similar protocols. In contrast, incubation of the cells for up to 12 h with 10 μM of the free carboxylate ZPP1(6-CO2H) did not elicit a distinguishable fluorescence response (Figure 15), demonstrating that this derivative is not internalized by the cells. In a similar experiment, cells were incubated with ZPP1(6-CO2H) in the presence of two equivalents of ZnCl2 in solution. No sensor uptake was detected under these conditions, indicating that altering the charge of the molecule by extracellular zinc coordination does not confer membrane permeability upon ZPP1(6-CO2H) and, moreover, that the sensor does not act as an ionophore. The effect of zinc binding on the membrane permeability of the ester ZPP1(6-CO2Et) was also investigated (Figure S13). Co-incubation of the sensor with two equivalents of zinc did not alter significantly the sensor uptake. However, fluorescence emission was only detected after treatment with an additional zinc/ionophore during on the microscope stage, thus demonstrating that the sensor does not carry zinc across the cell membrane during a 12-h incubation.
Figure 14.
Fluorescence imaging of live HeLa cells incubated with 10 μM of ZPP1(6-CO2Et) for 3 h (top row) and 12 h (bottom row) at 37 °C. Images were aquired before and after treatment with zinc:pyrithione in a 1:1 ratio, for a total concentration of 50 μM, and after treatment with membrane-permeable chelator TPEN, 100 μM, applied on the microscope stage. Scale bar= 25 μm.
Figure 15.
Fluorescence microscopy of live HeLa cells incubated with 10 μM of ZPP1(6-CO2H) at 37 °C in the presence (bottom row) and absence (top row) of 20 μM exogenous zinc. Images were aquired before and after treatment with 100 μM membrane-permeable chelator TPEN, applied on the microscope stage. Scale bar = 25 μm.
Consistent with staining patterns observed for other members of the Zinpyr family, membrane-permeable sensors of the ZPP1 series, ZPP1 and ZPP1(6-CO2Et), accumulate in intracellular compartments, specifically in areas surrounding the nucleus. Co-localization fluorescence microscopy experiments conducted in live HeLa cells with the organelle-specific dyes Hoechst 33258 (nucleus), Mitotracker Red (mitochondrion), and BODIPY TR ceramide (general Golgi stain), revealed that both ZPP1 and ZPP1(6-CO2Et) accumulate in Golgi (Figure 16, S14, and S15) and are excluded from the nucleus. The partial overlap of the signal originating from the sensor and the mitochondria stain is attributed to stacking of Golgi and mitochondria along the z direction, as confirmed by an analysis of Z-sectioned images (SI). It is important to note that bleed-through or crossover of the sensor-induced fluorescence to the red channel occurs. Cognizant of this effect, and in order to prevent potential artifacts in our co-localization studies, images of the organelle-specific stains in the red channel were obtained prior to in situ treatment of the cells with exogenous zinc, thus ensuring that no fluorescence contribution from the sensor was being detected in this channel.
Figure 16.
Co-localization studies of ZPP1 (top row, images a–h) and ZPP1(6-CO2Et) (bottom row, images i–p) with organelle specific dyes in HeLa cells. For each series of images, cells were incubated with 10 μM sensor for 3 h and then treated with 1:1 zinc:pyrithione, 50 μM each, on the microscope stage. Organelles were stained with Mitotracker red, 0.2 μM 30 min (series a–d and i–l) or BODIPY TR ceramide, 4 μM 30 min (series e–h and m–p) for labeling of mitochondria and Golgi apparatus, respectively. Within each series, the panels correspond to, from left to right, (i) DIC image, (ii) zinc sensor, (iii) organelle stain, and (iv) overlay of zinc probe and organelle stain. Scale bar = 25 μm. See Figures S14 and S15 for larger images.
SUMMARY AND CONCLUSIONS
A new set of ditopic zinc fluorescence sensors of the ZPP1 family were prepared and characterized, ZPP1(6-CO2R) (R = H, Et), with a carboxylate or ester moiety in the 6 position of the fluorescein. This functionalization modulates the cell membrane permeability of ZPP1, allowing for selective intra- or extracellular imaging of zinc while retaining the binding properties of the original ZPP1 design. The apparent zinc affinities of all three members of the series, as determined by fluorescence tritrations, reflect a two order of magnitude difference in binding affinity for the first vs. the second equivalent of added zinc. The first binding event occurs in the subnanomolar range and the second, responsible for fluorescence turn on, occurs in the mid-nanomolar range. A combination of spectrophotometric and potentiometric investigations reveals a correlation of proton-induced background emission from the fluorescent probes with the formation of a diprotonated H2L species, observed at low pH values, indicating that both binding pockets must be occupied to exert complete turn-on.
In previous work we discovered that fluorescence titration of homogeneous samples of chelatable zinc with incremental additions of ZPP1 yields a response profile that displays a clear maximum in intensity when the L:Zn2+ ratio is 0.5. Through detailed chemical and mathematical analysis of the system, we hereby demonstrate that this fluorescence maximum correlates with the buildup and subsequent dissociation of the strongly fluorescent, dimetalated species LZn2 in solution. We established that two main factors determine the appearance of the maximum in the fluorescence titration curve, namely, (i) a significant difference in emission efficiency of LZn2 compared with LZn and L, and (ii) a suitable combination of binding constants for the first and second binding events with respect to the concentration of zinc to be determined by the titration. In particular, we show that a ditopic sensor having K1 > K2 and increasing emission in the order L < LZn < LZn2 exhibits a well defined lower limit for the value of K2 that would yield the desired response, a magnitude that depends on the total concentration of analyte in the sample. In addition to the appearance of a maximum, we studied the range of zinc concentrations for which such a maximum in fluorescence occurs at the expected stoichiometry, thus establishing the scope of the titration method for quantification purposes. Our results indicate that the underlying principles governing the response of the ZPP1 series are applicable to the ZP1 analogue, and may guide the design of other ditopic sensors suitable for the analysis of samples spanning the concentration levels of significance in zinc biology.
Supplementary Material
Acknowledgments
This work was supported by NIH grant GM065519 from the National Institute of General Medical Sciences. D.B. thanks the National Institute of Biomedical Imaging and Bioengineering for a postdoctoral fellowship (F32EB009969). Spectroscopic instrumentation in the MIT DCIF is maintained with funding from NIH Grant 1S10RR13886-01. We thank Mr. Gabriel Sanoja for assistance with metal selectivity studies, and Mr. Tim Kowalczyk and Dr. Michael Pluth for useful discussions.
Footnotes
SUPPORTING INFORMATION AVAILABLE: Absorbance and fluorescence spectra for ZPP1(6-CO2R) (R = H, Et) in their metal-free and metal-bound forms, detailed fitting procedures for fluorescence titration data, potentiometric titration data for compound 7 and for ZPP1 in the presence of zinc, speciation plot for titration of Zn2+ with ZPP1 considering protonation equilibria, enlarged microscopy images for co-localization experiments conducted with ZPP1 or ZPP1(6-CO2Et) and organelle-specific dyes in live HeLa cells, and NMR spectra of synthesized compounds. This material is available free of charge via the Internet at http://pubs.acs.org.
References
- 1.Vallee BL, Falchuk KH. Physiol Rev. 1993;73:79–118. doi: 10.1152/physrev.1993.73.1.79. [DOI] [PubMed] [Google Scholar]
- 2.Frederickson CJ, Koh JY, Bush AI. Nat Rev Neurosci. 2005;6:449–462. doi: 10.1038/nrn1671. [DOI] [PubMed] [Google Scholar]
- 3.Costello LC, Franklin RB. Mol Cancer. 2006;5:59–63. doi: 10.1186/1476-4598-5-59. [DOI] [PMC free article] [PubMed] [Google Scholar]
- 4.Mager M, McNary WF, Lionetti F. J Histochem Cytochem. 1953;1:493–504. doi: 10.1177/1.6.493. [DOI] [PubMed] [Google Scholar]
- 5.Taylor CG. Biometals. 2005;18:305–312. doi: 10.1007/s10534-005-3686-x. [DOI] [PubMed] [Google Scholar]
- 6.Tomat E, Lippard SJ. Curr Opin Chem Biol. 2010;14:225–230. doi: 10.1016/j.cbpa.2009.12.010. [DOI] [PMC free article] [PubMed] [Google Scholar]
- 7.Domaille DW, Que EL, Chang CJ. Nat Chem Biol. 2008;4:168–175. doi: 10.1038/nchembio.69. [DOI] [PubMed] [Google Scholar]
- 8.Que EL, Domaille DW, Chang CJ. Chem Rev. 2008;108:1517–1549. doi: 10.1021/cr078203u. [DOI] [PubMed] [Google Scholar]
- 9.Danscher G, Howell G, Perezclausell J, Hertel N. Histochemistry. 1985;83:419–422. doi: 10.1007/BF00509203. [DOI] [PubMed] [Google Scholar]
- 10.Tsien RY. Trends Neurosci. 1988;11:419–424. doi: 10.1016/0166-2236(88)90192-0. [DOI] [PubMed] [Google Scholar]
- 11.Palmer AE, Tsien RY. Nat Protoc. 2006;1:1057–1065. doi: 10.1038/nprot.2006.172. [DOI] [PubMed] [Google Scholar]
- 12.Mammano F, Bortolozzi M. In: Neuromethods. Verkhratsky A, Petersen OH, editors. Vol. 43. 2009. pp. 57–80. [Google Scholar]
- 13.Nolan EM, Lippard SJ. Acc Chem Res. 2009;42:193–203. doi: 10.1021/ar8001409. [DOI] [PMC free article] [PubMed] [Google Scholar]
- 14.Wong BA, Friedle S, Lippard SJ. Inorg Chem. 2009;48:7009–7011. doi: 10.1021/ic900990w. [DOI] [PMC free article] [PubMed] [Google Scholar]
- 15.Zhang X-a, Hayes D, Smith SJ, Friedle S, Lippard SJ. J Am Chem Soc. 2008;130:15788–15789. doi: 10.1021/ja807156b. [DOI] [PMC free article] [PubMed] [Google Scholar]
- 16.McQuade LE, Lippard SJ. Inorg Chem. 2010;49:9535–9545. doi: 10.1021/ic1012507. [DOI] [PubMed] [Google Scholar]
- 17.Tomat E, Lippard SJ. Inorg Chem. 2010;49:9113–9115. doi: 10.1021/ic101513a. [DOI] [PMC free article] [PubMed] [Google Scholar]
- 18.Gruenwedel DW. Inorg Chem. 1968;7:495–501. [Google Scholar]
- 19.Romary JK, Barger JD, Bunds JE. Inorg Chem. 1968;7:1142–1145. [Google Scholar]
- 20.Walkup GK, Burdette SC, Lippard SJ, Tsien RY. J Am Chem Soc. 2000;122:5644–5645. doi: 10.1021/ja010059l. [DOI] [PubMed] [Google Scholar]
- 21.Burdette SC, Walkup GK, Spingler B, Tsien RY, Lippard SJ. J Am Chem Soc. 2001;123:7831–7841. doi: 10.1021/ja010059l. [DOI] [PubMed] [Google Scholar]
- 22.Ghosh SK, Kim P, Zhang XA, Yun SH, Moore A, Lippard SJ, Medarova Z. Cancer Res. 2010;70:6119–6127. doi: 10.1158/0008-5472.CAN-10-1008. [DOI] [PMC free article] [PubMed] [Google Scholar]
- 23.Woodroofe CC, Masalha R, Barnes KR, Frederickson CJ, Lippard SJ. Chem Biol. 2004;11:1659–1666. doi: 10.1016/j.chembiol.2004.09.013. [DOI] [PubMed] [Google Scholar]
- 24.Fulmer GR, Miller AJM, Sherden NH, Gottlieb HE, Nudelman A, Stoltz BM, Bercaw JE, Goldberg KI. Organometallics. 2010;29:2176–2179. [Google Scholar]
- 25.Gans P, Sabatini A, Vacca A. Talanta. 1996;43:1739–1753. doi: 10.1016/0039-9140(96)01958-3. [DOI] [PubMed] [Google Scholar]
- 26.Sweeton FH, Mesmer RE, Baes CF. J Solution Chem. 1974;3:191–214. [Google Scholar]
- 27.Alderighi L, Gans P, Ienco A, Peters D, Sabatini A, Vacca A. Coord Chem Rev. 1999;184:311–318. [Google Scholar]
- 28.Thomas JA, Buchsbaum RN, Zimniak A, Racker E. Biochemistry. 1979;18:2210–2218. doi: 10.1021/bi00578a012. [DOI] [PubMed] [Google Scholar]
- 29.Li X, Higashikubo R, Taylor JS. Bioconjugate Chem. 2007;19:50–56. doi: 10.1021/bc070079y. [DOI] [PubMed] [Google Scholar]
- 30.Tsien RY. Nature. 1981;290:527–528. doi: 10.1038/290527a0. [DOI] [PubMed] [Google Scholar]
- 31.Dickinson BC, Peltier J, Stone D, Schaffer DV, Chang CJ. Nat Chem Biol. 2011 doi: 10.1038/nchembio.497. advance online publication. [DOI] [PMC free article] [PubMed] [Google Scholar]
- 32.Fox MA, Chanon M. Photoinduced Electron Transfer. Elsevier Science Publishers B. V.; New York: 1988. [Google Scholar]
- 33.Wong BA, Friedle S, Lippard SJ. J Am Chem Soc. 2009;131:7142–7152. doi: 10.1021/ja900980u. [DOI] [PMC free article] [PubMed] [Google Scholar]
- 34.Kowalczyk T, Lin Z, Voorhis TV. J Phys Chem A. 2010;114:10427–10434. doi: 10.1021/jp103153a. [DOI] [PubMed] [Google Scholar]
- 35.Lakowicz JR. Priciples of Fluorescence Spectroscopy. 2. Kluwer Academics/Plenum; New York: 1999. [Google Scholar]
- 36.Ge FY, Chen LG. J Fluoresc. 2008;18:741–747. doi: 10.1007/s10895-007-0305-y. [DOI] [PubMed] [Google Scholar]
- 37.Klonis N, Sawyer WH. J Fluoresc. 1996;6:147–157. doi: 10.1007/BF00732054. [DOI] [PubMed] [Google Scholar]
- 38.Goldsmith CR, Lippard SJ. Inorg Chem. 2006;45:6474–6478. doi: 10.1021/ic060378j. [DOI] [PubMed] [Google Scholar]
- 39.Sparano BA, Shahi SP, Koide K. Org Lett. 2004;6:1947–1949. doi: 10.1021/ol049537y. [DOI] [PubMed] [Google Scholar]
- 40.Connors KA. Binding constants : the measurement of molecular complex stability. J. Wiley & Sons; New York: 1987. [Google Scholar]
- 41.Hargrove AE, Zhong ZL, Sessler JL, Anslyn EV. New J Chem. 2010;34:348–354. doi: 10.1039/b9nj00498j. [DOI] [PMC free article] [PubMed] [Google Scholar]
- 42.Reichle RA, McCurdy KG, Hepler LG. Can J Chem. 1975;53:3841–3845. [Google Scholar]
- 43.For a given sensor concentration, the ratio of HLZn+ and LZn versus LZn2 decreases at higher concentrations of Zn2+. As a result, the fluorescence emission is expected to exhibit diminished pH dependence in the physiologically relevant range in the presence of excess zinc.
- 44.Haugland RP. Handbook of Fluorescent Probes and Research Products. 9. Molecular Probes, Inc; Eugene, OR: 2002. [Google Scholar]
- 45.Westerberg N, Thompson R, Cramer M, Fierke C, Frederickson C, Hershfinkel M, Bozym R. Fluorescence Sensors and Biosensors. null. CRC Press; 2005. pp. 351–376. [Google Scholar]
- 46.Yoe JH, Jones AL. Ind Eng Chem Anal Ed. 1944;16:111–115. [Google Scholar]
- 47.Job P. Ann Chim (Paris) 1928;9:113–203. [Google Scholar]
- 48.Momoki K, Sekino J, Sato H, Yamaguchi N. Anal Chem. 1969;41:1286–1299. [Google Scholar]
- 49.Chriswell CD, Schilt AA. Anal Chem. 1975;47:1623–1629. [Google Scholar]
- 50.Meyer AS, Ayres GH. J Am Chem Soc. 1957;79:49–53. [Google Scholar]
Associated Data
This section collects any data citations, data availability statements, or supplementary materials included in this article.


