Abstract
Biofluids are complex solutions consisting of small ions and large biopolymers such as DNA, proteins or proteoglycans. Biopolymers affect fluid properties but their effect on drop deposition has not been examined. Hyaluronic acid (HA), an important component in synovial fluid, was chosen as a model biopolymer, and examined using surface-enhanced Raman spectroscopy (SERS). Nanoliter volumes of HA solutions were dried onto a patterned SERS substrate and spectra were collected from the dried hyaluronic acid drops with a near-infrared Raman microscope. Characteristic hyaluronic acid bands were examined. Capillary viscometry measured properties of HA solutions and entanglement behavior was also modeled using scaling theory principles. Viscosity measurements were incorporated into models of suspended particle droplets to account for the effect of inter-chain attraction on droplet formation. Microscope images were used to evaluate shape of the dried drop. Relative drop thickness was estimated from concentric rings found at drop edges using established models of light interference by thin films. We found SERS spectra were sensitive not only to polymer conformation, but also to type of deposition (ring versus uniform), and the thickness of the resulting deposition. These data suggest an approach to elucidate the effects of biopolymers and dehydrated biofluids on SERS analysis.
Keywords: Surface-enhanced Raman, spectroscopy, Hyaluronic acid, Glycosaminoglycan, Polymer conformation, Drop deposition
INTRODUCTION
Drop deposition of biofluids is an analytical method that is garnering attention in biomedicine because it is a rapid, specific and simple method to obtain physical chemical information that may have diagnostic value. Drop deposition, also known as the “coffee ring” phenomenon, is based on the observation that a drop of solution will form a ring-like shape as the water evaporates.1–3 The evaporation process is influenced by drop composition and viscosity, evaporation conditions, and the surface chemistry of the substrate.4–6 The resulting drop is rich in information; the shape of the resulting droplet and distribution of chemical components may be used to identify impurities, quantify biomarkers, direct crystallization of small molecules, or gauge chemical affinity to an enzyme. Drop deposition is performed on a flat solid surface, such as mica, fused silica or coated stainless steel. This format is compatible with analyses using a variety of optical microscopy or spectroscopic methods.7–9 Surface-enhanced Raman spectroscopy (SERS), is an attractive analytical method to couple with drop deposition because Raman signal is enhanced 102–106 fold and detailed chemical information is obtained from SERS spectra.10–12.
Thickness of polymer films and polymer conformations play important roles in determining SERS band intensities.13–16 We hypothesized that drop thickness and polymer conformation would affect SERS band intensities similar to the effects observed using thin films. Microscope images of dried drops were used to estimate relative drop thickness. Dark areas in microscope images were areas where light was destructively interfered by a polymer drop. Relative drop thickness was estimated using the following relationship:
| (Equation 1) |
where t is the change in drop thickness, λ is the wavelength, n1 is the index of refraction for air (n1=1) and n2 is the index of refraction of the drop (n2~1.4).15
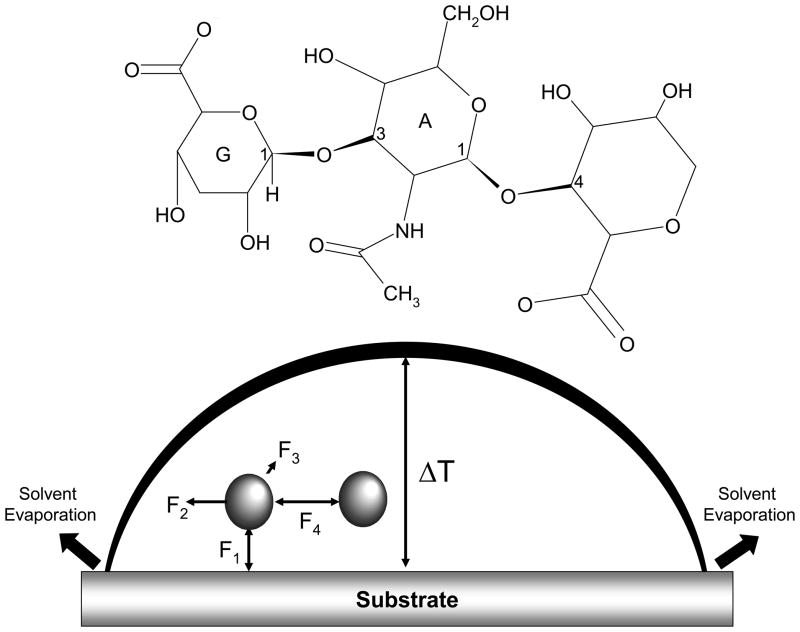
Most biofluids contain biopolymers, such as high molecular weight proteins (nucleoproteins, glycoproteins) or glycosaminoglycans. Hyaluronic acid (HA) is an unsulfated glycosaminoglycan, and is considered a polyelectrolyte polymer because carboxyl groups are ionized at physiological pH. The structure of HA is shown in Figure 1a. Although HA can be found throughout the body, it is most concentrated in vitreous humor and synovial fluid.17 HA is biologically active in wound healing, treating inflammatory joint diseases, and may act as a signaling molecule.18–21 Hyaluronic acid is also used in the preparation of injectable gels for use as tissue engineering scaffolds or as a drug delivery systems.22, 23
Figure 1.
The structure of hyaluronic acid (Figure 1a) and model of drop formation (Figure 1b). Hyaluronic acid is a polysaccharide composed of two monosaccharides: D-glucuronic acid (G in Figure 1a) and N-acetyl-D-glucosamine (A in Figure 1a). Drop formation was modeled on earlier models using particles in suspension. Four forces acted on a molecule in the drop: particle-substrate attraction (F1 in Figure 1b), outward convective flow (F2 in Figure 1b), temperature gradient (F3 in Figure 1b) and intermolecular attraction (F4 in Figure 1b). In Figure 1b, ΔT is the difference in drop temperature.
Biopolymers affect bulk properties, such as viscosity, of biofluids which are known to influence drop deposition. We developed a theoretical model for biofluid drop formation using earlier models for drops of suspended particles. We incorporated principles of a model developed to describe ring formation of suspended particles.5 As seen in Figure 1b, there are four primary forces that act upon a particle in a drying drop. For suspended particles, intermolecular attraction (F4 in Figure 1b) is minimal and a simple prediction of ring formation can be made: when F1>F2 then there is a uniform deposition and when F1<F2 then there is ring formation. Biopolymers strongly interact with other polymer molecules, ions and water in solution. Thus the effects of intermolecular interaction on drop formation were considered in the model of polymer drop formation. Viscosity measurements were used to incorporate the effect of intermolecular attraction on drop formation. Entanglement behavior was modeled using scaling theory principles.
Intermolecular interactions between HA chains and electrostatic interactions with solvent are extensive and are dominated by carboxyl functional groups on D-glucuronic acid monomers. These interactions are reflected in the sensitivity of HA viscosity to pH, salt, molecules such as sucrose or proteins, and solution temperature.24–27 Viscosity measurements of polyelectrolytes, such as HA, are measured in salt solutions to shield electrostatic repulsion of ionized carboxyl groups. Equations 2–4 were used to calculate the relative, specific, and reduced viscosity of HA:
| (Equation 2) |
| (Equation 3) |
| (Equation 4) |
Where η0 is the solvent viscosity, η denotes viscosity (ηred units of ml/mg, ηrel and ηsp are dimensionless). Intrinsic viscosity, [η] units of ml/mg, is extrapolated from a plot of ηred vs. HA concentration using the 2-term Huggins equation28:
| (Equation 5) |
In a solution with added counterion, the rheology of a polyelectrolyte is similar to that of a neutral polymer in good solvent.29 Scaling theory of polyelectrolyte solutions describes the behavior of polyelectrolytes in a no-salt solution and in a salt solution where electrostatic repulsion is shielded by counterions. Scaling theory describes three concentration domains of polyelectrolyte chains: dilute, semidilute and concentrated. Changes in intermolecular attraction of the polymer with relation to other coils and the solvent characterize each concentration domain. For dilute HA solutions, specific viscosity scales approximately linearly with concentration, reflecting little inter-chain attraction. The scaling theory is especially useful in the semidilute region, where there are large changes associated with concentration.30 In the semidilute regime there are two intervals, semidilute unentangled and semidilute entangled. In salt solutions, scaling theory predicts that the specific viscosity of polyelectrolytes is dependent on concentration in the following proportions:
| (Equation 6) |
| (Equation 7) |
Examination of hyaluronic acid in 0.1 M NaCl and phosphate buffered saline showed a concentration dependence of specific viscosity within predictions of scaling theory.27 In this study we used viscometry measurements to verify inter-chain attraction between HA molecules, and incorporated the viscosity data into our model of drop formation.
Raman spectroscopy has been used to examine the structure and conformation of hyaluronic acid and other glycosaminoglycans (GAG’s) in solution. HA bands at 899 cm−1, 949 cm−1 and 1130 cm−1 are established markers of HA conformation.31 Raman spectra of a 4% HA solution (~40 mg/ml) did not change in the pH range of 6–8, where significant changes in HA viscosity and birefringence were observed, indicating the presence of inter-chain long-range interactions.32, 33 We demonstrated that SERS could detect HA drops at clinically relevant concentrations (0.125–3 mg/ml) that were undetected when spotted onto fused silica or non-enhancing gold surfaces. 34, 35 Early experiments indicated that both drop shape and SERS spectra taken of the droplet were dependent upon HA concentration. 34
In this study, we examined the combined effects of drop thickness and shape, and polymer conformation on SERS spectra of hyaluronic acid drops dried onto a SERS-active surface. Protein impurities that are known to induce aggregation of HA chains can be easily detected by SERS in binary protein-HA solutions. The ring breathing band at ~1001 cm−1 was used as a marker for synovial fluid protein content because there are no HA bands at that Raman shift. We found SERS band intensities of hyaluronic acid dried drops are affected by drop properties and HA conformation.
MATERIALS AND METHODS
Raman spectroscopy
A Nikon E600 epi-illumination microscope was modified for Raman spectroscopy (Nikon, Melville, NY, USA). A Kaiser Invictus line-focused laser operating at 785 nm was used as an excitation source (Kaiser Optical Systems, Ann Arbor, MI, USA). The laser line was focused onto the sample using a 20X/0.75 Nikon S Fluar objective. A 0.3 neutral density filter was used to attenuate the laser intensity to 8–11 mW. Raman signal was collected for 3–5 minutes. Raman scattered light was collected by the 20X/0.75 S Fluor microscope objective, directed to a spectrograph (Kaiser HoloSpec f1.8), and focused onto a 1024×128 near-infrared optimized CCD camera (Andor Technologies, Belfast, Ireland). Because of noise in the system and the spectral resolution of 4 cm−1, band positions were reproducible to ± 1–2 cm−1. The holographic grating used in the spectrometer provided a spectral window of 400–1800 cm−1. A non-confocal geometry was used to maximize collection efficiency. White-light microscope images were collected using 2X/0.06NA Plan UW, 4X/0.02NA Plan Apo and 10X/0.45NA Super Fluor microscope objectives (Nikon, Melville, NY, USA). Gold coated Klarite SERS substrates (D3 Technologies Ltd, Southamptom, UK) were used as received. No laser-induced damage was observed on the substrates or the dried droplets.
HA solution preparation and droplet deposition
Sodium hyaluronate manufactured from bacterial fermentation using Strep. A. bacteria were used without further purification (1.4×10⁶ Da for high MW, and 2.3×10⁵ Da for low MW) (Lifecore Inc., Chaska, MN, USA). Solvents and reagents were analytical grade. The molecular weight of the 1.4×10⁶ Da hyaluronic acid was verified as 1.5 × 10⁶ in 0.1 M NaCl using the Mark-Houwink relationship [η]=KMa, where [η]=2.52 ml/mg a=0.79 and K=0.0336 ml/g at 25° in 0.1 M NaCl.27 Stock solutions of 6 mg/ml or 10 mg/ml were prepared by dissolving sodium hyaluronate in purified water. Stock solutions were stirred overnight in ambient laboratory conditions to ensure complete solubilization. Serial dilutions were prepared volumetrically from the stock solutions. Dilutions were prepared at concentrations of 0.125, 0.25, 0.5, 1, 1.5, 2, 3, 4, and 5 mg/ml and stored at 0°C until examination. Additional HA solutions were prepared in 0.1 M or 0.2 M NaCl using the protocol described above to examine HA entanglement in a salt solution. HA solutions were evaluated using a capillary viscometer and the drop deposition/SERS protocol. For the drop deposition procedure, a 0.2–2 μl Eagle pipette (World Precision Instruments, Sarasota, FL, USA) was used to deposit 0.2 μl of HA solutions onto the substrate. Drops were dried in ambient laboratory conditions overnight prior to collecting spectra. Approximately 8 drops were deposited onto a SERS substrate in random order to reduce any effects of inter-chip variability. For ring-shaped drops, transects were collected within the ring. For uniform depositions, transects were collected at various locations in the drop.
Capillary viscometry
Cannon-Ubbeholde semi-micro ultra-low charge capillary viscometers were used to measure viscosity of HA solutions in concentrations ranging from 0.125–4 mg/ml. Three capillary viscometers were used: 1) size 50, approximate viscometric constant: 0.004 centiStokes/sec (cSt/s); 2) size 75, approximate viscometric constant: 0.008 (cSt/s); and 3) size 200, approximate viscometric constant: 0.1 cSt/s). The efflux time for deionized water, 0.1M NaCl, and 0.2 M NaCl in the size 75 viscometer was 151s, 153s, and 161s respectively. The overlap concentration (c*, in mg/ml) and entanglement concentration (ce, in mg/ml) was calculated from a log-log plot of specific viscosity versus HA concentration, as seen in Figure 3.
Figure 3.
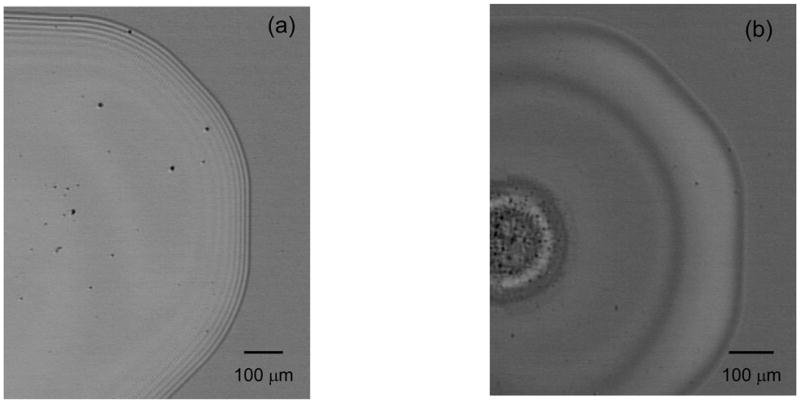
Microscope images of aqueous HA dried drops at (a) high and (b) low HA concentrations. At high concentrations, concentric rings formed on the outer edge of the drop and the HA dried as a uniform deposition. At low concentrations, HA dried as a ring deposit and no concentric rings were observed. Destructive interference of light resulted in dark bands in microscope images.
SERS data analysis
Raman transects were imported to Matlab (v 6.1, The Math Works, Natick, MA). Spectra were corrected for curvature, dark current and variations in the CCD quantum efficiency. Corrected spectra were imported to GRAMS/AI© (ThermoGalactic). In GRAMS/AI©, background signal from the SERS substrate (if applicable) was subtracted and a baseline correction was performed using a user-defined, multi-point polynomial. Baseline corrected spectra were intensity normalized to the 1130 cm−1 band. HA peaks were fit to mixed Lorentzian/Gaussian bands using the GRAMS/AI© curvefit routine. The resulting curve-fit was accepted if the R2 was > 0.999 and the calculation did not produce any negative subtraction artifacts.
Estimation of drop profile
White-light microscope images were collected on the Raman microscope using 2X/0.06NA Plan UW, 4X/0.02NA Plan Apo and 10X/0.45NA Super Fluor microscope objectives (Nikon, Melville, NY, USA). Images were imported into Matlab where the position of the drop edge, drop center, and the middle of each interference band was estimated. The pixel positions were plotted in Excel and converted to microns using a 25 μm bar target standard. Thickness was estimated using Equation 1, and plotted against position.
RESULTS
Viscosity measurements
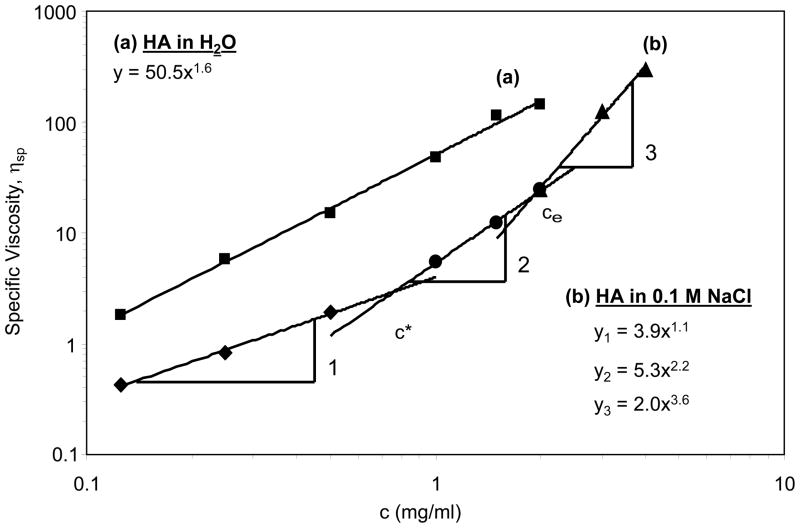
A summary of viscosity measurements is presented in Table 1. Values for intrinsic viscosity [η], and the Huggins’ constant ‘k’, for low and high MW HA in 0.1 M NaCl and 0.2 M NaCl solutions are included. For high and low MW HA, intrinsic viscosity was within reported ranges, and decreased with increasing salt concentration.26 Figure 2 shows the dependence of specific viscosity on high molecular weight HA concentration in water (Figure 2a) or in salt solution (Figure 2b).
Table 1.
Intrinsic viscosity [η], overlap concentration (c*), entanglement concentration (ce), and the Huggins constant (k′) were calculated from viscosity measurements of high and low MW HA in a salt solution. The overlap and entanglement concentrations were calculated from a log-log plot of specific viscosity versus HA concentration. These data show that the HA used in this study has rheological properties consistent with other studies of bacterial source HA.
| High MW HA (1.387 ×10⁶ Da) | Low MW HA (2.344 ×10⁵ Da) | |||
|---|---|---|---|---|
| Parameter | 0.1 M NaCl | 0.2 M NaCl | 0.1 M NaCl | 0.2 M NaCl |
| [η] (ml/mg) | 2.5 | 2.03 | 0.39 | 0.35 |
| c* (mg/ml) | 0.76 | 0.74 | N/A | N/A |
| c*[η] | 1.9 | 1.5 | N/A | N/A |
| k′ | 0.44 | 0.59 | 0.44 | 0.62 |
| ce (mg/ml) | 1.9 | 2.8 | N/A | N/A |
Figure 2.
Specific viscosity of hyaluronic acid in water (Figure 2a) and 0.1 M NaCl (Figure 2b). Specific viscosity of HA in water scales consistently with concentration, the scaling factor of 1.6 indicates that HA molecules are strongly interacting even at low concentrations. Specific viscosity of HA in 0.1 M NaCl showed three distinct concentration regimes. In the dilute regime (region 1 in Figure 2b) specific viscosity scales linearly with HA concentration. In the semidilute unentangled regime (region 2 in Figure 2b) HA chains overlap and specific viscosity scales to a power of 2.2 with HA concentration. In the semidilute entangled regime, labeled 3 in Figure 2b, HA chains are entangled and specific viscosity scales to a power of 3.6 with HA concentration. Calculation of overlap and entanglement concentrations was performed using scaling theory principles. The concentration where the regions overlapped marked the overlap or entanglement concentrations. The R2 for each of the calculated trendlines was >0.99.
Microscope images of dried droplets
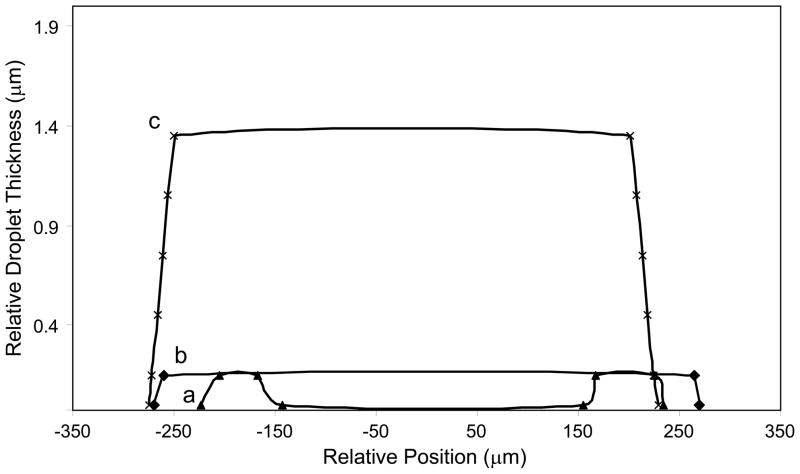
Figure 3 shows white-light images of 5 mg/ml (Figure 3a) and 0.25 mg/ml (Figure 3b) HA in H2O drop dried on the SERS substrate. Ring deposition versus uniform deposition was dependent on HA concentration. Figure 3a shows a uniform deposition with concentric rings around the droplet edge, Figure 3b shows a ring deposition and no concentric rings. Concentric rings around the droplet edge are evident in microscope images of concentrated (>1 mg/ml) HA solutions are dried on the SERS substrate. The position and number of concentric rings relative to the drop edge provides an indication of thickness. More concentric rings indicate a thicker HA deposition. Figure 4 shows the estimated drop thickness when dark rings are modeled as thin film interference patterns. At low HA concentrations (0.125–1 mg/ml), concentric rings were not observed and the shape of the drop changed from a ring (Figure 4a) to a uniform deposition (Figure 4b). The uniform deposition shape is maintained but the thickness of the deposition increases when more concentrated (>1 mg/ml) HA solutions are deposited onto the SERS surface (Figure 4c).
Figure 4.
Relative drop thickness and drop profiles were calculated from the interference patterns. At low aqueous HA drops, a ring-shaped drop is formed (Figure 4a). At ~ 1mg/ml, the drop dried as a uniform deposition (Figure 4b). Highly concentrated HA solutions also dried as a uniform deposition, but the relative drop thickness increased (Figure 4c)
SERS of HA dried droplets
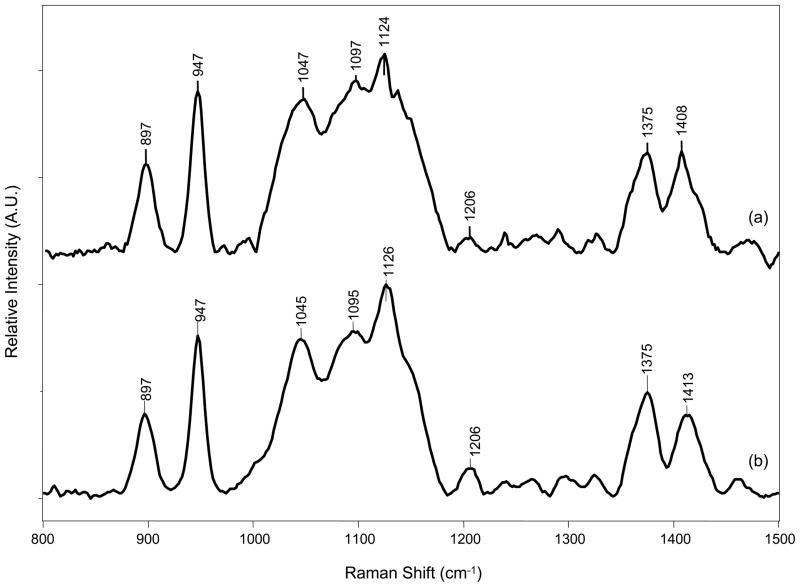
Assignment of the major bands of HA were based on previous Raman reports of HA and are listed in Table 2.31, 33 The bands at 899 cm−1, 945 cm−1, 1130 cm−1 and 1410 cm−1 were used to examine HA conformation in previous vibrational spectroscopic studies of glycosaminoglycans.31, 33, 36, 37 Figure 5 shows a representative spectrum of high molecular weight HA at 1.5 mg/ml in water and 1.5 mg/ml in 0.2 M NaCl, after deposition onto the SERS substrate. HA does have a band in the amide I region (1590–1700 cm−1), but it is weak and broad in Raman spectra. Thus, we focused our analysis on the 800–1500 cm−1 region. HA Raman spectra in water and salt solution are similar to a spectrum of solid state HA. These observations are consistent with Raman spectra of other glycosaminoglycans.31, 33
Table 2.
Raman bands for hyaluronic acid observed for solid HA. Band assignments are based on previous Raman studies of HA.31, 33, 39 The band positions are approximate within ± 2 cm−1. The 899 cm−1 and 945 cm−1 bands were used as markers of skeletal conformation.
| Raman Shift (cm−1) | Band Assignment |
|---|---|
| 899 | C1-H deformation, β-linkage |
| 945 | Skeletal C-O-C linkage stretch |
| ~1045 | C-O, C-C |
| ~1090 | C-OH bend, acetyl group |
| ~1130 | C4-OH bend and C4-H bend |
| ~1150 | C-O, C-C, Oxygen bridge |
| ~1210 | CH2 twist |
| 1330 | CH bend, Amide III |
| 1370 | COO− symmetric stretch CH3 deformation |
| ~1410 | COO− symmetric stretch CH3 bend |
| ~1460 | CH2 bend |
Figure 5.
SERS spectra of a) 5 mg/ml high MW HA in H2O and b) 4 mg/ml high MW HA in NaCl.
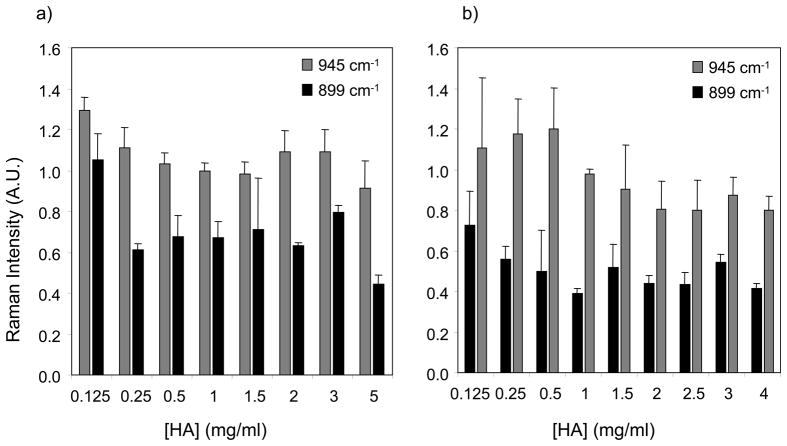
Figure 6 shows the effect of HA conformation, drop type, and drop thickness on SERS band intensities at 899 cm−1 and 945 cm−1. Figure 6a shows the effect of outward convective flow and substrate-HA attraction on SERS band intensities of HA in H2O. Viscosity measurements indicate that a constant inter-chain interaction of HA in H2O in the concentration range 0.125–2 mg/ml. Figure 6b shows band intensities for HA in salt solution, and variable inter-chain interaction was considered in addition to outward convective flow and substrate-HA attraction.
Figure 6.
SERS band intensities at 899 cm−1 and 945 cm−1 are dependent on HA concentration, HA conformation and relative drop thickness. In dried drops of aqueous HA (Figure 6a) changes in SERS band intensities correlated roughly with the transition from a ring deposit to a uniform deposition. At low aqueous HA concentrations, drops dried as a ring and highly localized HA in a ring. As the initial HA concentration increased, HA drops dried as a uniform deposition. In dried drops of HA in 0.1 M NaCl (Figure 6b), changes in the SERS intensity at 945 cm−1 roughly correlated to the transition from dilute to overlapped to entangled solution as seen in viscosity measurements. In aqueous HA and HA in salt solution, the 945 cm−1 SERS intensity appeared to be more sensitive to the effects of HA conformation and concentration.
DISCUSSION
Viscosity measurements
Viscosity of high MW and low MW HA was measured using capillary viscometry. Specific viscosity of low MW scaled linearly with HA concentration from 0.125–4 mg/ml (data not shown). Low MW HA was not examined using the drop deposition/SERS method because viscometry measurements indicated no significant inter-chain attraction (ηsp~c0.98). High MW HA was examined using the drop deposition/SERS method because viscosity measurements indicated significant inter-chain attraction in water and a variable attraction in salt. Specific viscosity of HA in H2O scaled with concentration to a power of 1.6 (ηsp=50.5c1.6) as seen in Figure 2a. This power relationship was constant from 0.125–1.5 mg/ml and indicated that HA chains strongly interact in water, even at low concentrations. We observed a large increase in specific viscosity with concentration of HA in H2O, which is reflected in a large value of the slope (50.5).
As seen in Figure 2b, there are three distinct specific viscosity regions for the high MW HA salt solutions. These regions have a different scaling of specific viscosity with concentration, and correspond to dilute, semidilute unentangled and semidilute entangled regimes. At low HA concentrations specific viscosity scaled approximately linearly (ηsp~c1.1), indicating the dilute regime where HA chains did not interact and were not overlapped. The overlap concentration (c*) marked the end of the dilute regime and was where HA chains began to interact. As seen in Table 1, the overlap concentration was 0.74–0.76 mg/ml for high MW HA in 0.2 M and 0.1 M NaCl. At higher HA concentrations specific viscosity scaled to a higher power (ηsp~c2.2), indicating overlapping HA chains. The entanglement concentration (ce) marked the onset of the semidilute entangled regime and was found to be 1.9–2.8 mg/ml in 0.1 M and 0.2 M NaCl. Specific viscosity scaled with concentration to a higher extent (ηsp~c3.6) above chain entanglement, indicating significant inter-chain HA attraction.
Modeling HA drop formation
Previous models of drop formation of suspended particles on a solid flat surface assume four main forces on a particle during solvent evaporation.5 Briefly, a uniform deposition is expected when the substrate-HA attraction (F1 in Figure 1) is greater than the outward convective flow (F2 in Figure 1) toward the contact point of the droplet. A ring deposition is expected when the outward convective flow is greater than the substrate-HA attraction. However, this model assumed negligible intermolecular attraction (F4 in Figure 1). Our model of drop formation included the effect of intermolecular attraction because viscosity measurements indicated significant intermolecular attraction for HA in H2O and HA in salt solution.
We considered only substrate-HA attraction and outward convective flow in the model of HA in H2O drops. Scaling of specific viscosity of HA in H2O (ηsp~50.5c1.6) indicated constant intermolecular interactions, and we assumed a constant F4. Specific viscosity increased significantly with HA concentration, as indicated by the large constant (ηsp~50.5c1.6). We also assumed constant substrate-HA attraction (F1). From 0.125–0.5 mg/ml we observed ring deposition, indicating the outward convective flow was greater than the substrate-HA attraction. At concentrations above 1 mg/ml, specific viscosity increased to the point where outward convective flow became weaker than substrate-HA attraction. At these higher concentrations HA drops dried with uniform deposition, shown in Figure 3a, and ring deposition shown in Figure 3b.
Dark lines found in dried drops were examined using principles of destructive interference by thin films. Relative drop thickness and drop profiles were estimated using this technique. Figure 4 shows the profiles and relative thickness of HA in water at 0.25 mg/ml, 1 mg/ml and 5 mg/ml. Relative thickness of the drop is ~150 nm at 0.25 and 1 mg/ml, and ~1.4 μm at 5 mg/ml. Estimation of relative drop thickness provided a basis to compare the collection efficiency and efficiency of surface plasmon interaction with HA. SERS spectra of polymer thin films are affected by film thickness and polymer conformation. 13, 14, 16 SERS bands are more intense at thinner films, owing to a greater interaction of surface plasmons with the film. We propose that, in polymer drops, SERS band intensities are also subject to the effects of drop thickness and polymer conformation.
In addition to increased collection efficiency at low HA concentrations (because of a thinner deposition) there was a preconcentration effect with ring deposition versus uniform deposition. There was also a greater apparent concentration in the ring versus a uniform deposition. We used our estimates of ring profiles from interference patterns to calculate a concentration density (mg/ml/μm2) and identified a 4-fold increase in concentration density in the 0.25 mg/ml ring compared to the 1 mg/ml uniform deposition. There was, as expected, a 5-fold increase in concentration density of the 5 mg/ml uniform deposition compared to the 1 mg/ml uniform deposition. Effects of ring versus uniform deposition and preconcentration were observed in SERS spectra from aqueous HA dried drops, especially in the band intensity at 945 cm−1.
Viscosity measurements of HA in salt solutions indicated variable intermolecular attraction. Intermolecular attraction (F4), outward convective flow (F2), and substrate-HA attraction (F1) were considered in the model of HA in salt drops. Ring formations and concentric ring formations were observed in dried drops of HA in salt solution. However, sodium chloride crystals precipitated throughout the dried drops and prohibited estimation of drop properties using interference patterns. We expect that future studies to verify our method of estimating drop properties using interference patterns, such as the use of atomic force microscopy, will account for the presence of salt crystals and allow drop profiles to be obtained.38
SERS of HA dried drops
We focused our analyses on the “fingerprint” region (400–1800 cm−1) because it is a more direct measurement of HA conformation. In this spectral range, HA is weakly scattering in solution and previous vibrational spectroscopy studies of HA in thin films or solutions have been limited to high (>10 mg/ml or 1% w/v) HA concentrations.31, 33, 39–41 SERS spectra of HA in salt (Figure 5a) and aqueous HA (Figure 5b) dried onto the SERS surface showed little variation. Since most synovial fluid proteins have at least one phenylalanine ring, the ring breathing mode at ~1001 cm−1 was used as a marker for protein content. There was no detectable protein signal, as indicated by no band at ~1001 cm−1. The C1-H deformation band occurs at ~ 899 cm-1 when the C1 hydrogen is axial and at ~ 845 cm−1 when the C1 hydrogen is equatorial. Symmetric C-O-C linkage vibration occurs at ~945 cm−1 for GAG’s with β-type orα-type linkages. The 899 cm−1 and 945 cm−1 SERS bands were examined because they are the most insightful to HA conformation and were the best resolved bands in SERS spectra of HA.
SERS band intensities at 899 cm−1 and 945 cm−1 were affected by efficiency of the SERS enhancement processes, HA concentration and HA conformation. Drop profiles from microscope images were used to estimate the relative concentration density of HA in a drop or uniform deposition. Viscosity measurements were used to verify HA conformation and model the effect of intermolecular attraction on drop formation. SERS intensities of the 899 cm−1 and 945 cm−1 bands were examined in the context of drop properties and HA conformation. The 945 cm−1 SERS band appeared to be more sensitive these effects than the 899 cm−1 SERS band. As seen in Figure 6, there are differences in SERS band intensities when aqueous HA (Figure 6a) or HA in salt solution (Figure 6b) is deposited onto a SERS substrate.
Dried drops of aqueous HA solutions formed a ring at low HA concentrations and a uniform deposition at higher HA concentrations. Localization of HA into a ring had a preconcentration effect, and resulted in more intense SERS bands (Figure 6a). At higher HA concentrations (>0.5 mg/ml, uniform deposition), the 945 cm−1 SERS intensity slightly increased, indicating contributions from unenhanced Raman as the relative thickness increases. SERS band intensities at 899 cm−1 and 945 cm−1 varied with HA concentration when HA salt solutions were deposited onto the SERS substrate. Changes in the 945 cm−1 SERS band intensity, seen in Figure 6b, roughly correlated to transitions from a dilute to semidilute unentangled solution at 0.76 mg/ml and from a semidilute unentangled to a semidilute entangled solution at 1.9–2.8 mg/ml. The SERS 945 cm−1 intensity increased with HA concentration in the dilute regime (0.125–0.5 mg/ml). After 0.5 mg/ml, the SERS 945 cm−1 intensity decreased until ~ 2 mg/ml. At HA concentrations greater than 2 mg/ml, the SERS 945 cm−1 intensity remained relatively constant. SERS data indicate that, in salt solutions, the HA C-O-C backbone is stretched on the SERS surface at dilute concentrations, as reflected by a higher intensity of the SERS 945 cm−1 band. We observed a “dilution effect” in the SERS 945 cm−1 band intensity, where the band intensity decreased at concentrations above the overlap concentration. 13, 14 The transition observed in the SERS 945 cm−1 band intensity correlated to the transition from an elongated chain at dilute concentrations to collapsed chains that are overlapping. A “dilution effect” was not observed for the SERS 899 cm−1 band intensity. As seen in Figure 6b, the SERS 899 cm−1 intensity decreased from 0.125–1 mg/ml and remained constant thereafter. SERS data indicate that the 899 cm−1 band is sensitive to conformation changes when the HA chain is elongated at dilute concentrations while at concentrations higher than the overlap concentration there were no changes observed in the 899 cm−1 SERS intensity.
CONCLUSIONS
Biopolymers are ubiquitous in biofluids and in order to develop a more accurate model of biofluid drop formation, we needed to understand the effect of biopolymers in the mechanics of drop formation and subsequent collection of SERS spectra from dried drops. We examined the effect of biopolymers on drop formation using hyaluronic acid (HA) as a model biopolymer. Surface-enhanced Raman spectroscopy (SERS) was used to examine chemical structure of HA solutions dried onto a SERS-active substrate as a ring deposition or as a uniform deposition. Viscosity measurements were used in previously established models of drop formation to account for intermolecular interaction of HA chains. Microscope images were used to estimate relative drop thickness and drop profile.
We found that the complex viscoelastic properties of HA affected drop formation and SERS spectra collected from drops. Two models of drop formation were developed for HA. In the first model, where aqueous HA is dried onto the SERS substrate, we found that solution viscosity was the dominant force in the type of deposition which was reflected in the SERS band intensity at 945 cm−1. In the second model, where HA in salt solutions were deposited onto the SERS substrate, we found that the viscoelastic properties of HA was the dominant force in the SERS band intensity at 945 cm−1.
Combined data from viscosity measurements with microscope images provided a more accurate model of HA drop formation. Future studies include using SERS combined with drop deposition of biofluids which will incorporate the effects of biopolymer entanglement and substrate-polymer interactions.
Acknowledgments
The authors acknowledge funding from National Institutes of Health (Grant # R01 AR052010), and thank Kaiser Optical Systems for instrument support. The authors thank Dr. Gurjit S. Mandair for editorial comments and Mr. Francis Esmonde-White for help with measuring interference patterns and editorial comments.
References
- 1.Deegan RD, Bakajin O, Dupont TF, Huber G, Nagel SR, Witten TA. Nature. 1997;389(6653):827. doi: 10.1103/physreve.62.756. [DOI] [PubMed] [Google Scholar]
- 2.Deegan RD. Phys Rev E. 2000;61(1):475. doi: 10.1103/physreve.61.475. [DOI] [PubMed] [Google Scholar]
- 3.Deegan RD, Bakajin O, Dupont TF, Huber G, Nagel SR, Witten TA. Phys Rev E. 2000;62(1):756. doi: 10.1103/physreve.62.756. [DOI] [PubMed] [Google Scholar]
- 4.Sommer AP. Cryst Growth Des. 2007 [Google Scholar]
- 5.Sommer AP, Rozlosnik N. Cryst Growth Des. 2005;5(2):551. [Google Scholar]
- 6.Tadashi K, Eisuke N, Tatsuya Y, Masao D. Phys Rev E (Statistical, Nonlinear, and Soft Matter Physics) 2006;73(1):011601. doi: 10.1103/PhysRevE.73.011601. [DOI] [PubMed] [Google Scholar]
- 7.Yakhno TA, Yakhno VG, Sanin AG, Sanina OA, Pelyushenko AS, Egorova NA, Terentiev IG, Smetanina SV, Korochkina OV, Yashukova EV. Engineering in Medicine and Biology Magazine. IEEE. 2005;24(2):96. doi: 10.1109/memb.2005.1411354. [DOI] [PubMed] [Google Scholar]
- 8.Zhang D, Mrozek MF, Xie Y, Ben-Amotz D. Appl Spectrosc. 2004;58(8):929. doi: 10.1366/0003702041655430. [DOI] [PubMed] [Google Scholar]
- 9.Filik J, Stone N. Analyst. 2007;132:544. doi: 10.1039/b701541k. [DOI] [PubMed] [Google Scholar]
- 10.Andreas O. J Raman Spectrosc. 2005;36(6–7):497. [Google Scholar]
- 11.Haynes CL, McFarland AD, Van Duyne RP. Anal Chem. 2005;77:338A. [Google Scholar]
- 12.Netti C, Lincoln JR. Microscopy and Analysis. 2005;19(6):9. [Google Scholar]
- 13.Xue G. Polymer Bulletin. 1994;33:229. [Google Scholar]
- 14.Xue G, Lu Y, Gao J. Polymer. 1994;35(14):3127. [Google Scholar]
- 15.Tadmor R, Chen N, Israelachvili JN. J Biomed Mat Res. 2002;61(4):514. doi: 10.1002/jbm.10215. [DOI] [PubMed] [Google Scholar]
- 16.Baibarac M, Cochet M, Lapkowski M, Mihut L, Lefrant S, Baltog I. Synthetic Metals. 1998;96(1):63. [Google Scholar]
- 17.Kogan G, Šoltés L, Stern R, Gemeiner P. Biotechnology Letters. 2007;V29(1):17. doi: 10.1007/s10529-006-9219-z. [DOI] [PubMed] [Google Scholar]
- 18.Goldberg VM, Buckwalter JA. Osteoarthritis Cartilage. 2005;13(3):216. doi: 10.1016/j.joca.2004.11.010. [DOI] [PubMed] [Google Scholar]
- 19.Pavelka K, Forejtova S, Olejarova M, Gatterova J, Senolt L, Spacek P, Braun M, Hulejova M, Stovickova J, Pavelkova A. Osteoarthritis Cartilage. 2004;12(4):277. doi: 10.1016/j.joca.2004.01.001. [DOI] [PubMed] [Google Scholar]
- 20.Praest BM, Greiling H, Kock R. Clinica Chimica Acta. 2003;266:117. doi: 10.1016/s0009-8981(97)00122-8. [DOI] [PubMed] [Google Scholar]
- 21.Weindl G, Schaller M, Schafer-Korting M, Korting HC. Skin Pharmacology and Physiology. 2004;17:207. doi: 10.1159/000080213. [DOI] [PubMed] [Google Scholar]
- 22.Gutowska A, Jeong B, Jasionowski M. The Anatomical Record. 2001;263(4):342. doi: 10.1002/ar.1115. [DOI] [PubMed] [Google Scholar]
- 23.Mori M, Yamaguchi M, Sumitomo S, Takai Y. Acta Histochemica et Cytochemica. 2004;37(1):1. [Google Scholar]
- 24.Fouissac E, Milas M, Rinaudo M. Macromolec. 1993;26:6945. [Google Scholar]
- 25.Kobayashi Y, Okamoto A, Nishinari K. Biorheology. 1994;31(3):235. doi: 10.3233/bir-1994-31302. [DOI] [PubMed] [Google Scholar]
- 26.Mo Y, Takaya T, Nishinari K, Kubota K, Okamoto A. Biopolymers. 1999;50(1):23. [Google Scholar]
- 27.Krause WE, Bellomo EG, Colby RH. Biomacromolec. 2001;2(1):65. doi: 10.1021/bm0055798. [DOI] [PubMed] [Google Scholar]
- 28.Cowman MK, Matsuoka S. Carbohydr Res. 2005;340(5):791. doi: 10.1016/j.carres.2005.01.022. [DOI] [PubMed] [Google Scholar]
- 29.Dobrynin AV, Colby RH, Rubinstein M. Macromolec. 1995;28(6):1859. [Google Scholar]
- 30.Doi M, Edwards SF. The Theory of Polymer Dynamics. Oxford University Press; Oxford: 1986. [Google Scholar]
- 31.Bansil R, Yannas IV, Stanley HE. Biochimica et Biophysica Acta. 1978;541:535. doi: 10.1016/0304-4165(78)90163-0. [DOI] [PubMed] [Google Scholar]
- 32.Barrett TW, Harrington RE. Biopolymers. 1977;16(10):2167. doi: 10.1002/bip.1977.360161007. [DOI] [PubMed] [Google Scholar]
- 33.Barrett TW, Peticolas WL. J Raman Spectrosc. 1979;8(1):35. [Google Scholar]
- 34.Dehring KA, Mandair GS, Roessler BJ, Morris MD. SERS Detection of Hyaluronic Acid: A Potential Biomarker for Osteoarthritis. In: Kneipp K, Aroca R, Kneipp H, Wentrup-Byrne E, editors. New Approaches in Biomedical Spectroscopy. American Chemical Society; Washington D.C.: 2006. p. 123. [Google Scholar]
- 35.Mandair GS, Dehring KA, Roessler BJ, Morris MD. Biomedical Vibrational Spectroscopy III: Advances in Research and Industry. SPIE; San Jose, CA, USA: 2006. Detection of potential osteoarthritis biomarkers using surface enhanced Raman spectroscopy in the near-infrared; p. 60930H. [Google Scholar]
- 36.Cael JJ, Isaac DH, Blackwell J, Koenig JL, Atkins EDT, Sheehan JK. Carbohydr Res. 1976;50:169. doi: 10.1016/s0008-6215(00)83848-3. [DOI] [PubMed] [Google Scholar]
- 37.Quinn FR, Bettelheim FA. Biochimica et Biophysica Acta. 1963;69:544. doi: 10.1016/0006-3002(63)91306-4. [DOI] [PubMed] [Google Scholar]
- 38.Ortiz C, Zhang D, Xie Y, Ribbe AE, Ben-Amotz D. Anal Biochem. 2006;353(2):157. doi: 10.1016/j.ab.2006.03.025. [DOI] [PubMed] [Google Scholar]
- 39.She CY, Dinh ND, Tu AT. Biochimica et Biophysica Acta (BBA) -General Subjects. 1974;372(2):345. [Google Scholar]
- 40.Longas MO, Breitweiser KO. Anal Biochem. 1991;192:193. doi: 10.1016/0003-2697(91)90205-8. [DOI] [PubMed] [Google Scholar]
- 41.Gilli R, Kacurakova M, Mathlouthi M, Navarini L, Paoletti S. Carbohydr Res. 1994;263(2):315. doi: 10.1016/0008-6215(94)00147-2. [DOI] [PubMed] [Google Scholar]


