Abstract
Lithocholic acid (LCA) is an endogenous compound associated with hepatic toxicity during cholestasis. LCA exposure in mice resulted in decreased serum lysophosphatidylcholine (LPC) and sphingomyelin levels due to elevated lysophosphatidylcholine acyltransferase (LPCAT) and sphingomyelin phosphodiesterase (SMPD) expression. Global metabolome analysis indicated significant decreases in serum palmitoyl-, stearoyl-, oleoyl- and linoleoyl-LPC levels after LCA exposure. LCA treatment also resulted in decreased serum sphingomyelin levels and increased hepatic ceramide levels, and induction of LPCAT and SMPD mRNAs. Transforming growth factor-β TGF-β) induced Lpcat2/4 and Smpd3 gene expression in primary hepatocytes and the induction was diminished by pretreatment with the SMAD3 inhibitor SIS3. Furthermore, alteration of the LPC metabolites and Lpcat1/2/4 and Smpd3 expression was attenuated in LCA-treated farnesoid X receptor-null mice that are resistant to LCA-induced intrahepatic cholestasis. This study revealed that LCA induced disruption of phospholipid/sphingolipid homeostasis through TGF-β signaling and that serum LPC is a biomarker for biliary injury.
Introduction
Cholestatic liver disease arises when the excretion of bile acids from liver is interrupted. Bile acids, mainly produced from cholesterol in liver, are required for the absorption and excretion of lipophilic metabolites such as cholesterol.1, 2 The excess accumulation of bile acids markedly alters the expression of various genes involved in cholesterol and phospholipid homeostasis resulting in cell death and inflammation, leading to severe liver injury.3, 4 Thus, cholestasis would be expected to alter serum and urinary metabolites. However, changes in endogenous chemicals during cholestasis have not been systematically examined.
Metabolomics, based on ultra-performance liquid chromatography coupled with time-of-flight mass spectrometry (UPLC-TOFMS), has been employed for the detection and characterization of small organic chemicals in biological matrices.5 Global metabolic approaches have been widely performed to identify small molecules associated with disease and to further understand the mechanisms of metabolic disorders. Alteration of urine metabolites has also been investigated in rodent cholestasis models, and in human cholestasis.6–8 However, determining the qualitative and quantitative changes in endogenous metabolites, and the role of these metabolites in disease, requires additional experimentation.
Lithocholic acid (LCA), the most potent endogenous chemical causing liver toxicity, is increased in patients with liver disease.9 LCA causes intrahepatic cholestasis,10 and experimental interventions to protect against LCA toxicity have been investigated using animal models.11–14 Nuclear receptors, such as pregnane X receptor, were reported to protect against LCA toxicity through regulation of CYP3A and sulfotransferase 2A that can protect from the LCA toxicity. A variety of LCA metabolites have been reported to be associated with this protection.7, 15–18 Recently, endogenous bile acid metabolism associated with LCA toxicity has also been investigated.7 LCA exposure was reported to change levels phospholipids, cholesterol, free fatty acids, and triglycerides.19 However, a comprehensive view of LCA-induced alterations in endogenous metabolites has not been rigorously examined.
In the current study, change in the serum metabolome following LCA-induced liver injury was assessed in mice fed LCA-supplemented diets in order to determine the mechanism of cholestatic liver injury and to discover biomarkers for disease progression. Comparison of the LCA-induced metabolic changes and altered gene expression patterns in the farnesoid X receptor (Fxr)-null mouse that is resistant to LCA-induced liver injury, provided further understanding of the mechanism of the LCA-induced liver toxicity.
Experimental Procedures
Animals and diets
Female mice (C57BL/6NCr), farnesoid X receptor (Fxr)-null mice, and background-matched wild-type mice20 were housed in temperature and light controlled rooms and given water and pelleted NIH-31 chow ad libitum. For the LCA studies, mice were given 0.6% LCA-supplement AIN93G diet with the AIN93G diet as a control (Dyets, Bethlehem, PA). All animal studies were carried out in accordance with Institute of Laboratory Animal Resources (ILAR) guidelines and protocols approved by the National Cancer Institute Animal Care and Use Committee.
Serum chemistry
Serum was prepared using Serum Separator Tubes (Becton, Deckinson and Company, Franklin Lakes, NJ). The serum catalytic activity of alanine aminotransferase (ALT) and alkaline phosphatase (ALP) was measured with ALT and ALP assay kit, respectively (Catachem, Bridgeport, CT).
UPLC-TOFMS analysis
Serum was prepared using Serum Separator Tubes (Becton, Deckinson and Company). The serum was diluted with 19 volumes of 66% acetonitrile and centrifuged twice at 18,000g for 20 min to remove insoluble materials. UPLC-TOFMS was preformed as previously reported.21 The eluant was introduced by electrospray ionization into the mass spectrometer [Q-TOF Premier® (Waters Corp, Milford, MA)] operating in either negative or positive electrospray ionization modes.
Data processing and multivariate data analysis
Data processing and multivariate data analysis were conducted as previously reported.7 Orthogonal projection to latent structures (OPLS) and contribution analyses were performed using SIMCA-P+12 (Umetrics, Kinnelon, NJ).
RNA analysis
RNA was extracted using TRIzol reagent (Invitrogen, Carlsbad, CA) and qPCR was performed using cDNA generated from 1 μg total RNA with a SuperScript II Reverse Transcriptase kit and random oligonucleotides (Invitrogen). Primers were designed using qPrimerDepot. All sequences are listed in Supplementary Table 1. Quantitative PCR reactions were carried out using SYBR green PCR master mix (Applied Biosystems, Foster City, CA) in an ABI Prism 7900HT Sequence Detection System. Values were quantified using comparative CT method, and samples were normalized to 18S ribosomal RNA.
Quantification of hepatic choline levels
Liver tissue was homogenized with Choline/Acetylcholine Assay Buffer (Abcam, Cambridge, UK) and the homogenate centrifuged at 18,000g for 20 min. The supernatant was subjected to determination of choline levels with the Choline/Acetylcholine Assay Kit (Abcam). Protein was measured with the Micro BCA Protein Assay Kit (Thermo Fisher Scientific Inc, Waltham, MA). Choline levels were normalized to total protein.
Quantification of serum lysophosphatidylcholine and sphingomyelin and hepatic ceramide levels
Quantification of serum lysophosphatidylcholine was performed according to a previously reported method.21 Serum sphingomyelin levels were estimated with the Sphingomyelin Assay Kit (Cayman, Ann Arbor, MI). Hepatic N-stearoyl-D-erythro-sphingosine (C18-ceramide) and N-palmitoyl-D-erythro-sphingosine (C16-ceramide) levels were determined as described below. Liver tissue (20 mg) was homogenized with 600 μL of methanol:CHCl3 (2:1) solution including N-palmitoyl (D31)-D-erythro-sphingosine (Avanti Polar Lipids, Inc., Alabaster, AL) as internal standard, and sonicated. To the homogenate was added 400 μL of CHCl3, followed by vortexing for 2 min, addition of 400 μL 0.1M HCl and vortexing for 2 min. The homogenate was centrifuged for 10 min and 200 μL of the organic phase was transferred to a new glass tube and dried with air. The pellet was suspended with a 79% methanol/20% water/1% formic acid solution, and sonicated. LC-MS for the ceramide detection was performed based on a method reported previously.22 Briefly, the sonicated samples were separated on a Phenomenex 2.1×100mm Luna 3μ C18 column (Torrance, CA) using the following gradient: (A:B) 80:20 for 1 min to 100% B at 5 min, held for 15 min, then equilibration at 80:20 for 1.5 min. The mobile phase consisted of (A) methanol-water-formic acid (74:25:1) and (B) methanol-formic acid (99:1). Both A and B were also buffered with 5 mM ammonium formate. The LC-MS system consisted of a PE series 200 LC pump and auto-injector (Perkin Elmer, Waltham, MA) coupled to an API2000 mass spectrometer (Applied Biosystems) operated in positive electrospray ionization mode. Multiple reaction monitoring was performed: 538.5→264.3 for C16-ceramide, 566.5→264.3 for C18-ceramide and 569.7→264.2 for the internal standard. C16- and C18-ceramides were determined with the authentic chemicals (Avanti Polar Lipids, Inc.), and the quantification was performed with standard curve.
Preparation and culture of primary hepatocytes
Primary hepatocytes were prepared based on a method previously reported.23 Cells were exposed to TGF-β for 6 hours, collected and lysed for RNA analysis.
Statistical analysis
Statistical analysis was performed using Prism® version 5.0c (GraphPad Software Inc., San Diego, CA). A p-value of less than 0.05 was considered as significant difference.
Results
Lithocholic acid exposure decreased serum lysophosphatidylcholine level
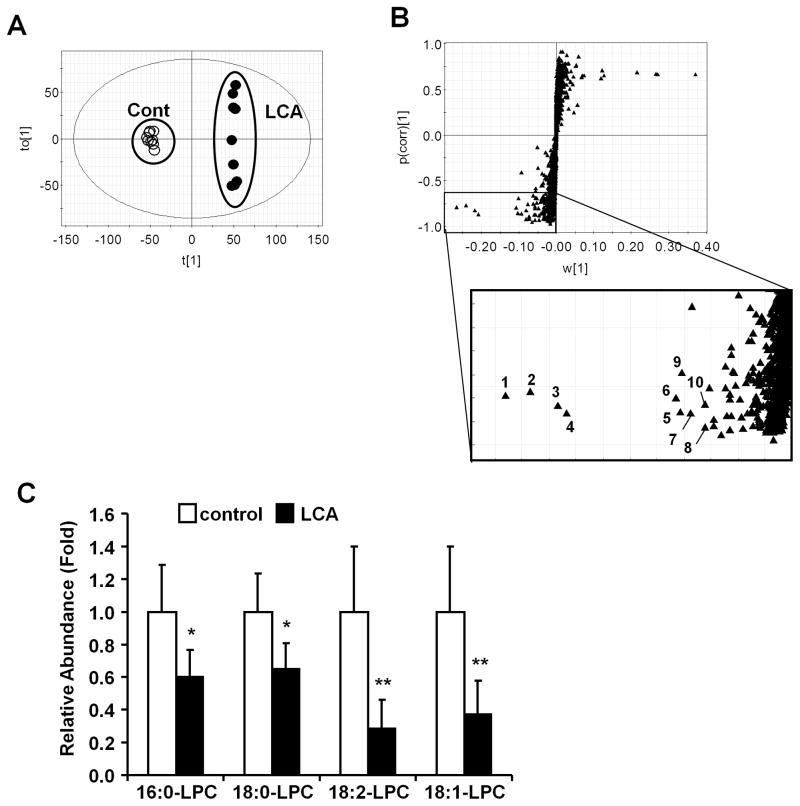
The influence of LCA exposure on serum metabolites was investigated using female mice treated for 7 days with AIN93G diet (control diet) and 0.6% LCA-supplemented AIN93G diet (LCA diet). Orthogonal projection to latent structures (OPLS) analysis was performed with UPLC-TOFMS negative mode data derived from serum of mice fed LCA or control diets. OPLS analysis showed a separation between the control and the LCA groups (Fig. 1A) that was further examined with an S-plot (Fig. 1B). The contribution analysis indicated ten enhanced and ten attenuated ions as the top-ranking ions giving rise to the separation. Most enhanced ions were derived from bile salts (Supplementary Table 2). In the attenuated ions group, seven ions were lysophosphatidylcholine (LPC) fragments ([M-H+HCO2H]−) (Table 1). Tandem mass spectrometry MS/MS fragmentation indicated that the ions had common fragmentation patterns as revealed by the presence of 224.06− (C8H18NO4P−) and a fragment derived from loss of oxygen ([M-OH]−) (Fig. S1A-G). The other major fragments, m/z=540.3299− at 4.99 min, m/z = 568.3615− at 5.60 min, m/z = 564.3297− at 4.76 min, m/z = 566.3462− at 5.14 min, m/z = 588.3287− at 4.75 min, m/z = 538.3133− at 4.58 min and m/z = 612.3286− at 4.71 min were assigned as 1-palmitoyl-sn-glycero-3-phosphocholine (palmitoyl LPC; 16:0-LPC), 1-stearoyl-sn-glycero-3-phosphocholine (strearoyl LPC; 18:0-LPC), 1-linoleoyl-sn-glycero-3-phospholcholine (linoleoyl LPC; 18:2-LPC), 1-oleoyl-sn-glycero-3-phosphocholine (oleoy l L P C ; 1 8 : 1-LPC), 1-arachidonoyl-sn-glycero-3-phosphocholine (arachidonoyl LPC), 1-palmitoleoyl-sn-glycero-3-phosphocholine (palmitoleoyl LPC) and 1-docosahexanoyl-sn-glycero-3-phosphocholine (docosahexanoyl LPC), respectively. These ions were confirmed using positive MS/MS fragmentation (data not shown). In addition, the relative abundance of the major acyl-LPCs (16:0-, 18:0-, 18:1- and 18:2-LPC) was decreased significantly after LCA exposure (Fig. 1C).
Figure 1. Identification of ions changed by LCA exposure.
(A) OPLS analysis of the serum metabolome between control diet (open diamond) and LCA diet (closed diamond). (B) S-plot analysis following the OPLS analysis. Number indicates a ranking determined by contribution analysis based on the OPLS analysis. (C) Relative abundance of serum LPC. Amounts were normalized to the internal standard 1-stearoyl (D35)-2-hydroxy-sn-glycero-3-phosphocholine. The value was expressed as fold to the mean of control. Data represents the mean and SD (n=6–7). Significance was determined with unpaired t test (*, P<0.05; **, P<0.01).
Table 1. Top ten of serum metabolite ions that were lower intensity in LCA-diet group than in control-diet group.
The ion ranking, based on OPLS analysis, indicates the highest confidence and greatest contribution to separation between the control and the LCA. The rank is the same as labeling of ions in Figure 1B. RT; retention time.
| Rank | RT (min) | Found (m/z) | Putative Ion form | Elemental composition | Mass error (ppm) | Candidate |
|---|---|---|---|---|---|---|
| 1 | 4.99 | 540.3299 | [M-H+HCO2H]− | C25H52NO9P | 0.37 | Palmitoyl LPC (16:0-LPC) |
| 2 | 5.60 | 568.3615 | [M-H+HCO2H]− | C27H56NO9P | 0.18 | Stearoyl LPC (18:0-LPC) |
| 3 | 4.76 | 564.3297 | [M-H+HCO2H]− | C27H52NO9P | 0.71 | Linoleoyl LPC (18:2-LPC) |
| 4 | 5.14 | 566.3462 | [M-H+HCO2H]− | C27H54NO9P | 0.71 | Oleoyl LPC (18:1-LPC) |
| 5 | 0.35 | 197.8075 | Not determined | |||
| 6 | 4.75 | 588.3287 | [M-H+HCO2H]− | C29H52NO9P | 2.38 | Arachidonoyl LPC (20:4-LPC) |
| 7 | 0.35 | 195.8108 | Not determined | |||
| 8 | 4.58 | 538.3133 | [M-H+HCO2H]− | C25H50NO9P | 2.23 | Palmitoleoyl LPC (16:1-LPC) |
| 9 | 4.71 | 612.3286 | [M-H+HCO2H]− | C31H52NO9P | 2.45 | Docosahexanoyl LPC (22:6-LPC) |
| 10 | 6.83 | 649.5518 | Not determined |
Serum LPC levels were negatively correlated with serum ALP activity
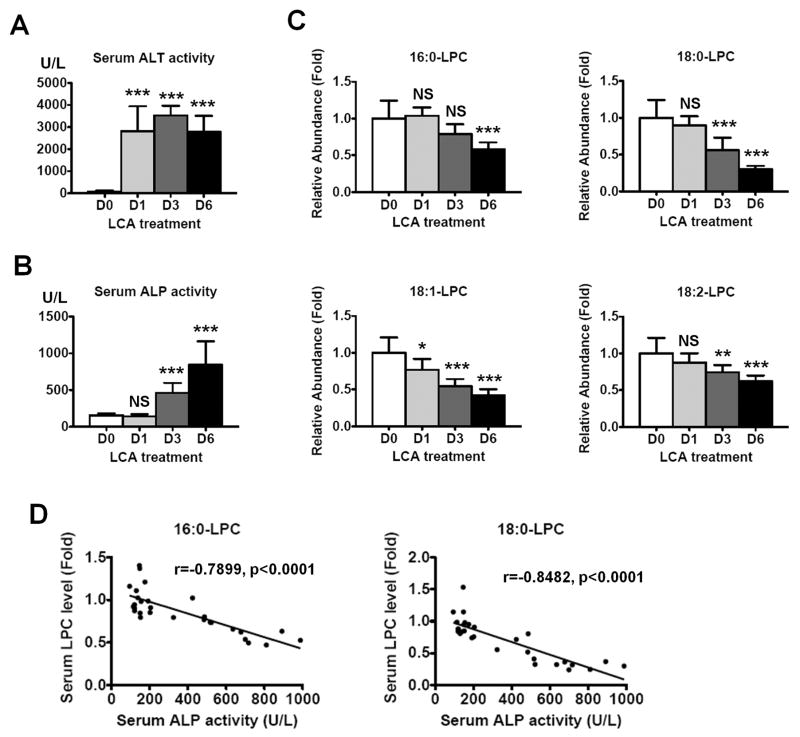
Serum ALT and ALP activities were measured at 1, 3, and 6 days after feeding an LCA diet (Fig. 2A and 2B). Serum ALT activity increased to 2810 ± 1100 U/L at day 1 and remained elevated at day 3 and day 6. Serum ALP activity significantly increased to 462 ± 135 U/L at day 3 and was much higher at day 6 (841 ± 301 U/L). Serum 16:0-, 18:0-, 18:1- and 18:2-LPC levels were also estimated at 1, 3, and 6 days after feeding the LCA diet (Fig. 2C). The 16:0-LCA levels were 1.04-, 0.79- and 0.58-fold at day 1, 3, and 6, respectively, and significantly decreased at day 6. The 18:0-LPC levels were 0.90-, 0.56- and 0.30-fold at day 1, 3, and 6, respectively. The 18:1-LPC levels were 0.77-, 0.55- and 0.42-fold, respectively, and the 18:1-LPC levels decreased by 0.88-, 0.74- and 0.62-fold, respectively. Thus, LPCs were decreased in a time-dependent manner after LCA exposure with marked decreases noted at day 6. In addition, the LPC levels were negatively correlated with the ALP activity (Fig. 2D, p<0.0001). The 18:0-LPC level showed the best correlation with the ALP activity among these LPCs (r = −0.8482). These results may indicate that the serum LPC levels are negatively associated with biliary injury.
Figure 2. Time-dependent changes of serum ALT, ALP and LPCs after LCA exposure.
Serum ALT (A) and ALP (B) activities after LCA treatment. The values are expressed as U/L and data represents the mean and SD (n=9–10). Significance was determined by one way-ANOVA with Dunnett’s test (***, P<0.001). NS, no significance. D0, D1, D3, and D6 represents pretreatment, 1 day, 3 days, and 6 days after LCA treatment, respectively. (C) Serum LPC levels after LCA treatment. The values are expressed as fold to the mean of the control amount. Data represents the mean and SD (n=9–10). Significance was determined by one way-ANOVA with Dunnett’s test (*, P<0.05; **P<0.01; ***, P<0.001). NS, no significance. D0, D1, D3, and D6 represents pretreatment, 1 day, 3 days, and 6 days after LCA treatment, respectively. (D) Correlation between serum ALP activity and serum LPC levels. Correlation factor (r) and p-value were estimated with Pearson’s correlation analysis.
LCA exposure changed hepatic expressions of genes involved in phosphatidylcholine homeostasis
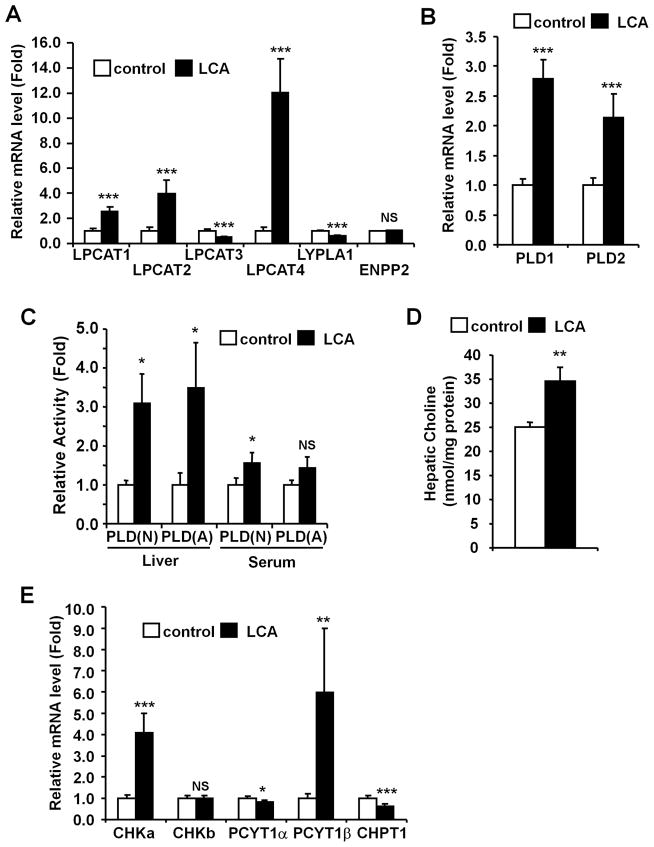
Hepatic and serum phospholipase A1 (PLA1) and A2 (PLA2) activities, major enzymes involved in LPC synthesis from phosphatidylcholine (PC),24, 25 were measured. The activities were not different between control and LCA groups in both liver and serum, although hepatic PLA1 and serum PLA2 were slightly increased (Fig. S2). Levels of mRNAs encoding lysophosphatidylcholine acyltransferases (LPCAT) 1 to 4, lysophospholipase A1 (LYPLA1) and ectonucleotide pyrophosphatase/phosphodiesterase 2 (ENPP2, also known as LysoPLD), involved in LPC metabolism,24, 26–28 were then determined in livers. Hepatic LPCAT1, LPCAT2 and LPCAT4 mRNAs increased by 2.5-, 4.0- and 12-fold, respectively, and hepatic LPCAT3 and LYPLA1 mRNA levels slightly decreased 0.49- and 0.60-fold, respectively (Fig. 3A). LCA exposure significantly increased the mRNAs encoding hepatic phospholipase D1 (PLD1) and phospholipase D2 (PLD2), which catalyze conversion of PC to phosphatidic acid,29, 30 by 2.8-fold and 2.0-fold, respectively (Fig. 3B). In addition, LCA exposure significantly enhanced the neutral and acidic PLD activities by 3.1-fold and 3.5-fold, respectively (Fig. 3C). Serum PLD activities were not changed. Hepatic choline levels were also increased after LCA exposure (control and LCA were 25.0 and 34.5 nmol/mg protein, respectively, Fig. 3D). To investigate whether LCA exposure increases de novo PC synthesis,31 hepatic choline kinase (CHK) α and β (CHKα and CHKβ), phosphate cytidylyltransferase 1 (PCYT1) α and β (PCYT1α and PCYT1β) and, choline phosphotransferase 1 (CHPT1) mRNA levels were measured (Fig. 3E). CHKα and PCYT1β mRNA levels were increased (4.1- and 6.0-fold, respectively), but CHKβ and PCYT1α mRNA levels were not changed. CHPT1 mRNA level was decreased after LCA exposure by 0.63-fold. Phospholipid levels in bile were also decreased by LCA exposure (Fig. S3). These results suggest that LCA exposure markedly alters hepatic phospholipid homeostasis leading PC deletion.
Figure 3. LCA exposure alters hepatic phospholipid metabolism.
qPCR analysis of mRNAs encoding LPC metabolism-related genes (A) and PLD (B). Expression was normalized to 18S ribosomal RNA and each bar represents the mean value and SD (n=5–6). (C) Serum and liver PLD activities were determined and the values expressed as fold to the mean of control activity. Data represents the mean and SD (n=3–4). N and A denotes neutral and acidic conditions, respectively. (D) Hepatic choline levels were normalized to protein amounts of whole extract. Data represents the mean and SD (n=4–5). (E) qPCR analysis of mRNAs encoding PC synthesis-related genes. Expression was normalized to 18S ribosomal RNA and each bar represents the mean value and SD (n=5–6). Significance was determined with unpaired t test (*, P<0.05; **P<0.01; ***, P<0.001). NS, no significance.
LCA exposure enhanced hepatic ceramide synthesis
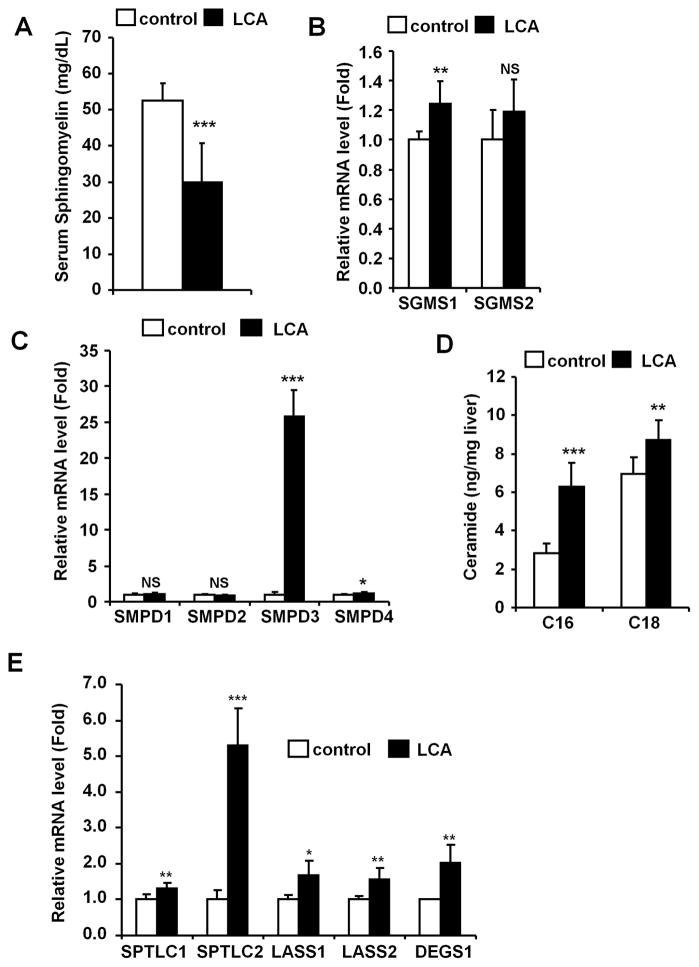
Since sphingomyelin (SM) is known to be metabolically associated with PC homeostasis,32 serum SM levels were measured (Fig. 4A). SM was markedly decreased after LCA exposure (52.5 to 29.9 mg/dL). SM is mainly regulated by SM synthase (SGMS) and sphingomyelin phosphodiesterase (SMPD, also known as sphingomyelinase).32 Thus, SGMS1 and 2, and SMPD1 to 4 mRNA levels were measured in livers revealing that SGMS1 levels were slightly increased (1.3-fold) but SGMS2 unchanged. Acidic sphingomyelinase SMPD1 level was not altered after LCA exposure, while neutral sphingomyelinase SMPD3 level was markedly increased by 26-fold (Figs. 4B and 4C). The levels of the other neutral sphingomyelinases (SMPD2 and SMPD4) were not changed (0.88- and 1.2-fold). Furthermore, hepatic ceramides (CM) N-palmitoyl-D-erythro-sphingosine (C16-CM) and N-stearoyl-D-erythro-sphingosine (C18-CM) levels were measured. The C16-CM and C18-CM levels were increased to 6.3 and 8.7 ng/mg liver, respectively (Fig. 4D). Hepatic mRNAs encoding de novo synthesis-related genes, such as serine palmitoyltransferase, long chain base subunit 1 and 2 (SPTLC1 and 2), LAG1 homolog, ceramide synthase 1 and 2 (LASS1 and 2) and degenerative spermatocyte homolog 1 (DEGS1), were also increased (Fig. 4E). Thus hepatic disruption of SM-CM homeostasis was also observed after LCA exposure.
Figure 4. LCA exposure induced hepatic ceramide production.
(A) The SM levels were determined and the data represents the mean and SD (n=4–5). (B and C) qPCR analysis of SGMS (B) and SMPD (C) mRNAs. Levels were normalized to 18S ribosomal RNA and each bar represents the mean value and SD (n=5–6). (D) Hepatic CM levels were determined and the values expressed as ratio to liver weight (ng/mg liver). Data represents the mean and SD (n=9). C16, C16-ceramide; C18, C18-ceramide. (E) qPCR analysis of the CM synthase genes. Expression was normalized to 18S ribosomal RNA and each bar represents the mean value and SD (n=5–6). SPTLC1, serine palmitoyltransferase, long chain base subunit 1; SPTLC2, serine palmitoyltransferase, long chain base subunit 2; LASS1, LAG1 homolog, ceramide synthase 1; LASS2, LAG1 homolog, ceramide synthase 2; DEGS1, degenerative spermatocyte homolog 1 (Drosophila). Significance was determined with an unpaired t test (*, P<0.05; **P<0.01; ***, P<0.001). NS, no significance.
Influence of LCA on phospholipid/sphingolipid homeostasis waned in Fxr-null mice
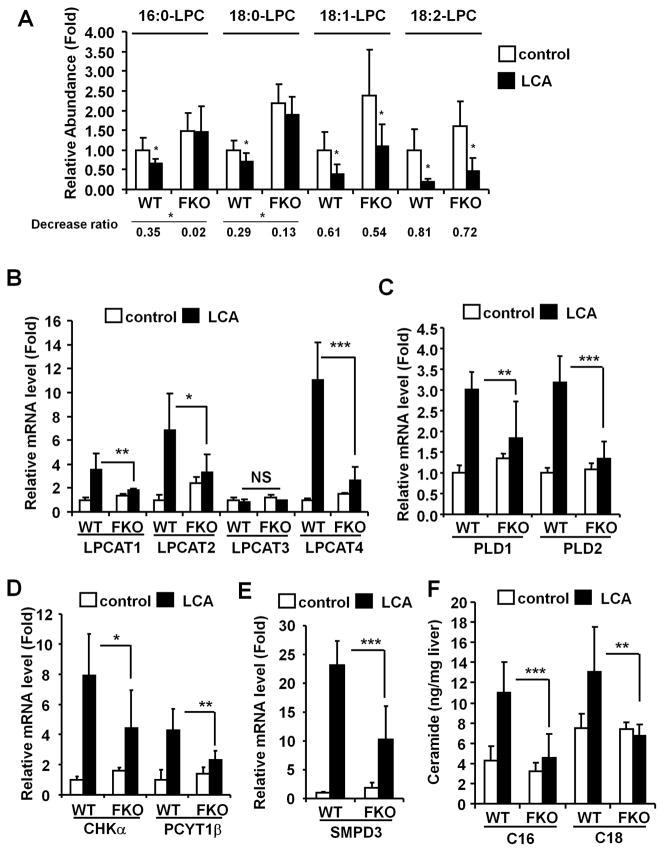
Fxr-null mice were resistant to the LCA hepatotoxicity (Fig. S4A–C), as reported previously.13 To determine whether the altered phospholipid/sphingolipid homeostasis was associated with LCA-induced liver injury, Fxr-null mice were examined. The deceased ratio of the tested LPC levels was smaller in Fxr-null mice than that in the wild-type mice, the ratio of 16:0- and 18:0-LPC were significantly lowered (Fig. 5A). The suppression of expression of stearoyl-coenzyme A desaturase 1 (SCD1), which catalyzes the rate-limiting reaction for monounsaturated fatty acid synthesis, was not significantly different between wild-type and Fxr-null mice although the constitutive expression was higher in Fxr-null mice without and with LCA (Fig. S4D). The LCA-induced increase in expression of several key genes was also attenuated in the livers of Fxr-null mice (Fig. 5B–E), although the LCA-induced Chpt1 expression was unchanged (Fig. S4E). Interestingly, hepatic C16- and C18-CM levels were much lower in the Fxr-null mice than in wild-type mice (Fig. 5F). These observations suggest that increased C16-and C18-CM levels after LCA exposure contribute to the liver injury.
Figure 5. LCA-induced disruption of phospholipid/sphingolipid homeostasis in Fxr-null mice.
WT and FKO donates wild-type and Fxr-null mouse, respectively. (A) Relative abundance of serum LPC. Amounts were normalized to the internal standard 1-stearoyl (D35)-2-hydroxy-sn-glycero-3-phosphocholine. The value was expressed as fold to the mean of control amount. Data represents the mean and SD (n=6–7). Significance was determined with an unpaired t test (*, P<0.05; **, P<0.01). Decrease ratio represent proportion of the LCA to the control. qPCR analysis of LPCATS (B), PLDS (C), CHKα and PCYT1β (D), and SMPD3 (E) mRNAs. Expression was normalized to 18S ribosomal RNA and each bar represents the mean value and SD (n=5–6). Significance was determined by one way-ANOVA with Bonferroni’s test (*, P<0.05; **P<0.01; ***, P<0.001). NS, no significance. (F) Hepatic CM levels were measured and the values expressed as ratio to liver weight (ng/mg liver). Data represent the mean and SD (n=5–6). Significance was determined by one way-ANOVA with Bonferroni’s test (**P<0.01; ***P<0.001).
TGF-β is a regulator for phospholipid/sphingolipid homeostasis
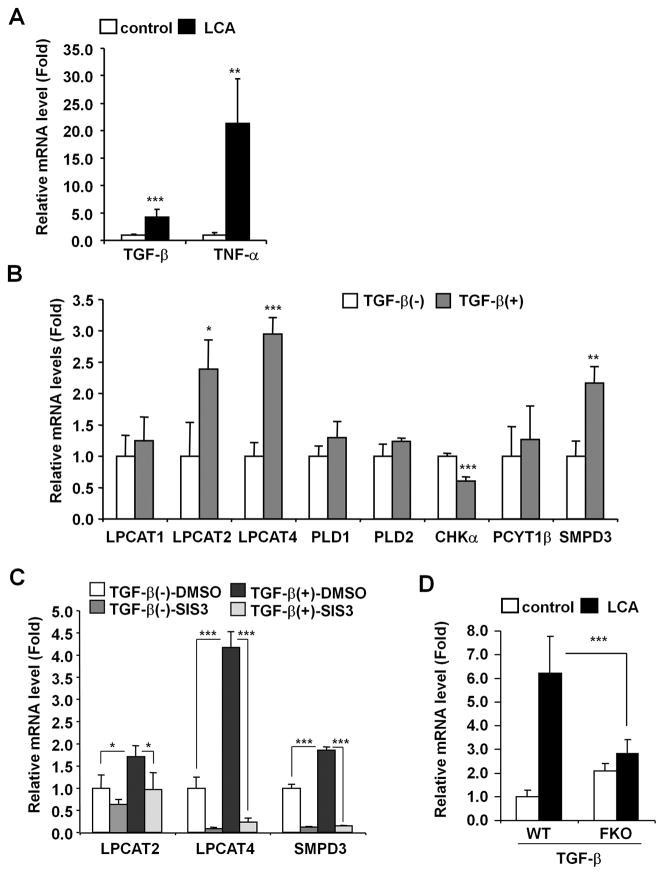
Since LCA-induced gene expression was attenuated in Fxr-null mice that are resistant to LCA toxicity, studies were conducted to determine whether FXR regulates the genes that showed altered expression upon LCA exposure. The FXR agonist GW4064 exposure did not enhance expression of the Lpcat1, Lpcat2, Lpcat4, Pld1, Pld2, Smpd3 and Tgfb1 genes in primary hepatocytes, while the bonafide FXR target gene, small heterodimer partner, was induced by 3 fold (Fig. S6). Earlier studies revealed that transforming growth factor-β (TGF-β) increases CM levels in Mv1Lu cells33 and tumor necrosis factor-α (TNF-α) was reported to up-regulate LPCAT activities in immune cells.34 Indeed, LCA exposure resulted in increased TGF-β and TNF-α mRNAs (Fig. 6A). TGF-β exposure induced Lpcat2/4 and Smpd3 expression in primary hepatocytes but did not induce Lpcat1, Pld1, Pld2, and Pcyt1b expression (Fig. 6B). Chka expression was decreased by treatment with TGF-β. However, TNF-α exposure did not change expression of these genes in hepatocytes (data not shown). In addition, the enhanced expression was attenuated by treatment with the SMAD3 inhibitor SIS3 (Fig. 6C). Furthermore, the LCA-induced Tgfb1 gene expression was diminished in Fxr-null mice (Fig. 6D). Enhanced taurolithocholate, which is a potent stimulator of oxidative stress, was lower in the LCA-treated Fxr-null mice as compared to wild-type mice (Fig. S6A), and hepatic H2O2 levels were lower (Fig. S6B). Elevated oxidative stress can accelerate hepatic TGF-β activation.35 These results may indicate that oxidative stress-activated TGF-β-SMAD3 signaling is involved in LCA-induced disruption of phospholipid/sphingolipid homeostasis.
Figure 6. LCA induces Lpcat2/4 and Smpd3 expression through TGF-β-SMAD3 signaling.
(A) qPCR analysis of TGF-β and TNF-α mRNAs in liver. Expression was normalized to 18S ribosomal RNA and each bar represents the mean value and SD (n=5–6). Significance was determined with an unpaired t test (*, P<0.05; **P<0.01; ***, P<0.001). (B) qPCR analysis of LCA-induced genes in primary hepatocytes. Five ng of active TGF-β protein was subject to primary hepatocytes. Six hours after, the cells were collected and lysed for qPCR analysis. Expression was normalized to 18S ribosomal RNA and each bar represents the mean value and SD (n=4). Significance was determined with unpaired t test (*, P<0.05; **, P<0.01; ***, P<0.001). (C) qPCR analysis of LPCAT2/4 and SMPD3 mRNAs in primary hepatocytes after treatment with the SMAD3 inhibitor SIS3. Primary hepatocytes were incubated with 10 μM of SIS3 (0.1% of DMSO as vehicle) before 5 ng of active TGF-β protein was added. Six hours after the addition of TGF-β, the cells were collected and lysed for qPCR analysis of mRNA. Messenger RNA expression was normalized to 18S ribosomal RNA and each bar represents the mean value and SD (n=3). Significance was determined with one-way ANOVA followed by Tukey’s test (*, P<0.05; ***, P<0.001). (D) qPCR analysis of TGF-β mRNA in the livers of wild-type and Fxr-null mice. Expression was normalized to 18S ribosomal RNA and each bar represents the mean value and SD (n=5–6). Significance was determined with one-way ANOVA followed by Bonferroni’s test (***, P<0.001).
Discussion
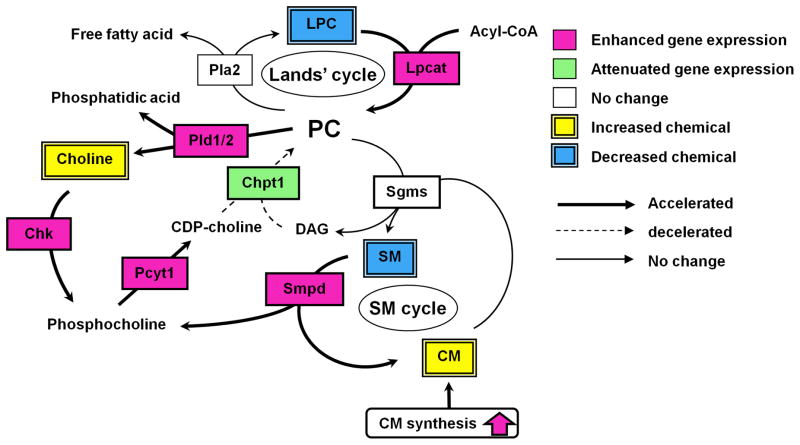
The current study demonstrated that LCA disrupted phospholipid and sphingolipid homeostasis following changes in the expression of enzymes involved in their synthesis (Fig. 7). To further determine the global changes of serum metabolites after an LCA diet, the serum metabolome of the LCA-treated mice was interrogated and compared with that of the controls. UPLC-TOFMS, in conjunction with an OPLS analysis, revealed changes in serum metabolites after LCA exposure, and determined bile acid metabolites as being markedly elevated while LPCs were decreased. Since the liver is the major site of serum LPC biogenesis,36, 37 the changes in serum lipid profiles may reflect liver injury. Levels of the major LPCs in serum (16:0-, 18:0-, 18:1- and 18:2-LPC) were decreased in a time-dependent manner after LCA exposure, and interestingly, serum LPC levels were negatively correlated with serum ALP levels, which is a conventional marker for cholestasis. In addition, the decrease in serum LPC levels was attenuated in Fxr-null mice, which are resistant to LCA-induced liver injury. The LCA-treated Fxr-null mice, however, showed significantly decreased unsaturated LPC (18:1- and 18:2-LPC) as well as the wild-type mice. This is due to lower hepatic SCD1 mRNA level that produces unsaturated LPC.21 While the association of hepatic Scd1 expression with biliary injury requires further investigation, these results strongly support the view that LPCs, especially saturated LPC, reflect the severity of biliary injury such as cholestasis.
Figure 7. LCA-induced alteration of phospholipid/shingolipid metabolism.
Pink and green boxes represent enhanced and attenuated gene expression, respectively. Yellow and blue double squares represent increased and decreased metabolites, respectively. Accelerated and decelerated metabolic pathways are represented as bold and dashed arrow, respectively.
LPC was reported to be a proinflammatory atherogenic phospholipid that activates a variety of immune cells such as monocytes and neutrophils.38–41 In immune cells, oxidative stress stimulates LPC production following enhanced PLA2 activity.42 Hydrophobic bile acid exposure leads to reactive oxygen generation from mitochondria.43 However, LCA exposure did not induce PLA2 activities in both serum and liver, but rather decreased serum LPC levels. Thus, in vivo, especially with regard to hepatic PC metabolism, the influence of bile acid accumulation on PLA2 activity may be marginal. In contrast, LCA exposure induced the expression of Lpcat 1, 2 and 4 genes in livers. In the hepatic remodeling system of PC (Lands’ cycle44), PC production is enhanced after LCA exposure. Despite this, LCA exposure significantly decreased phospholipid levels in bile. Excess of hepatic bile acids can lead to increased consumption of phospholipids to facilitate the excretion of the bile acids. Among the phospholipids, PC is the most important component for elimination of bile acids. In addition to the Lands’ cycle, PC homeostasis is mainly achieved by de novo synthesis through a cascade of three enzymatic steps from choline to PC (CHK, PCYT1 and CHPT1, Kennedy pathway31). CHPT1 mRNA levels were decreased in liver after LCA exposure. Although the CHKα and PCYT1β mRNA levels were increased, LCA exposure attenuated PC synthesis through the Kennedy pathway following a decrease in hepatic CHPT1 levels.19 In addition, hepatic PLD1 and 2 activities, which are involved in PC degradation, were elevated due after LCA exposure. Judging from results in the present study, the mechanisms by which LCA induces hepatic PC depletion were considered to be 1) excess consumption of PC, 2) attenuation of the Kennedy pathway and 3) enhancement of PLD activities (PC degradation). Thus, the LCA-induced decrease of serum LPC levels may result from their compensatory action on PC supply following induction of hepatic Lpcat expression.
Further to the alteration of PC homeostasis, decreased serum SM levels were observed in the present study. SM is dominantly regulated by the SM cycle,32 which involves the synthetic enzyme SGMS and the degradative enzyme SMPD. Both hepatic SGMS1 and 2 mRNA levels were little changed, while hepatic Smpd3 expression was markedly induced after LCA exposure. The decrease in serum SM levels may result from SMPD3 induction. Furthermore LCA exposure increased hepatic C16- and C18-CM levels. SMPD3 (also known as neutral sphingomyelinase 2) has emerged as a predominant mediator for stress-induced CM production.45, 46 CM, one of the functional sphingolipids, is known to induce apoptosis in various cells.47 Hydrophobic bile acids are also known to induce hepatocyte apoptosis43, 48 and apoptosis is observed in the livers of patients with cholestasis.49, 50 Interestingly, incubation of hepatocytes with a specific inhibitor of neutral, but not acidic, sphingomyelinase diminished the apoptotic response of primary hepatocytes to bile acids.51–53 Thus, LCA-mediated SMPD3 induction can be a crucial potentiator of LCA-induced cholestasis. However, Kupffer cell acidic sphingomyelinase (SMPD1) is required for survival and regeneration in bile duct ligation-liver54 and Kupffer cell CM act to protect against liver injury. Additional studies are needed to determine the influence of CM accumulation in hepatocytes and nonparenchymal cells on cholestasis.
Bile duct ligation induced production of proinflammatory cytokines including TGF-β and TNF-α.55 LCA exposure also resulted in increased levels of hepatic TGF-β and TNF-α mRNAs. TGF-β expression is observed not only in liver cells, but also in metaplastic bile duct epithelium56. TGF-β, but not TNF-α, induced the expression of Lpcat2/4 and Smpd3 in primary hepatocytes. In addition, the SMAD3 inhibitor-treated hepatocytes showed lower induction of these genes. Thus, bile duct-derived TGF-β and hepatocyte SMAD3 signaling may be involved in altering hepatic phospholipid/sphingolipid homeostasis during biliary injury.
LCA exposure dramatically altered the expression of genes involved in phospholipid- and sphingolipid-metabolism. A decrease in CHPT1 activity was suggested to be associated with liver injury.19 Fxr-null mice showed a decrease in CHPT1 mRNA as well as the wild-type mice. Thus, the CHPT1 decrease may not be a crucial factor for LCA-induced liver injury. In Fxr-null mice, except for Chpt1, the enhancement of the phospholipid- and sphingolipid-related gene expression was attenuated. Furthermore, the decrease in serum LPC and the increase in hepatic CM were reduced in Fxr-null mice along with diminished hepatic TGF-β mRNA compared to wild-type mice treated with LCA. These results strongly support the view that the metabolic alterations described in the present study can play a causative role in biliary injury/cholestasis. The present observations may suggest that FXR activation is associated with the LCA-induced liver injury. However, the FXR agonist GW4064 did not induce the expression of several genes altered during LCA-induced liver injury. Additional studies are needed to determine whether FXR directly contributes to the LCA-induced gene expression in non-parenchymal cells. It is likely from the available evidence that the attenuation of the LCA-enhanced gene expression in Fxr-null mice may result form adaptation to LCA toxicity.
In conclusion, the present study revealed LCA-induced alterations of phospholipid/sphingolipid homeostasis, indicating the possibility of serum LPC as a serum biomarker of cholestasis. While the present results established a metabolic linkage between LPC and biliary injury, future studies are required to understand the relationship between cytokines, cholestasis and phospholipid/sphingolipid homeostasis.
Supplementary Material
Acknowledgments
This work was supported by the National Cancer Institute Intramural Research Program, Center for Cancer Research. We thank John Buckley for technical assistance. TM was supported by a fellowship from the Japanese Society for the Promotion of Science. TGF-β was provided by Lalage M. Wakefield (National Cancer Institute, NIH).
Abbreviations
- ALP
alkaline phosphatase
- ALT
alanine aminotransferase
- CHK
choline kinase
- CHPT1
choline phosphotransferase 1
- CM
ceramide
- FXR
farnesoid X receptor
- LCA
lithocholic acid
- LPC
lysophosphatidylcholine
- LPCAT
lysophosphatidylcholine acyltransferase
- OPLS
orthogonal projection to latent structures
- PC
phosphatidylcholine
- PCYT1
phosphate cytidylyltransferase 1
- PLA
phospholipase A
- PLD
phospholipase D
- SGMS
sphingomyelin synthase
- SM
sphingomyelin
- SMPD
sphingomyelin phosphodiesterase
- TGF-β
transforming growth factor-β
- TNF-α
tumor necrosis factor-α
- UPLC-TOFMS
ultra-performance liquid chromatography coupled with time-of-flight mass spectrometry
References
- 1.Carey MC, Small DM, Bliss CM. Lipid digestion and absorption. Annu Rev Physiol. 1983;45:651–677. doi: 10.1146/annurev.ph.45.030183.003251. [DOI] [PubMed] [Google Scholar]
- 2.Hernell O, Staggers JE, Carey MC. Physical-chemical behavior of dietary and biliary lipids during intestinal digestion and absorption. 2. Phase analysis and aggregation states of luminal lipids during duodenal fat digestion in healthy adult human beings. Biochemistry. 1990;29:2041–2056. doi: 10.1021/bi00460a012. [DOI] [PubMed] [Google Scholar]
- 3.Dionne S, Tuchweber B, Plaa GL, Yousef IM. Phase I and phase II metabolism of lithocholic acid in hepatic acinar zone 3 necrosis. Evaluation in rats by combined radiochromatography and gas-liquid chromatography-mass spectrometry. Biochem Pharmacol. 1994;48:1187–1197. doi: 10.1016/0006-2952(94)90156-2. [DOI] [PubMed] [Google Scholar]
- 4.Rodrigues CM, Steer CJ. Mitochondrial membrane perturbations in cholestasis. J Hepatol. 2000;32:135–141. doi: 10.1016/s0168-8278(00)80200-7. [DOI] [PubMed] [Google Scholar]
- 5.Chen C, Gonzalez FJ, Idle JR. LC-MS-based metabolomics in drug metabolism. Drug Metab Rev. 2007;39:581–597. doi: 10.1080/03602530701497804. [DOI] [PMC free article] [PubMed] [Google Scholar]
- 6.Marschall HU, Wagner M, Bodin K, Zollner G, Fickert P, Gumhold J, et al. Fxr(−/−) mice adapt to biliary obstruction by enhanced phase I detoxification and renal elimination of bile acids. J Lipid Res. 2006;47:582–592. doi: 10.1194/jlr.M500427-JLR200. [DOI] [PubMed] [Google Scholar]
- 7.Cho JY, Matsubara T, Kang DW, Ahn SH, Krausz KW, Idle JR, et al. Urinary metabolomics in Fxr-null mice reveals activated adaptive metabolic pathways upon bile acid challenge. J Lipid Res. 2010;51:1063–1074. doi: 10.1194/jlr.M002923. [DOI] [PMC free article] [PubMed] [Google Scholar]
- 8.Yousef IM, Perwaiz S, Lamireau T, Tuchweber B. Urinary bile acid profile in children with inborn errors of bile acid metabolism and chronic cholestasis; screening technique using electrospray tandem mass-spectrometry (ES/MS/MS) Med Sci Monit. 2003;9:MT21–31. [PubMed] [Google Scholar]
- 9.Festi D, Morselli Labate AM, Roda A, Bazzoli F, Frabboni R, Rucci P, et al. Diagnostic effectiveness of serum bile acids in liver diseases as evaluated by multivariate statistical methods. Hepatology. 1983;3:707–713. doi: 10.1002/hep.1840030514. [DOI] [PubMed] [Google Scholar]
- 10.Hofmann AF. Detoxification of lithocholic acid, a toxic bile acid: relevance to drug hepatotoxicity. Drug Metab Rev. 2004;36:703–722. doi: 10.1081/dmr-200033475. [DOI] [PubMed] [Google Scholar]
- 11.Staudinger JL, Goodwin B, Jones SA, Hawkins-Brown D, MacKenzie KI, LaTour A, et al. The nuclear receptor PXR is a lithocholic acid sensor that protects against liver toxicity. Proc Natl Acad Sci U S A. 2001;98:3369–3374. doi: 10.1073/pnas.051551698. [DOI] [PMC free article] [PubMed] [Google Scholar]
- 12.Xie W, Radominska-Pandya A, Shi Y, Simon CM, Nelson MC, Ong ES, et al. An essential role for nuclear receptors SXR/PXR in detoxification of cholestatic bile acids. Proc Natl Acad Sci U S A. 2001;98:3375–3380. doi: 10.1073/pnas.051014398. [DOI] [PMC free article] [PubMed] [Google Scholar]
- 13.Kitada H, Miyata M, Nakamura T, Tozawa A, Honma W, Shimada M, et al. Protective role of hydroxysteroid sulfotransferase in lithocholic acid-induced liver toxicity. J Biol Chem. 2003;278:17838–17844. doi: 10.1074/jbc.M210634200. [DOI] [PubMed] [Google Scholar]
- 14.Uppal H, Saini SP, Moschetta A, Mu Y, Zhou J, Gong H, et al. Activation of LXRs prevents bile acid toxicity and cholestasis in female mice. Hepatology. 2007;45:422–432. doi: 10.1002/hep.21494. [DOI] [PubMed] [Google Scholar]
- 15.Araya Z, Wikvall K. 6alpha-hydroxylation of taurochenodeoxycholic acid and lithocholic acid by CYP3A4 in human liver microsomes. Biochim Biophys Acta. 1999;1438:47–54. doi: 10.1016/s1388-1981(99)00031-1. [DOI] [PubMed] [Google Scholar]
- 16.Bodin K, Lindbom U, Diczfalusy U. Novel pathways of bile acid metabolism involving CYP3A4. Biochim Biophys Acta. 2005;1687:84–93. doi: 10.1016/j.bbalip.2004.11.003. [DOI] [PubMed] [Google Scholar]
- 17.Miyata M, Watase H, Hori W, Shimada M, Nagata K, Gonzalez FJ, et al. Role for enhanced faecal excretion of bile acid in hydroxysteroid sulfotransferase-mediated protection against lithocholic acid-induced liver toxicity. Xenobiotica. 2006;36:631–644. doi: 10.1080/00498250600776827. [DOI] [PubMed] [Google Scholar]
- 18.Deo AK, Bandiera SM. 3-ketocholanoic acid is the major in vitro human hepatic microsomal metabolite of lithocholic acid. Drug Metab Dispos. 2009;37:1938–1947. doi: 10.1124/dmd.109.027763. [DOI] [PubMed] [Google Scholar]
- 19.Miyata M, Nomoto M, Sotodate F, Mizuki T, Hori W, Nagayasu M, et al. Possible protective role of pregnenolone-16 alpha-carbonitrile in lithocholic acid-induced hepatotoxicity through enhanced hepatic lipogenesis. Eur J Pharmacol. 2010;636:145–154. doi: 10.1016/j.ejphar.2010.03.022. [DOI] [PubMed] [Google Scholar]
- 20.Sinal CJ, Tohkin M, Miyata M, Ward JM, Lambert G, Gonzalez FJ. Targeted disruption of the nuclear receptor FXR/BAR impairs bile acid and lipid homeostasis. Cell. 2000;102:731–744. doi: 10.1016/s0092-8674(00)00062-3. [DOI] [PubMed] [Google Scholar]
- 21.Chen C, Shah YM, Morimura K, Krausz KW, Miyazaki M, Richardson TA, et al. Metabolomics reveals that hepatic stearoyl-CoA desaturase 1 downregulation exacerbates inflammation and acute colitis. Cell Metab. 2008;7:135–147. doi: 10.1016/j.cmet.2007.12.003. [DOI] [PMC free article] [PubMed] [Google Scholar]
- 22.Merrill AH, Jr, Sullards MC, Allegood JC, Kelly S, Wang E. Sphingolipidomics: high-throughput, structure-specific, and quantitative analysis of sphingolipids by liquid chromatography tandem mass spectrometry. Methods. 2005;36:207–224. doi: 10.1016/j.ymeth.2005.01.009. [DOI] [PubMed] [Google Scholar]
- 23.Seglen PO. Preparation of isolated rat liver cells. Methods Cell Biol. 1976;13:29–83. doi: 10.1016/s0091-679x(08)61797-5. [DOI] [PubMed] [Google Scholar]
- 24.Farooqui AA, Taylor WA, Pendley CE, 2nd, Cox JW, Horrocks LA. Spectrophotometric determination of lipases, lysophospholipases, and phospholipases. J Lipid Res. 1984;25:1555–1562. [PubMed] [Google Scholar]
- 25.Croset M, Brossard N, Polette A, Lagarde M. Characterization of plasma unsaturated lysophosphatidylcholines in human and rat. Biochem J. 2000;345(Pt 1):61–67. [PMC free article] [PubMed] [Google Scholar]
- 26.Wang A, Yang HC, Friedman P, Johnson CA, Dennis EA. A specific human lysophospholipase: cDNA cloning, tissue distribution and kinetic characterization. Biochim Biophys Acta. 1999;1437:157–169. doi: 10.1016/s1388-1981(99)00012-8. [DOI] [PubMed] [Google Scholar]
- 27.Shindou H, Shimizu T. Acyl-CoA:lysophospholipid acyltransferases. J Biol Chem. 2009;284:1–5. doi: 10.1074/jbc.R800046200. [DOI] [PubMed] [Google Scholar]
- 28.Aoki J. Mechanisms of lysophosphatidic acid production. Semin Cell Dev Biol. 2004;15:477–489. doi: 10.1016/j.semcdb.2004.05.001. [DOI] [PubMed] [Google Scholar]
- 29.Cummings R, Parinandi N, Wang L, Usatyuk P, Natarajan V. Phospholipase D/phosphatidic acid signal transduction: role and physiological significance in lung. Mol Cell Biochem. 2002:234–235. 99–109. [PubMed] [Google Scholar]
- 30.Exton JH. Regulation of phospholipase D. FEBS Lett. 2002;531:58–61. doi: 10.1016/s0014-5793(02)03405-1. [DOI] [PubMed] [Google Scholar]
- 31.Kennedy EP, Weiss SB. The function of cytidine coenzymes in the biosynthesis of phospholipides. J Biol Chem. 1956;222:193–214. [PubMed] [Google Scholar]
- 32.Hannun YA. The sphingomyelin cycle and the second messenger function of ceramide. J Biol Chem. 1994;269:3125–3128. [PubMed] [Google Scholar]
- 33.Sato M, Markiewicz M, Yamanaka M, Bielawska A, Mao C, Obeid LM, et al. Modulation of transforming growth factor-beta (TGF-beta) signaling by endogenous sphingolipid mediators. J Biol Chem. 2003;278:9276–9282. doi: 10.1074/jbc.M211529200. [DOI] [PubMed] [Google Scholar]
- 34.Neville NT, Parton J, Harwood JL, Jackson SK. The activities of monocyte lysophosphatidylcholine acyltransferase and coenzyme A-independent transacylase are changed by the inflammatory cytokines tumor necrosis factor alpha and interferon gamma. Biochim Biophys Acta. 2005;1733:232–238. doi: 10.1016/j.bbalip.2004.12.010. [DOI] [PubMed] [Google Scholar]
- 35.Purohit V, Brenner DA. Mechanisms of alcohol-induced hepatic fibrosis: a summary of the Ron Thurman Symposium. Hepatology. 2006;43:872–878. doi: 10.1002/hep.21107. [DOI] [PubMed] [Google Scholar]
- 36.Sekas G, Patton GM, Lincoln EC, Robins SJ. Origin of plasma lysophosphatidylcholine: evidence for direct hepatic secretion in the rat. J Lab Clin Med. 1985;105:190–194. [PubMed] [Google Scholar]
- 37.Baisted DJ, Robinson BS, Vance DE. Albumin stimulates the release of lysophosphatidylcholine from cultured rat hepatocytes. Biochem J. 1988;253:693–701. doi: 10.1042/bj2530693. [DOI] [PMC free article] [PubMed] [Google Scholar]
- 38.Kume N, Cybulsky MI, Gimbrone MA., Jr Lysophosphatidylcholine, a component of atherogenic lipoproteins, induces mononuclear leukocyte adhesion molecules in cultured human and rabbit arterial endothelial cells. J Clin Invest. 1992;90:1138–1144. doi: 10.1172/JCI115932. [DOI] [PMC free article] [PubMed] [Google Scholar]
- 39.Kohno M, Yokokawa K, Yasunari K, Minami M, Kano H, Hanehira T, et al. Induction by lysophosphatidylcholine, a major phospholipid component of atherogenic lipoproteins, of human coronary artery smooth muscle cell migration. Circulation. 1998;98:353–359. doi: 10.1161/01.cir.98.4.353. [DOI] [PubMed] [Google Scholar]
- 40.Liu-Wu Y, Hurt-Camejo E, Wiklund O. Lysophosphatidylcholine induces the production of IL-1beta by human monocytes. Atherosclerosis. 1998;137:351–357. doi: 10.1016/s0021-9150(97)00295-5. [DOI] [PubMed] [Google Scholar]
- 41.Nishioka H, Horiuchi H, Arai H, Kita T. Lysophosphatidylcholine generates superoxide anions through activation of phosphatidylinositol 3-kinase in human neutrophils. FEBS Lett. 1998;441:63–66. doi: 10.1016/s0014-5793(98)01526-9. [DOI] [PubMed] [Google Scholar]
- 42.Goldman R, Ferber E, Zort U. Reactive oxygen species are involved in the activation of cellular phospholipase A2. FEBS Lett. 1992;309:190–192. doi: 10.1016/0014-5793(92)81092-z. [DOI] [PubMed] [Google Scholar]
- 43.Yerushalmi B, Dahl R, Devereaux MW, Gumpricht E, Sokol RJ. Bile acid-induced rat hepatocyte apoptosis is inhibited by antioxidants and blockers of the mitochondrial permeability transition. Hepatology. 2001;33:616–626. doi: 10.1053/jhep.2001.22702. [DOI] [PubMed] [Google Scholar]
- 44.Lands WE. Metabolism of glycerolipides; a comparison of lecithin and triglyceride synthesis. J Biol Chem. 1958;231:883–888. [PubMed] [Google Scholar]
- 45.Liu B, Andrieu-Abadie N, Levade T, Zhang P, Obeid LM, Hannun YA. Glutathione regulation of neutral sphingomyelinase in tumor necrosis factor-alpha-induced cell death. J Biol Chem. 1998;273:11313–11320. doi: 10.1074/jbc.273.18.11313. [DOI] [PubMed] [Google Scholar]
- 46.Wu BX, Clarke CJ, Hannun YA. Mammalian Neutral Sphingomyelinases: Regulation and Roles in Cell Signaling Responses. Neuromolecular Med. 2010 doi: 10.1007/s12017-010-8120-z. [DOI] [PMC free article] [PubMed] [Google Scholar]
- 47.Morales A, Lee H, Goni FM, Kolesnick R, Fernandez-Checa JC. Sphingolipids and cell death. Apoptosis. 2007;12:923–939. doi: 10.1007/s10495-007-0721-0. [DOI] [PubMed] [Google Scholar]
- 48.Reinehr R, Graf D, Haussinger D. Bile salt-induced hepatocyte apoptosis involves epidermal growth factor receptor-dependent CD95 tyrosine phosphorylation. Gastroenterology. 2003;125:839–853. doi: 10.1016/s0016-5085(03)01055-2. [DOI] [PubMed] [Google Scholar]
- 49.Greim H, Trulzsch D, Czygan P, Rudick J, Hutterer F, Schaffner F, et al. Mechanism of cholestasis. 6. Bile acids in human livers with or without biliary obstruction. Gastroenterology. 1972;63:846–850. [PubMed] [Google Scholar]
- 50.Koga H, Sakisaka S, Ohishi M, Sata M, Tanikawa K. Nuclear DNA fragmentation and expression of Bcl-2 in primary biliary cirrhosis. Hepatology. 1997;25:1077–1084. doi: 10.1002/hep.510250505. [DOI] [PubMed] [Google Scholar]
- 51.Lee JY, Leonhardt LG, Obeid LM. Cell-cycle-dependent changes in ceramide levels preceding retinoblastoma protein dephosphorylation in G2/M. Biochem J. 1998;334 ( Pt 2):457–461. doi: 10.1042/bj3340457. [DOI] [PMC free article] [PubMed] [Google Scholar]
- 52.Lister MD, Ruan ZS, Bittman R. Interaction of sphingomyelinase with sphingomyelin analogs modified at the C-1 and C-3 positions of the sphingosine backbone. Biochim Biophys Acta. 1995;1256:25–30. doi: 10.1016/0005-2760(94)00249-x. [DOI] [PubMed] [Google Scholar]
- 53.Qiao L, Yacoub A, Studer E, Gupta S, Pei XY, Grant S, et al. Inhibition of the MAPK and PI3K pathways enhances UDCA-induced apoptosis in primary rodent hepatocytes. Hepatology. 2002;35:779–789. doi: 10.1053/jhep.2002.32533. [DOI] [PubMed] [Google Scholar]
- 54.Osawa Y, Seki E, Adachi M, Suetsugu A, Ito H, Moriwaki H, et al. Role of acid sphingomyelinase of Kupffer cells in cholestatic liver injury in mice. Hepatology. 2010;51:237–245. doi: 10.1002/hep.23262. [DOI] [PubMed] [Google Scholar]
- 55.Canbay A, Feldstein AE, Higuchi H, Werneburg N, Grambihler A, Bronk SF, et al. Kupffer cell engulfment of apoptotic bodies stimulates death ligand and cytokine expression. Hepatology. 2003;38:1188–1198. doi: 10.1053/jhep.2003.50472. [DOI] [PubMed] [Google Scholar]
- 56.Takiya S, Tagaya T, Takahashi K, Kawashima H, Kamiya M, Fukuzawa Y, et al. Role of transforming growth factor beta 1 on hepatic regeneration and apoptosis in liver diseases. J Clin Pathol. 1995;48:1093–1097. doi: 10.1136/jcp.48.12.1093. [DOI] [PMC free article] [PubMed] [Google Scholar]
Associated Data
This section collects any data citations, data availability statements, or supplementary materials included in this article.


