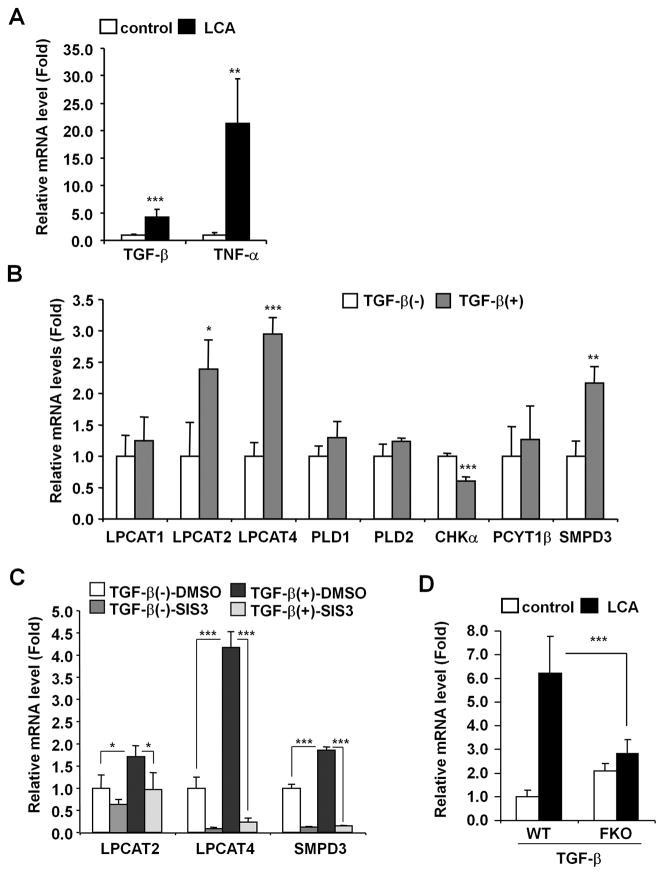
Figure 6. LCA induces Lpcat2/4 and Smpd3 expression through TGF-β-SMAD3 signaling.
(A) qPCR analysis of TGF-β and TNF-α mRNAs in liver. Expression was normalized to 18S ribosomal RNA and each bar represents the mean value and SD (n=5–6). Significance was determined with an unpaired t test (*, P<0.05; **P<0.01; ***, P<0.001). (B) qPCR analysis of LCA-induced genes in primary hepatocytes. Five ng of active TGF-β protein was subject to primary hepatocytes. Six hours after, the cells were collected and lysed for qPCR analysis. Expression was normalized to 18S ribosomal RNA and each bar represents the mean value and SD (n=4). Significance was determined with unpaired t test (*, P<0.05; **, P<0.01; ***, P<0.001). (C) qPCR analysis of LPCAT2/4 and SMPD3 mRNAs in primary hepatocytes after treatment with the SMAD3 inhibitor SIS3. Primary hepatocytes were incubated with 10 μM of SIS3 (0.1% of DMSO as vehicle) before 5 ng of active TGF-β protein was added. Six hours after the addition of TGF-β, the cells were collected and lysed for qPCR analysis of mRNA. Messenger RNA expression was normalized to 18S ribosomal RNA and each bar represents the mean value and SD (n=3). Significance was determined with one-way ANOVA followed by Tukey’s test (*, P<0.05; ***, P<0.001). (D) qPCR analysis of TGF-β mRNA in the livers of wild-type and Fxr-null mice. Expression was normalized to 18S ribosomal RNA and each bar represents the mean value and SD (n=5–6). Significance was determined with one-way ANOVA followed by Bonferroni’s test (***, P<0.001).

