Abstract
Detection and classification of nanoparticles is important for environmental monitoring, contamination mitigation, biological label tracking, and bio-defense. Detection techniques involve a trade-off between sensitivity, discrimination, and speed. This paper presents a material-specific dual-color common-path interferometric detection system. Two wavelengths are simultaneously used to discriminate between 60 nm silver and 80 nm diameter gold particles in solution with a detection time of τ ≈ 1 ms. The detection technique is applicable to situations where both particle size and material are of interest.
Growing use of technology, fabrication, and materials on the nanometer scale has lead to an explosion in both academic and commercial interest in the detection of particulate matter on the order of ~100 nm. The controlled production of semiconductor and metal nanoparticles has produced applications ranging from single photon sources to new labels for biological imaging1,2 and potential cancer treatments.3,4 The unintended presence of nanoparticles can lead to process contamination5 and long-term environmental and health issues.6,7 Detection and identification of trace matter is a useful tool in providing protection against possible explosive material.8,9 To keep pace with the decreasing size and increasing variety of nanoparticles techniques with improved sensitivity, speed and discrimination capability are needed.
Optical detection methods have been shown to be both sensitive and versatile.10–13 Many common optical detection techniques use elastically scattered light. The scattered field of a spherical nanoparticle can be approximated by Es ∝ k3αEi where k is the wavevector, Ei is the incident field and
| (1) |
is the polarizability of the nanoparticle. Eq. (1) illustrates that the scattered field depends on the radius of the particle R, the material of the particle through its dielectric constant εp and the surrounding environment εm. Assuming the nanoparticles are immersed in a known environment, changes in scattering amplitude can be driven by either a change in the particle size (S[R]) or material (M[εp]). To have the greatest versatility, detection schemes using scattered fields should differentiate between these two effects. The objective of the detection scheme introduced here is to differentiate between changes in S(R) and M(εp) with high sensitivity and in real time.
Spectroscopic methods for classifying nanoparticles have been demonstrated,14–16 however, these are limited to fixed particles and longer integration times, constraining their applications. Using a single wavelength enables shorter detection times by illuminating the nanoparticles with sufficient intensity to reduce the integration time. The most promising single wavelength detection methods involve use of a reference field to interfere with the elastically scattered field. Interferometric detection has been shown to be highly sensitive17,18 and capable of real-time detection,19,20 but a lack of material-specific information leads to an ambiguity between particle size and material influences on the scattered field amplitude. One solution for resolving the ambiguity is to measure the scattered field at two wavelengths to gain information about the slope of the scattering spectrum. Some previous work has implemented interferometric detection using two wavelengths for background suppression21,22 but not for direct material identification. This letter proposes a common-path interferometric technique using two wavelengths to detect and discriminate nanoparticles in real time.
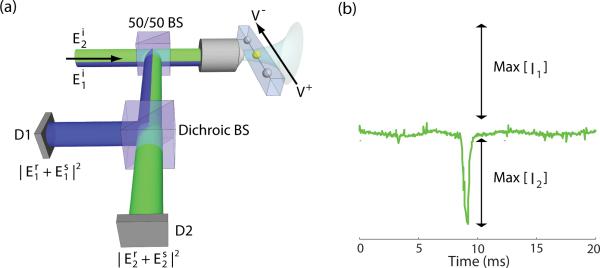
The experimental configuration is shown in Figure 1(a). Particles are illuminated simultaneously with two lines from a Krypton-Argon mixed-gas laser, λ1 = 488 nm and λ2 = 531 nm, through a 1.4 NA oil-immersion microscope objective. The objective focuses the laser into a 15 μm long nanofluidic channel with cross section 500 nm × 400 nm, etched in fused-silica, connecting two reservoirs. Fabrication of the nanofluidic channels is detailed elsewhere.23 The particles are moved through the channel using electro-osmotic flow by applying a voltage across the channel reservoirs. The applied voltage is selected to give a transit time τ ≈ 1 ms. The illumination objective collects the scattered light of the particle along with a reflected reference field from the fused-silica/water interface in the nanofluidic channel. The wavelengths are separated by a dichroic beam splitter and recorded by a photodiode with a 10 kHz bandwidth. Figure 1(b) shows the signal for a passing particle that is detected by both wavelengths simultaneously. The signal at wavelength λ2 has been inverted for illustrative purposes. The lower frequency oscillation of the background is caused by pointing instabilities due to mechanical vibrations and air currents which can be eliminated by further isolating the experimental setup.
Figure 1.
Dual-wavelength common-path interferometric detection setup. (a) 1.4 NA oil immersion objective focuses a laser into a nanofluidic channel which transports particles through the focus. The scattered light along with the reference beam from the fused silica/water interface is collected by the focusing objective. A dichroic beam splitter directs the two wavelengths to separate detectors. (b) Signal of a particle that is detected by both wavelengths simultaneously. The signal from the second detector has been inverted for illustration purposes. The maximum amplitude used in the signal computations is indicated.
The intensity of the interferometric signal for each detector is
| (2) |
where Er is the reflected reference field, Es is the scattered field, γ is the visibility and Δϕ is the phase difference between the reference and scattered fields. All of the parameters are, in general, a function of wavelength. The reference field intensity contribution is eliminated by subtracting the intensity value when no particle is present. Additionally, each wavelength is normalized by the reference field to correct for variations in the incident beam power. The resulting normalized signal is
| (3) |
Substituting for the scattered signal |Es| ≈ k3α|Ei| and the reference signal |Er| ≈ r|Ei| the corrected detector signal can be simplified to
| (4) |
where r is the reflection coefficient at the fused-silica/water interface. The normalized signal has a scattering term which scales with particle size as R6 (c.f. 1) and an interferometric term which scales as R3. Assuming the particles being detected are small, i.e. ~100 nm in diameter, the scattered field is negligible and only the interferometric term is considered.
To test the experimental setup, a mixture of 60 nm diameter silver particles and 80 nm diameter gold particles, in water, were flowed through a nanofluidic channel and detected. This combination of particle size and material was chosen to produce similar scattering amplitudes. Figure 2 shows example time traces of the normalized detector signals at (a) 488 nm and (c) 531 nm. The normalized signals were corrected for the k3 wavelength dependence while the reference beam reflectivity and visibility differences were considered negligible. The maximum value, as measured between the background and the peak of the detected signal shown in Figure 1(b), from each particle event was used to construct a histogram of amplitude values at both wavelengths. As expected, the histograms at both (b) 488 nm and (d) 531 nm are unimodal, despite the presence of two particle species.
Figure 2.
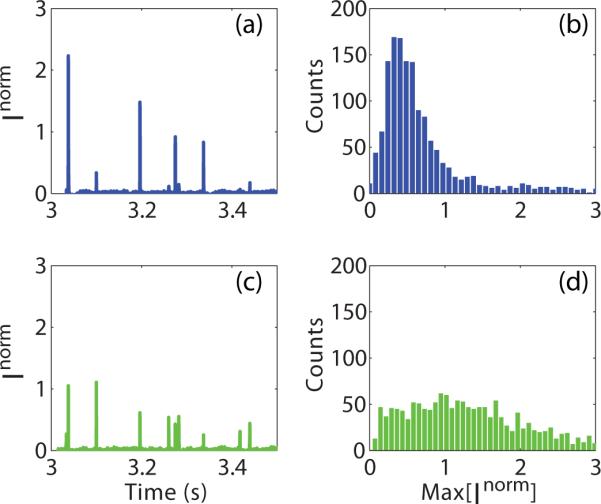
Individual wavelength data for a mixture of 60 nm silver and 80 nm gold particles in water. (a) An example time trace of the background-subtracted and normalized detector signal of the 488 nm wavelength. (b) Histogram of maximum signal values for each particle crossing of the 488 nm wavelength. (c) An example time trace of the background-subtracted and normalized detector signal of the 531 nm wavelength. (d) Histogram of maximum signal values for each particle crossing of the 531 nm wavelength.
Distinguishing between the two particle materials is accomplished by defining a composite signal constructed from the maximum values of a detected signal when a single particle passes through the laser beams:
| (5) |
The subscripts on the normalized detector signals refer to the wavelengths λ1 and λ2 used in the experiment. Assuming a known calibration target is used to correct for the differences in the reflection, wavevector, and the visibility between wavelengths, the resulting material indicator is
| (6) |
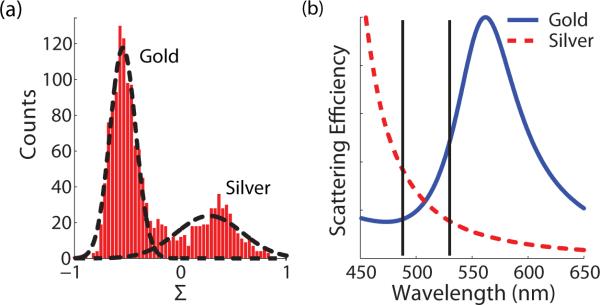
The value of Σ varies from −1 to 1 and is equivalent to the average slope of the material polariz-ability between λ1 and λ2. Normalizing by the summed intensities eliminates the R3 amplitude dependence so only changes in scattering properties due to material are present in Σ. Figure 3(a) displays the histogram of this composite signal computed using the previous data. The histogram has two distinct peaks indicating a mixture of materials with slopes of opposite sign in their polar-izability between the detected wavelengths. Figure 3(b) shows the scattering efficiencies for gold and silver particles immersed in water24. The wavelengths used in the experiment are indicated by vertical lines.
Figure 3.
(a) Histogram of the material-specific signal, Σ, clearly showing the existence of two different materials in the mixture. The dotted lines represent a bimodal Gaussian fit to the data. (b) Theoretical scattering efficiencies for 80 nm gold (solid) and 60 nm silver (dashed) spheres immersed in water. The solid vertical lines indicate the two wavelengths used in the experiment.
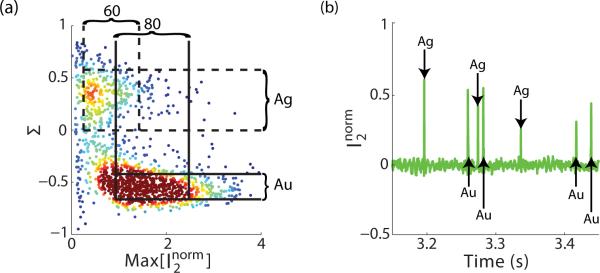
To better illustrate the effects of size and material on the collected signals, a density scatter plot of Σ vs for ~1500 individual detection events is shown in Figure 4(a). The vertical(horizontal) lines represent one standard deviation of for silver(dashed) and gold(solid). The significant overlap between the values obscures the presence of two distinct species. In contrast, there is little overlap between the Σ values, allowing easy discrimination between 60 nm silver and 80 nm gold. In fact, this can be made in real time, as shown in Figure 4(b), where Σ is used to assign a material to each detection event.
Figure 4.
(a) Density scatter plot of the normalized maximum scattering amplitude at λ =531 nm vs S. The lines represent one standard deviation from the mean for silver(dashed) and gold (solid). (b) Time trace of the normalized amplitude at λ =531 nm with the material of each particle identified using its Σ value.
The ability of this detection scheme to differentiate materials is limited by standard deviation of Σ for each species. Two effects contribute to the variation in signal amplitude, and therefore the width of Σ. The first is the intrinsic size and shape variations of the sample distribution. These physical variations manifest themselves in shifts of the plasmon resonance,25 changing the slope measured by Σ. The second effect is the phase uncertainty, Δϕ, between the reference beam and the scattered field at each wavelength. Phase uncertainty is caused by both drift in the interferometer and variation of the particle trajectory through the focus in the nanofluidic channel.
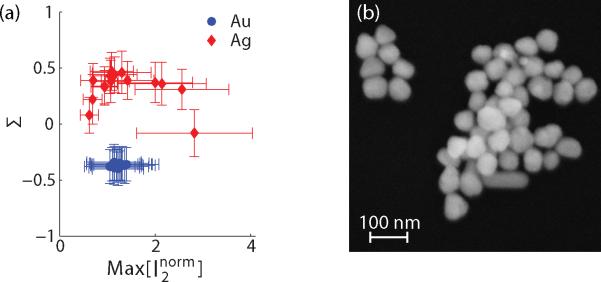
To separate the effects of phase uncertainty and particle size variations it is necessary to measure a distribution with a fixed size. Unfortunately, all manufactured nanoparticles have some intrinsic size distribution. An alternative approach is to repeatedly interrogate the same particle. To accomplish this, the voltage applied for electro-osmotic flow is switched in a feedback loop such that the flow is reversed after a particle passes through the laser focus, effectively “trapping” a single particle in the nanofluidic channel. A detailed description of this trapping method is presented elsewhere.26 The trapping method was used on unmixed solutions of 60 nm silver and 80 nm gold in separate nanofluidic channels. Figure 5(a) is a scatter plot in which each data point represents the mean value of the normalized maximum scattering amplitude at λ=531 nm and Σ of ~1000 measurements on a single particle. The gold particle signal means are all closely clustered indicating that the majority of the distribution width is caused by phase uncertainties. The silver particles, however, have a large intra-species variation that drives the distribution width. A scanning electron micrograph (SEM) of the silver particles, shown in Figure 5(b), confirms the non-uniformity of the sample seen in the scatter plot. Measurements of ~70 particles, in similar images, yields a mean diameter of 60 ± 15 nm with some rod shaped particles exceeding 100 nm in length.
Figure 5.
(a) Scatter plot where each point represents the mean value of a single trapped particle. The error bars indicate one standard deviation. (b) SEM image of 60 nm silver showing the sample distribution size and shape irregularity.
Further improvements in material detection sensitivity can be made with the elimination of the unknown phase. Multiple approaches have been recently demonstrated that can independently measure the amplitude and phase of the elastically scattered particle signal. One approach is to frequency-shift the reference beam and use a heterodyne interferometric detection technique to measure both the phase and amplitude of the signal.26 Alternatively, a dual-phase approach using two phase-shifted measurements to estimate phase and amplitude has also been demonstrated.27 Both phase estimation techniques can be extended to multiple wavelengths by the inclusion of additional optics and detectors. A spectroscopic technique employing a variation of standard differential interference microscopy for phase estimation28 could also be adapted to improve the material detection.
The dual-color, common-path interferometric setup detailed in this paper has shown the ability to decouple material-specific (M[εp]) and size-dependent (S[R]) scattering behavior while still maintaining the sensitivity and real-time detection capability of previously developed techniques. Material classification is necessary in many monitoring and detection applications. More specifically, this technique can be used to construct a detection device to screen for small amounts of particulate matter of a material with a unique scattering spectrum. Visible wavelengths were used in this paper to identify metal scatters, however, by shifting the detection to infrared wavelengths the detection and identification of biological and chemical materials is possible. The sensitivity and discrimination capability of the setup can be extended by removing the phase uncertainty and increasing the number of detection wavelengths allowing for the detection and classification of a larger variation of particle materials.
Acknowledgement
This work was supported by NIH (grant 1R21AI085543-01A1). The authors would like to thank John Lesoine for assistance in the fabrication of the nanofluidic channels.
References
- (1).Alivisatos P. Nat. Biotechnol. 2004;22:47–52. doi: 10.1038/nbt927. [DOI] [PubMed] [Google Scholar]
- (2).Yguerabide J, Yguerabide EE. Anal Biochem. 1998;262:157–176. doi: 10.1006/abio.1998.2760. [DOI] [PubMed] [Google Scholar]
- (3).Lal S, Clare SE, Halas NJ. Acc. Chem. Res. 2008;41:1842–1851. doi: 10.1021/ar800150g. [DOI] [PubMed] [Google Scholar]
- (4).Yezhelyev MV, Gao X, Xing Y, Al-Hajj A, Nie S, O'Regan RM. Lancet Oncol. 2006;7:657–667. doi: 10.1016/S1470-2045(06)70793-8. [DOI] [PubMed] [Google Scholar]
- (5).Doering R, Nishi Y, editors. Handbook of Semiconductor Manufacturing Technology. 2nd ed. CRC Press; Boca Raton: 2007. [Google Scholar]
- (6).Hester RE, Harrison RM, editors. Nanotechnology: consequences for human health and the environment. Royal Society of Chemistry; Cambridge: 2007. [Google Scholar]
- (7).Colvin V. Nat. Biotechnol. 2003;21:1166–1170. doi: 10.1038/nbt875. [DOI] [PubMed] [Google Scholar]
- (8).Moore D. Rev. Sci. Instrum. 2004;75:2499–2512. [Google Scholar]
- (9).Steinfeld J, Wormhoudt J. Annu. Rev. Phys. Chem. 1998;49:203–232. doi: 10.1146/annurev.physchem.49.1.203. [DOI] [PubMed] [Google Scholar]
- (10).Vollmer F, Arnold S. Nature Methods. 2008;5:591–596. doi: 10.1038/nmeth.1221. [DOI] [PubMed] [Google Scholar]
- (11).Boyer D, Tamarat P, Maali A, Lounis B, Orrit M. Science. 2002;297:1160–1163. doi: 10.1126/science.1073765. [DOI] [PubMed] [Google Scholar]
- (12).Schultz S, Smith D, Mock J, Schultz D. Proc. Natl. Acad. Sci. USA. 2000;97:996–1001. doi: 10.1073/pnas.97.3.996. [DOI] [PMC free article] [PubMed] [Google Scholar]
- (13).Arbouet A, Christofilos D, Del Fatti N, Vallee F, Huntzinger J, Arnaud L, Billaud P, Broyer M. Phys. Rev. Lett. 2004;93:127401. doi: 10.1103/PhysRevLett.93.127401. [DOI] [PubMed] [Google Scholar]
- (14).Lindfors K, Kalkbrenner T, Stoller P, Sandoghdar V. Phys. Rev. Lett. 2004;93:037401. doi: 10.1103/PhysRevLett.93.037401. [DOI] [PubMed] [Google Scholar]
- (15).Prikulis J, Svedberg F, Kall M, Enger J, Ramser K, Goksor M, Hanstorp D. Nanolet. 2004;4:115–118. [Google Scholar]
- (16).Willets KA, Van Duyne RP. Annu. Rev. Phys. Chem. 2007;58:267–297. doi: 10.1146/annurev.physchem.58.032806.104607. [DOI] [PubMed] [Google Scholar]
- (17).Batchelder JS, Taubenblatt MA. Appl. Phys. Lett. 1989;55:215–217. [Google Scholar]
- (18).van Dijk MA, Lippitz M, Stolwijk D, Orrit M. Opt. Express. 2007;15:2273–2287. doi: 10.1364/oe.15.002273. [DOI] [PubMed] [Google Scholar]
- (19).Ignatovich FV, Novotny L. Phys. Rev. Lett. 2006;96:013901. doi: 10.1103/PhysRevLett.96.013901. [DOI] [PubMed] [Google Scholar]
- (20).Ignatovich FV, Topham D, Novotny L. IEEE J. Sel. Top. in Quant. Elec. 2006;12:1292–1300. [Google Scholar]
- (21).Jacobsen V, Stoller P, Brunner C, Vogel V, Sandoghdar V. Opt. Expr. 2006;14:405–414. doi: 10.1364/opex.14.000405. [DOI] [PubMed] [Google Scholar]
- (22).Sun W, Wang G, Fang N, Yeung ES. Analytical Chemistry. 2009;81:9203–9208. doi: 10.1021/ac901623b. [DOI] [PubMed] [Google Scholar]
- (23).Ignatovich FV, Hartschuh A, Novotny L. J. Mod. Opt. 2003;50:1509–1520. [Google Scholar]
- (24).Bohren CF, Huffmann DR. Absorption and Scattering of Light by Small Particles. Wiley; New York: 1983. [Google Scholar]
- (25).Kreibig U, Vollmer M. Optical Properties of Metal Clusters. Springer-Verlag; Berlin: 1995. [Google Scholar]
- (26).Mitra A, Deutsch B, Ignatovich F, Dykes C, Novotny L. ACS Nano. 2010;4:1305–1312. doi: 10.1021/nn901889v. [DOI] [PMC free article] [PubMed] [Google Scholar]
- (27).Deutsch B, Beams R, Novotny L. Appl. Opt. 2010;49:4921–4925. doi: 10.1364/AO.49.004921. [DOI] [PMC free article] [PubMed] [Google Scholar]
- (28).Stoller P, Jacobsen V, Sandoghdar V. Opt. Lett. 2006;31:2474–2476. doi: 10.1364/ol.31.002474. [DOI] [PubMed] [Google Scholar]


