Abstract
An investigation of the conformational properties of methyl β-maltoside, methyl α-cellobioside and methyl β-cellobioside disaccharides, using NMR spectroscopy and molecular dynamics (MD) techniques, is presented. Emphasis is placed on validation of a recently presented force field for hexopyranose disaccharides followed by elucidation of the conformational properties of two different types of glycosidic linkages, α-(1→4) and β-(1→4). Both gas-phase and aqueous-phase simulations are performed to gain insight into the effect of solvent on the conformational properties. A number of transglycosidic J-coupling constants and proton-proton distances are calculated from the simulations and are used to identify the percent sampling of the three glycosidic conformations, syn, anti-φ and anti-ψ, and, in turn, describe the flexibility around the glycosidic linkage. The results show the force field to be in overall good agreement with experiment, though some very small limitations are evident. Subsequently, a thorough hydrogen bonding analysis is performed to obtain insights into the conformational properties of the disaccharides. In methyl β-maltoside competition between HO2′-O3 intramolecular hydrogen bonding and intermolecular hydrogen bonding of those groups with solvent lead to increased sampling of syn φ,ψ conformations and better agreement with NMR J-coupling constants. In methyl α and β-cellobioside, O5′-HO6 and HO2′-O3 hydrogen bonding interactions are in competition with intermolecular hydrogen bonding involving the solvent molecules. This competition leads to retention of the O5′-HO3 hydrogen bond and increased sampling of the syn region of the φ/ψ map. Moreover, glycosidic torsions are correlated to the intramolecular hydrogen bonding occurring in the molecules. The present results verify that in the β-(1→4)-linkage intramolecular hydrogen bonding in the aqueous phase is due to the decreased ability of water to successfully compete for the O5′ and HO3 hydrogen bonding moieties in contrast to that occurring between the O5′ and HO6 atoms in this α-(1→4)-linkage.
Keywords: disaccharides, carbohydrates, cellobioside, maltoside, CHARMM, NMR coupling, NOE, molecular dynamics
INTRODUCTION
Polysaccharides, built from repeating pyranose monosaccharide units like glucose and galactose, play very important roles in nature with functions ranging from structure to energy storage. These polymers are also essential components in a number of commercial products, including as excipients in drugs1 and their potential role in replacing fossil fuels2 has recently taken front stage.3 To further facilitate the utilization of these molecules, understanding the physical properties at a molecular level of detail is essential.
Polysaccharides have different inherent properties based on the type of linkage they possess. For instance, cellulose, which consists of repeating units of β-(1→4)-linked D-glucose, is the structural component of plant cell walls. Cellulose is indigestible to humans, but starch, which is made up of repeating units of α-(1→4)-linked D-glucose, is a vital compound produced by green plants, where it is used for energy storage as well as making it a major food source for human beings. Therefore, by changing only the anomeric configuration at the glycosidic linkage, the compound serves a completely different purpose in nature. While the anomeric configuration of the linkage affects the ability of enzymes to act on the linkages, differences in their conformational properties associated with the different linkage types are also important for the biological functions of these compounds. However, information is still lacking about their intrinsic conformational properties and the impact of the glycosidic linkage type on those properties.
One important unsolved question is the significance of intramolecular hydrogen bonding and its role in the conformation about the glycosidic linkages. For example, based on the short interatomic distance between O5′ and O3 in the crystal structure of methyl β-cellobioside4, it is inferred that compounds containing the β-(1→4)-linkage form an intramolecular hydrogen bond between the O5′ and HO3 atoms. However, since hydrogen atoms are not well resolved in x-ray crystallography this hypothesis has not been rigorously tested. In addition, the extent of competition between intramolecular hydrogen bonding and intermolecular water interactions when the molecules are in solution is still unclear. Therefore, conformational properties of these molecules in fully solvated systems need to be investigated to gain a further understanding of the structural properties in a biologically relevant environment.
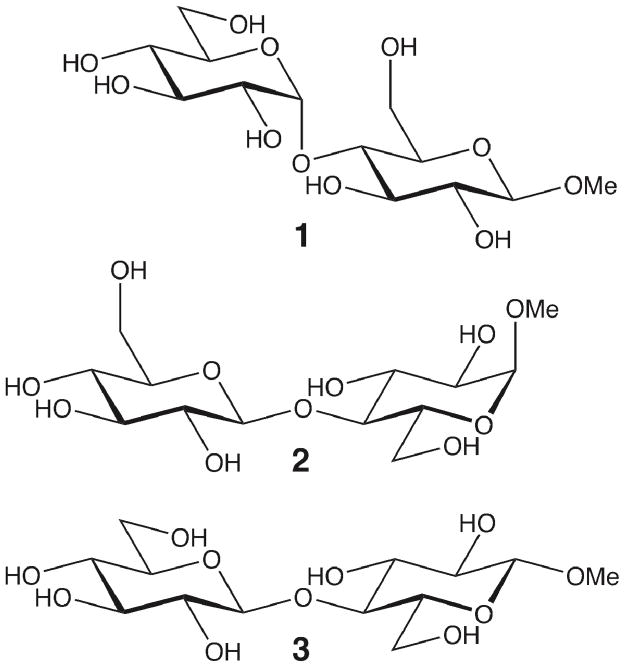
In this study, we investigate the conformational properties of methyl β-maltoside (1) and methyl α- and β-cellobiosides (2, 3) to elucidate the impact of different types of glycosidic linkages using NMR spectroscopy and molecular dynamics (MD) simulations. Methyl maltoside is composed of two monosaccharide units of D-glucopyranose (where the reducing end of the molecule contains an O-methyl group) with a α-(1→4)-linkage and methyl cellobioside is similarly composed of two units of D-glucopyranose but with a β-(1→4)-linkage instead. The structures of methyl β-maltoside and methyl α- and β-cellobioside are given in Figure 1.
Figure 1.
Structure of methyl β-maltoside (1) and methyl α- and β-cellobioside (2,3).
NMR spectroscopy is the most versatile technique for studying molecules in solution since atomic resolution information can be obtained for entities ranging from small organic molecules to large protein complexes. A large number of NMR observables are accessible that may be used to quantify the structure and dynamics of molecules in solution. As with proteins and nucleic acids, those for carbohydrates5 include proton-proton NOEs, homo- and heteronuclear coupling constants, 13C and 15N nuclear spin-relaxation rates, 1H,1H and 1H,13C residual dipolar couplings, cross-correlated relaxation rates, and solute-solvent exchange rates of hydroxyl and amide protons. To facilitate these studies an array of 1D to nD NMR experiments are utilized in combination with uniform or site-specific isotope labeling employing in particular 2H, 13C, 15N and 19F nuclei. The interplay between multiple NMR experiments, different nuclei and various magnetic field strengths therefore facilitate the extraction of a range of experimental NMR data that can be used for analysis of molecular structure, conformation and dynamics.
MD simulations can be a very valuable tool in gaining insight into the conformational properties of compounds. Unlike NMR spectroscopy, which yields results of representative ensembles of molecules and states, MD simulations allow for investigation of atomic details of individual molecules and their environments in a time-dependent fashion. Unfortunately, MD simulation results are only as good as the force field being used. Therefore, validation of the force field parameters, using data from experimental techniques like NMR spectroscopy, is necessary. Recently, an additive all-atom CHARMM force field for hexopyranose disaccharides6,7 was presented and shown to give excellent agreement with a number of experimental observables. In this investigation, further validation of the disaccharide force field parameters is presented as well as a thorough analysis of the conformational properties of methyl β-maltoside and methyl α- and β-cellobioside, information that can shed light on the relationship of the conformational properties of these molecules to their biological functions.
EXPERIMENTAL METHODS
NMR experiments were carried out in D2O at a concentration of 80 mM for compounds 1 and 2 and 6 mM for methyl-d3 3,5,6a,6b,3′,5′,6a′,6b′-octadeuterio-β-cellobioside (3-d11).8 Measurements were made at 30 ºC on a 700 MHz Bruker AVANCE III spectrometer equipped with a 5 mm TCI Z-gradient CryoProbe and on a 600 MHz Varian Inova spectrometer equipped with a PFG triple-resonance probe. Temperature calibration with MeOD-d49 was carried out prior to each set of experiments.
Proton-proton cross-relaxation rates were measured using the 1D 1H,1H-DPFGSE T-ROESY experiment10 and a 1D 1H,1H-DPFGSE NOESY11 experiment with zero-quantum suppression.12 Selective excitations of H1, H1′ and H4 resonances were enabled using 30–40 ms long SNOB-2 shaped pulses. For each excited resonance 3–9 different mixing times between 40 ms and 450 ms were used with a relaxation delay of >5×T1. The T-ROESY spin-lock was applied with γB1/2π in the range 2.5 to 3.5 kHz. All spectra were baseline corrected and integrated with the same limits at all mixing times. NMR spectra were analyzed as described by Dixon et al.13 1H,1H cross-relaxation rates were obtained from the intercept of the ordinate axis. Effective proton distances were calculated using the following relationship:
| (1) |
in which r is the distance between protons i and j and σ is the corresponding cross-relaxation rate. The experimental uncertainty of the effective proton-proton distances based on cross-relaxation rates is estimated to be less than 6%. The reference distance was obtained from an intra-residue proton pair.
Measurements of the transglycosidic carbon–proton coupling constants were performed with the J-HMBC experiment.14 Scale factors of approximately 21, calculated from where Δ was at least 60% of the inverse of the smallest coupling constant to be measured, were used to scale splitting of the doublet components in the indirect dimension. Spectral widths of 6 ppm for 1H and 60 ppm for 13C were used. The experiments were performed with 512×3072 points in F1 and F2 respectively, and 32 – 48 scans per t1-increment with the echo/anti-echo method. Forward linear prediction to 1024 points in F1 and subsequent zero-filling to 4096×16384 points were applied prior to Fourier transformation. Cross-peak separation in F1, corresponding κ ×3JC,H, were extracted from 1D-projections of the resonances of interest. The experimental uncertainty of the measured 3J couplings is estimated to be less than 0.25 Hz. In addition, the uncertainty of the most recently developed Karplus relationships for 3J couplings in oligosaccharides is estimated to be less than 0.50 Hz. In comparing 3J couplings determined by NMR experiments and those calculated from the MD ensembles a deviation larger than 0.75 Hz is regarded as a discrepancy between experiment and simulation and consequently indicating limitations in the force field.
A 1D proton-decoupled 13C NMR experiment of [1′-13C]215 in D2O at 303 K was recorded with an acquisition time of 4 s and an interscan delay of 1 s at a 13C NMR frequency of 125 MHz on a Bruker AVANCE II spectrometer. Prior to Fourier transformation the FID was multiplied by a Lorentzian-Gaussian window function (lb = −2, gb = 0.4) in order to measure three-bond 13C,13C coupling constants.
COMPUTATIONAL METHODS
Empirical force field calculations were performed using the program CHARMM16. In this study, the recently parametrized additive all-atom CHARMM hexopyranose disaccharide6,7 force field is used for all calculations. Water was treated explicitly using the CHARMM modified TIP3P model17,18.
Aqueous phase MD simulations were performed in the constant pressure – constant temperature (NPT) ensemble using a Nosé-Hoover thermostat19,20 and a Langevin piston barostat21. The reference pressure was set to 1 atm and the reference temperature was 298K. All of the condensed-phase simulations were performed using a leapfrog integrator22 with a 1 fs timestep. The long-range electrostatic interactions were treated with a Particle Mesh Ewald (PME) method23 with a real space cutoff of 12 Å. The long-range Lennard-Jones interactions were treated with a force-switched smoothing function24 in the 10–12 Å range and an isotropic long-range pressure correction was applied beyond the truncation distance. The SHAKE algorithm25 was used to constrain all hydrogen atom bonds to their equilibrium length and to maintain a rigid TIP3P17 water geometry by constraining a virtual bond connecting the two hydrogen atoms as well as the O-H bonds. Two disaccharides were placed in a cubic box of 1100 TIP3P17 waters with an approximate box length of 32 Å to simulate the concentrations of 80 mM in the NMR experiments. During the simulations, the disaccharide-disaccharide interactions were minimal and, therefore, are assumed to have little effect on the conformational properties. The disaccharides came within 2 Å of each other during less than 5% of the simulation time. In order to obtain better sampling, 5 runs with different initial velocities were performed for each compound. Each system was first energy minimized and then equilibrated for 500 ps using harmonic restraints with a force constant of 1 (particle mass) kcal mol−1 Å−2 amu−1 on only the solute molecules. Each production run was performed for 50 ns with all restraints removed, totaling 250 ns for each system.
Gas-phase calculations were performed using Langevin dynamics at a temperature of 298K with infinite nonbond cutoffs. The equations of motion were integrated using a 1 fs timestep. Convergence of the gas phase simulations was slightly more difficult; therefore, 15 simulations with different initial velocities were run for 1 microsecond each.
NMR coupling constants for the glycosidic torsion angles were calculated from the dihedral angle values obtained from the aqueous-phase simulations. During the simulations, the dihedral angle values were monitored every 1 ps, and coupling constants were calculated using modified Karplus equations. These were heteronuclear proton-carbon couplings over three bonds, developed by Tvaroska et al. and Cloran et al. respectively, and are given in Eqs. 2 and 3.26,27
| (2) |
| (3) |
where φ is the C-O-C-H dihedral angle at the glycosidic linkage. Widmalm and coworkers parametrized the Karplus equaton for the heteronuclear proton-carbon coupling shown in Eq, 4 and 528
| (4) |
| (5) |
In the equations above, φH = H1′-C1′-O4-C4 and ψH = C1′-O4-C4-H4. The phase shift, Δ, which is dependent on the stereochemistry of the linkage between the sugar residues, is −12° for α-D-hexopyranosides and +12° for β-D-hexopyranoside. The variable in-plane effect factor, κ, was set to 8 and φO5′, which is the torsion involving the O5′ oxygen atom of the non-reducing sugar residue, was calculated from the simulations. The carbon-carbon NMR coupling constant 3JCOCC was calculated from a simplified version of the Karplus equation developed by Bose et al.29,
| (6) |
where φ is any of the C-O-C-C dihedrals across the glycosidic linkage. More specific Karplus equations were used to define the 3JCOCC coupling between the φC2′=C2′-C1′-O4-C4 as given by Eq. 7 and ψC3=C1′-O4-C4-C3 and ψC5=C1′-O4-C4-C5 as given by Eq. 8, where the CIP (constant in-plane) term is 0.0 and 0.6, respectively27.
| (7) |
| (8) |
In Eq. 8 ψ refers to either the ψC3=C1′-O4-C4-C3 or the ψC5=C1′-O4-C4-C5 dihedral. A newly parametrized Karplus equation for the 3JCOCC coupling is given in Equations 9 and 10.28
| (9) |
| (10) |
Once again, in Eq. 10 ψ refers to either the ψC3=C1′-O4-C4-C3 or the ψC5=C1′-O4-C4-C5 dihedral. For the above equations describing φC2′ and ψC3 the CIP was set to zero, whereas for equation 10 involving the ψC5 the CIP was set to 0.6. The coupling constants were calculated for each of the corresponding dihedral angles and then averaged over 1 ns for each solute molecule using 1 ps snapshots. Then each coupling constant, calculated every 1 ns, was averaged to obtain the average value and its standard deviation.
Effective proton-proton distances, rcalc, were calculated from the simulations using Eq. 11.
| (11) |
In Eq. 11, rsim are the values obtained from the simulations. From proton-proton distances, the percent population of the syn versus the anti-φ and anti-ψ conformers can be calculated using Eq. 12.30
| (12) |
Here x is the percent population of anti-conformations, is the average distance between protons in the syn-conformation taken to the −6 exponent, is the average distance between protons in the anti-conformations taken to the −6 exponent and is the experimental distance between protons H1′ and H4 taken to the −6 exponent, i.e., the effective distance from 1D T-ROESY or NOESY experiments. The averaged distances between protons in either the syn or anti-conformations were calculated from the MD simulations. The syn-conformation was defined as the region −120° < φ < 120° and −120° < ψ < 120° (φ = H1′–C1′–O4–C4 and ψ = C1′–O4–C4–H4). The anti-ψ conformation was defined by the region ψ< −120° or ψ > 120° and the anti-φ conformation was defined as the region φ< −120° or φ > 120° in the interval −180° to 180°.
RESULTS AND DISCUSSION
Cellobiose and maltose are the building blocks for cellulose and starch, respectively. Therefore, in order to better understand the conformational dynamics of oligo- and polysaccharides like cellulose and starch, a more thorough understanding of the conformational dynamics of disaccharides must be achieved. Disaccharides containing the β-(1→4)-linkage, like α- and β-cellobioside, are present in the syn-conformation at the global minimum in solution.31,32 This was also determined to be the case for maltose.33,34 The syn-conformation is described as the conformation in which the protons at the glycosidic linkage are on the same side of a plane defined as being perpendicular to the corresponding C-H bonds. However, more recently, it has been suggested that due to flexibility, there is some population of the anti-φ and anti-ψ conformations as well.30 In this investigation all conformations (syn, anti-φ and anti-ψ) were examined for all three compounds 1 – 3, including intramolecular hydrogen bonding occurring in the different conformations. Solvation effects were also examined in order to understand how water interactions affect the conformations of these compounds.
NMR analysis
NMR experiments were carried out on 1 – 3 to obtain 3J coupling constants and proton-proton cross-relaxation rates; the latter can subsequently be interpreted as effective proton-proton distances. For compounds 1 and 2 the J-HMBC experiment was employed to obtain transglycosidic 3JC,H coupling constants from the 2D NMR experiment in which the values scaled by a factor κ are extracted from the F1-dimension. This NMR technique has by its developers14 been estimated to have an experimental error of ±0.25 Hz and it is indeed satisfying to observe that e.g. the 3JC1′,H4 value of 5.0 Hz in 2 extracted herein is the same as that determined using a 13C-site specifically C1′-labeled compound.15 3JC,C data for compound 2 were also obtained from that study and further refined herein. For compound 3 the 3JC,H values were measured previously35 using an NMR experiment devised by Nishida et al.36 for measuring nJC,H coupling constants in organic compounds. The experimental error of this technique is estimated to be less than ±0.2 Hz, a span which has been observed in several studies.35,37 The experimental 3J data are compiled in Table 1.
Table 1.
Comparison of the 3J coupling constants calculated in the gas-phase and aqueous-phase results versus experiment. The values in parentheses are the standard deviations. Coupling constants are given in Hz.
| methyl β-maltoside (1) | methylα-cellobioside (2) | methylβ-cellobioside (3) | |||||||
|---|---|---|---|---|---|---|---|---|---|
| Calcgas | Calcsoln | Expt | Calcgas | Calcsoln | Expt | Calcgas | Calcsoln | Expt | |
| 3JH1′,C4 | 4.93c (0.30) | 3.75c (0.24) | 4.0 | 4.18c (1.86) | 2.78c (0.20) | 4.0 | 5.84c (1.37) | 2.81c (0.17) | 4.1a |
| 5.82d (0.45) | 4.29d (0.31) | 4.98d (2.58) | 3.03d (0.26) | 7.28d (1.90) | 3.07d (0.21) | ||||
| 5.14e (0.31) | 4.40e (0.24) | 4.47e (1.21) | 3.60e (0.21) | 5.61e (0.92) | 3.64e (0.17) | ||||
| 3JC1′,H4 | 4.94c (0.13) | 4.23c (0.33) | 4.6 | 5.29c (0.17) | 5.04c (0.20) | 5.0 | 5.38c (0.22) | 5.00c (0.19) | 5.3a |
| 5.83d (0.17) | 4.93d (0.46) | 6.29d (0.21) | 5.98d (0.29) | 6.41d (0.26) | 5.91d (0.28) | ||||
| 5.51f (0.15) | 4.67f (0.36) | 5.89f (0.20) | 5.60f (0.21) | 6.03f (0.26) | 5.55f (0.21) | ||||
| 3JC2′,C4 | 1.64g (0.22) | 2.67g (0.13) | 2.30g (1.31) | 3.32g (0.08) | 3.0b | 1.21g (0.93) | 3.32g (0.07) | ||
| 1.65h (0.22) | 2.94h (0.17) | 2.67h (1.46) | 3.80h (0.10) | 1.46h (1.02) | 3.79h (0.09) | ||||
| 2.09j (0.40) | 3.02j (0.10) | 2.52j (1.17) | 3.45j (0.06) | 1.57j (0.83) | 3.46j (0.06) | ||||
| 3JC1′,C3 | 0.97g (0.14) | 0.57g (0.14) | 0.95g (0.18) | 0.90g (0.19) | 0.7 | 1.14g (0.09) | 0.87g (0.16) | ||
| 1.93i (0.27) | 1.03i (0.22) | 1.89i (0.38) | 1.75i (0.28) | 2.26i (0.25) | 1.70i (0.24) | ||||
| 1.49k (0.17) | 0.39k (0.17) | 1.46k (0.22) | 1.40k (0.24) | 1.70k (0.11) | 1.36k (0.19) | ||||
| 3JC1′,C5 | 1.45g (0.19) | 2.30g (0.27) | 1.29g (0.25) | 1.48g (0.22) | 2.2 | 1.07g (0.25) | 1.53g (0.20) | ||
| 3.46i (0.36) | 5.05i (0.53) | 3.17i (0.46) | 3.52i (0.45) | 2.75i (0.45) | 3.61i (0.40) | ||||
| 2.07k (0.24) | 3.12k (0.32) | 1.88k (0.30) | 2.11k (0.27) | 1.61k (0.30) | 2.17k (0.25) | ||||
From reference 15.
From reference 35.
Using Equation 2; Tvaroska et al., reference 26
Using Equation 3; Cloran et al., reference 27
Using Equation 4; Säwén et al., reference 28
Using Equation 5; Säwén et al., reference 28
Using Equation 6; Bose et al., reference 29
Using Equation 7; Cloran et al., reference 27
Using Equation 8; Cloran et al., reference 27
Using Equation 9; Säwén et al., reference 28
Using Equation 10; Säwén et al., reference 28
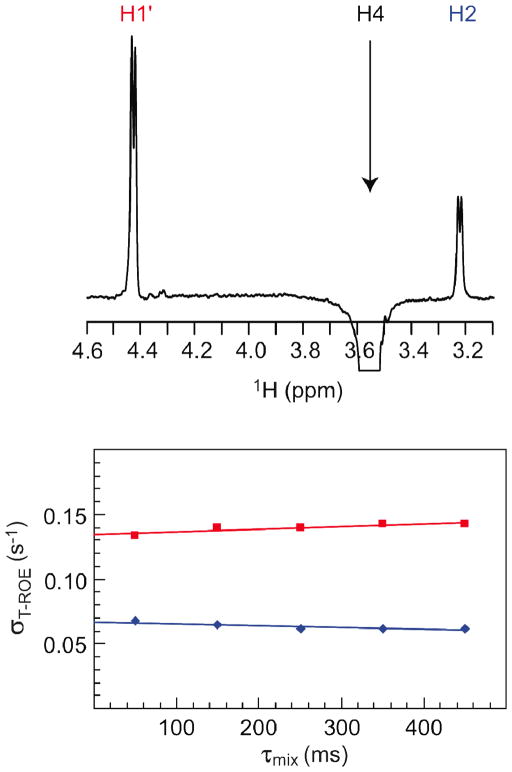
The proton-proton cross-relaxation rates were obtained for 1 by 1D 1H,1H-T-ROESY NMR experiments in which selective excitations of anomeric protons were carried out. For compound 2 experimental data were available from a previous study.30 For compound 3 both 1D 1H,1H-T-ROESY and 1H,1H-NOESY NMR experiments were utilized. In the latter case a partially deuterated compound was used in order to reduce spectral overlap and to facilitate accurate integration of resonances. It was sufficient to excite a single proton, viz., H4 since it is situated at the glycosidic linkage and dipole-dipole cross-relaxation readily occurs with H1′ across the glycosidic linkage and intraresidually with H2, for which the effective distance easily can be calculated from the MD simulation. A typical example of a 1D 1H,1H-T-ROESY spectrum is shown in Figure 2 together with plotted cross-relaxation data from which the cross-relaxation rates are obtained as the intercept of the ordinate axis.13 The effective proton distances are calculated using Equation 1 (vide infra) and the results of the 1D T-ROESY and NOESY experiments are compiled in Table 2 together with derived effective proton distances.
Figure 2.
1D 1H,1H-DPFGSE T-ROESY spectrum (top) of methyl-β-cellobioside (3-d11), with selective excitation of the resonance from H4 and a mixing time of 350 ms. Plot of Ij (τmix)/[τmix Ii] versus τmix (bottom) showing the cross-relaxation rates of H1′ (red) and H2 (blue).
Table 2.
Effective proton-proton distances from aqueous-phase simulations and NMR experiments for compounds 1 – 3. Distances are given in Å.
| methyl β-maltoside (1) | methyl α-cellobioside (2) | methylβ-cellobioside (3) | ||||
|---|---|---|---|---|---|---|
| Calc | Expt | Calc | Expt | Calc | Expt | |
| rH1,H2 | 3.06 | 2.41 | 2.41b [9.8]f | 3.06 | ||
| rH1,H3 | 2.52 | 2.52a [6.6] | 3.76 | 2.52 | ||
| rH1′,H3 | 3.21 | >3.07 [<2.0] | 3.40 | 3.59 [0.9]f | 3.58 | |
| rH1′,H4 | 2.32 | 2.45 [7.8] | 2.29 | 2.27 [13.9]f | 2.28 | 2.26 [13.5] |
| 2.19 {8.9} | ||||||
| rH2,H4 | 2.57 | 2.49 | 2.54 | 2.54c [6.7] | ||
| 2.54c {3.7} | ||||||
Reference distance from MD simulations of compounds 1–3 respectively.
Effective proton-proton distances r (Å) calculated according to equation 11.
Experimental 1H,1H cross-relaxation rates σT-ROE (square brackets) and σNOE (curly brackets) ×105 s−1 for 1 at 700 MHz and ×102 s−1 for 2 and 3 at 600 MHz.
From reference 30, Larsson et al.
The measured 1H,1H cross-relaxation rates in compounds 1 – 3 do all differ as a consequence of the NMR experiments used and the resonance frequency at which the experiments were carried out. However, the effective transglycosidic proton distances rH1′,H4 in 2 and 3 should not be interpreted as different since from the various experiments the distance deviations are < 0.1 Å; this limit was the estimated experimental error for these types of experiments,38 and further detailed comparisons based on NOE-data are thus judged inappropriate. However, in 1 the corresponding experimental distance is longer, but still < 6% which is the deviation limit between simulation and experiment chosen to judge whether the effective proton-proton distance agrees. Furthermore, the experimentally derived rH1′,H3 distances in 1 and 2 being > 3 Å may be used to address the presence of anti-ψ conformational states. These dissimilarities in effective proton distances for 1 on the one hand and 2 and 3 on the other, represent a challenge to reproduce by the MD simulations using the recently developed force field for hexopyranoses.
Conformational analysis
The results of trans-glycosidic 3J coupling constants calculated from the MD simulations using different Karplus-type relationships (Eqs. 2 – 10) are presented in Table 1. Calcgas and Calcsoln represent the results from the gas-phase and aqueous-phase MD simulations, respectively. The values given in parenthesis are the standard deviation from the calculations. It may be noted that 3JC,C coupling constants have a smaller range in general. We use the above described value of 0.75 Hz as a limit of whether a calculated 3J value deviates from that determined experimentally. Five different trans-glycosidic coupling constants were considered, 3JH1′,C1, 3JC1′,H4, 3JC2′,C4, 3JC1′,C3 and 3JC1′,C5. For the gas-phase simulations the deviations are in many cases large and it may be concluded that the population distributions from gas-phase MD simulations are not in agreement with those from solution NMR data.
For 3JC,H calculated from the aqueous phase MD simulations we analyze the results with respect to the Karplus-type relationships developed by three different research groups.26–28 The calculated 3JH1′,C4 and 3JC1′,H4 values of compound 1 agree within the deviation limit to the experimental values, independent of the Karplus-type relationship used (Table 1). For compounds 2 and 3 only the most recently developed Karplus-type relationship developed by Säwén et al. suffices for the 3JH1′,C4 related to the φ torsion angle whereas for 3JC1′,H4, besides the most recent one from Säwén et al., also that of Tvaroška et al. reproduces the experimental data. For 3JC,C couplings experimental NMR data are available for 2 where the agreements vary between simulation and experiment for the 3JC2′,C4 and 3JC1′,C5 coupling constants. For the latter, only that proposed by Säwén et al. is actually in close and excellent agreement. In the case of 3JC1′,C3 all three Karplus equations overestimate the average coupling constants slightly in the current MD simulations. However, the experimentally determined value is very small. The above analysis indicates that the improved Karplus-type relationships derived by Säwén et al. are indeed valid and that any small deviations may be due to minor discrepancies of the force field used. Consequently, in the subsequent analysis we will only utilize the most recently proposed Karplus-type relationships in order to gain further insights on the present force field.
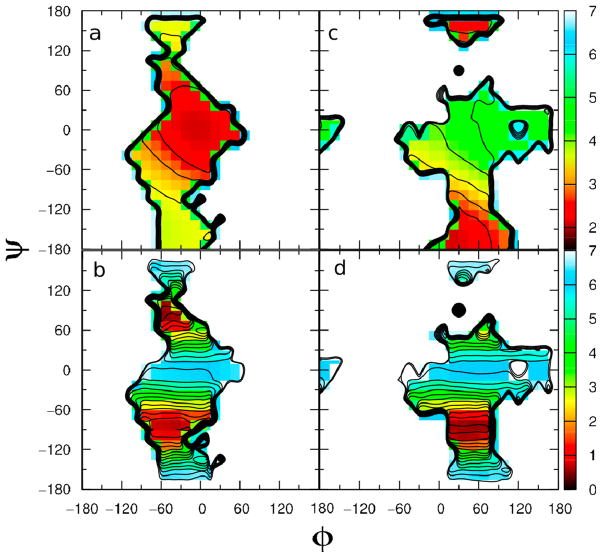
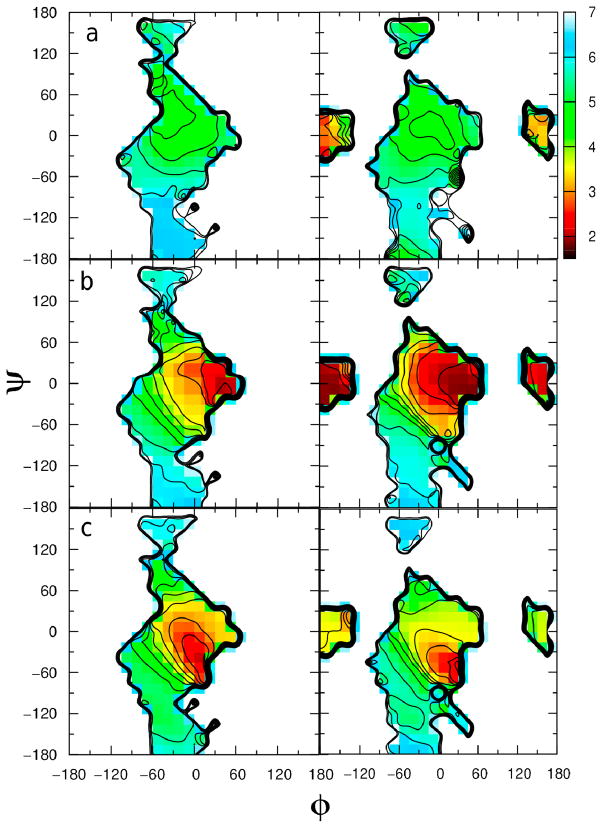
Two-dimensional plots of the relative free energy as a function of the φ = H1′–C1′–O4–C4 and ψ = C1′–O4–C4–H4 dihedral angles for the three compounds are given in Figure 3, where the aqueous-phase φ/ψ plots are on the left and the gas-phase plots are on the right. The anti-φ conformation of the methyl cellobiosides in vacuo have low(est) potential energies which are consistent with the results of a previous ab initio computational study.39 In the gas phase, all three compounds sample syn, anti-φ and antiψ conformations to varying extents. For compounds 2 and 3 the global minimum is in the anti-φ conformation while the syn conformation dominates with 1. The global minima of the φ/ψ maps in the gas phase for compounds 1, 2 and 3 are calculated to be −15°/−15°, 165°/0° and 180°/0°, respectively. Upon going to the aqueous phase the φ/ψ torsion sampling is significantly impacted with all three compounds. Analysis of the plots shows that all compounds sample both the syn-conformation and the anti-ψ conformation in the aqueous phase and that compounds 2 and 3 still sample a small amount of the anti-φ region as well, similar to previous experiments39–41. Using a local elevation umbrella sampling method with the GROMOS 45A4 force field to improve the conformational sampling of 11 different disaccharide compounds, Peri3-Hassler et al. also observed population in the anti-ψ state but not the anti-φ state for maltose and observed populations of both the anti-ψ and anti-φ states for cellobiose.41 These results are comparable to our results further validating the CHARMM carbohydrate force field. In this previous study41, the authors also observed similar intramolecular hydrogen bonding as we did in our study. The global minimum in the aqueous phase for compounds 1, 2 and 3 are −30°/−30°, 45°/0° and 45°/0°, respectively. Kuttel and coworkers calculated the φ/ψ map for β-maltose in both vacuum and in TIP3P solution using the CHARMM program and the CSFF force field42 for the disaccharide. They determined that the global minimum changed from approximately −25°/−25° in vacuum to −50°/−35° in aqueous phase.33 Although we do not reproduce these results exactly, the trend of our results is similar to their study. The changes in phase space sampling in going from gas phase to aqueous phase simulations is due to the competition of intramolecular and intermolecular hydrogen bonding, which will be discussed in greater detail below in the hydrogen bonding analysis section.
Figure 3.
Two-dimensional potential energy surface versus φ = H1′–C1′–O4–C4 and ψ = C1′–O4–C4–H4 dihedrals, given in degrees, calculated from the aqueous-phase simulations (left) and gas-phase simulations (right) of a) methyl β-maltoside, b) methyl α-cellobioside and c) methyl β-cellobioside. Potential energies are calculated from the natural logarithm of the relative probability and are given in kcal/mol.
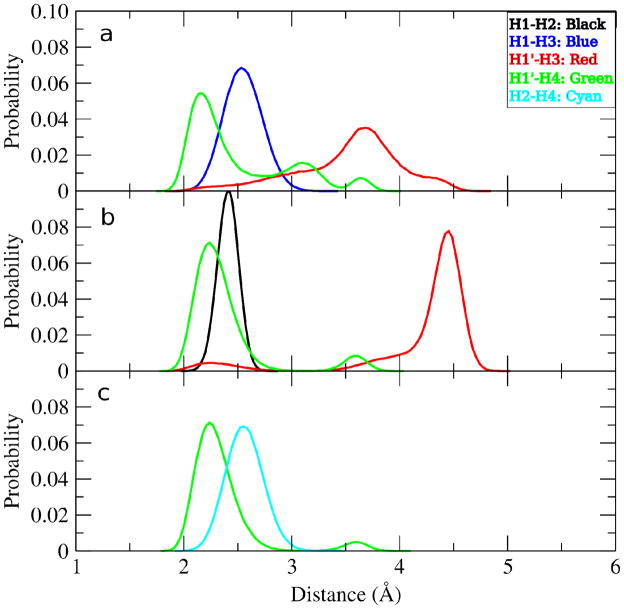
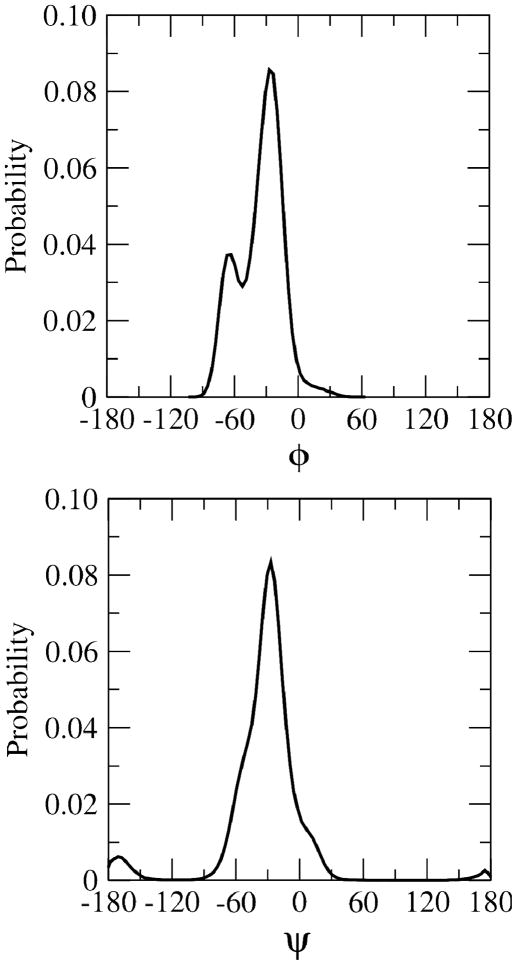
Proton-proton distances are calculated from cross-relaxation rates in the NMR experiments and compared to aqueous phase MD simulations using Eq. 11 (Table 2). The proton-proton distances calculated from the MD simulations reproduce the experimental results very well especially within the estimated experimental error of 6%. However there is a slight underestimation of rH1′,H4 in methyl β-maltoside and, to some extent, for rH1′,H3 in methyl α-cellobioside. In Figure 4, the distributions of the proton-proton distances calculated from aqueous phase MD simulations are shown. For methyl β-maltoside the rH1′,H4 distribution has three peaks unlike the rH1′,H4 distribution for methyl α- and β-cellobioside which have two peaks. Two of the three rH1′,H4 peaks for methyl β-maltoside correspond to when the compound is in the syn-conformation and one when the compound is in the anti-ψ conformation. To facilitate visualization of the distributions of the φ and ψ dihedral angles in the syn region, 1-D histograms of the φ (top) and ψ (bottom) torsions are given in Figure 5. The plot shows the sampling of φ in the syn region to include two peaks; a minor peak for −100°< φ <−50° and a larger peak for −50°< φ < 50°. To understand the impact of the sampling of two syn regions in 1, in Figure 6a a 2-D plot of effective rH1′,H4 versus φ/ψ is given. In the plot, the −50°< φ < 50°, −30° < ψ < 30° region has effective rH1′,H4 values that are short, < 2.5 Å. Outside of this region the effective rH1′,H4 values start to gradually increase. In the syn region −100°< φ <−50° the effective rH1′,H4 values are approximately between 3.0–3.5 Å and in the anti-ψ region the rH1′,H4 values are approximately 3.5–4.0 Å.
Figure 4.
Proton-proton distance distributions for compounds a) methyl β-maltoside, b) methyl α-cellobioside and c) methyl β-cellobioside from the aqueous-phase simulations. rH1,H2 (black), rH1,H3 (blue), rH1′,H3 (red), rH1′,H4 (green), rH2,H4 (cyan) are given in Å.
Figure 5.
1-D probability distribution of φ (top) and ψ (bottom) for methyl β-maltoside in the aqueous phase. φ and ψ are given in degrees.
Figure 6.
a) 2-D plots of effective rH1′,H4 versus φ/ψ for aqueous methyl β-maltoside, b) average 3JC1′,H4 using Eq. 5 versus φ/ψ for aqueous methyl β-maltoside, c) effective rH1′,H3 versus φ/ψ for aqueous methyl α-cellobioside and d) average 3JC1′,H4 using Eq. 5 versus φ/ψ for aqueous methyl α-cellobioside. Dihedral angles φ and ψ are given in degrees, rH1′,H4 and rH1′,H3 are given in Å and 3JC1′,H4 are given in Hz.
Therefore, the slight underestimation of rH1′,H4 in methyl β-maltoside may be due to i) the syn-conformation in the −100°< φ < −50° region being under-populated leading to smaller distances when averaging the two syn distributions or ii) the population of the anti-ψ region being under-populated. To identify the contribution of scenarios i versus ii to the underestimation of the rH1′,H4 distance in 1, the 3JC1′,H4 results are further investigated. As shown in Table 1 the 3JC1′,H4 values are well reproduced in the simulations. The relevance of this may be seen in a 2-D plot of average 3JC1′,H4 versus φ/ψ for methyl β-maltoside (Figure 6b). As exhibited, larger values of 3JC1′,H4 occur in the anti-ψ region. Thus, if the anti-ψ region were sampled to a larger extent to improve agreement with experimental rH1′,H4 distance, as in scenario ii above, the 3JC1′,H4 from the MD simulation would be larger, leading to poorer agreement with experiment for that term. On the other hand, changes in sampling of φ with a slight increase in the population of the minor syn-conformer of 1 having φ < −50° (Fig. 5) would increase the effective rH1′,H4 distance (Fig 6a) thereby leading to a better agreement with the experimentally determined distance. Also, as a consequence the anti-ψ conformation then decreases in importance. Moreover, 3JC1′,H4 becomes smaller (Fig. 6b). In particular, increasing the population of the minor state decreases 3JH1,C4 more rapidly than 3JC1′,H4 which consequently will give very good agreement when combined effects are considered for these two heteronuclear transglycosidic coupling constants. This indicates that there are only minor disagreements between NMR observables with the data derived from the MD simulation. Thus, scenario i appears to be responsible for the underestimation of the rH1′,H4 distance.
The underestimation of rH1′,H3 in methyl α-cellobioside is also likely due to under sampling of the syn-conformation. In Figure 4b, the rH1′,H3 peak centered at 4.25 Å corresponds to the syn and anti-φ regions and the peak centered at 2.25 Å corresponds to the anti-ψ region. This is shown more clearly in Figure 6c, where the effective rH1′,H3 versus φ/ψ is plotted. Evident from Figure 6c, in the syn and anti-φ regions rH1′,H3 values in the 3–5 Å range are sampled, whereas in the anti-ψ region rH1′,H3 values are in the 2–3 Å range. An increase in the sampling of the syn-conformation would increase the proton-proton distance, yielding better agreement with experiment. This would also explain why the calculated 3JC1′,H4 value for 2 is slightly overestimated as compared to experiment. In Figure 6d, a 2-D plot of the average 3JC1′,H4 versus φ/ψ for methyl α-cellobioside indicates that the syn region is the only region where the coupling values are below 4 Hz. Therefore, if certain sections of the syn region (−120° < ψ < −60°) had a greater population the coupling value would decrease.
In Table 3, the average φ, ψ and rH1′,H3 and rH1′,H4 distances are given for each of the different conformations. These values are calculated from the aqueous phase MD simulations using the definitions of the syn and anti-conformations given above in the computational methods section. The average population of the conformations, calculated from the MD simulations, %PopMD, is given in Table 3. The percent population for syn conformers for compounds 1 and 2 are also calculated using Eq. 12 with the and values reported in Table 2. The extent to which anti-ψ conformers may be populated in compound 1 may be estimated using the experimentally derived effective distance rH1′,H3 (Table 2) and the effective distances in the syn and anti-ψ conformational states, which are 3.38 Å and 2.39 Å, respectively (Table 3). Since the experimental distance is > 3.07 Å, we calculate that in 1 the anti-ψ conformational state may be populated up to ≈10%, although it may be populated to a lesser extent (vide infra) on the order of just a few percent, since we only have a lower distance limit for the effective transglycosidic proton-proton distance. Calculated from Eq. 12, the syn-conformation for compound 2 is sampled for approximately 96% of the time. These results are similar to those calculated from the MD simulations (Table 3); therefore, the overall level of agreement from the simulations is quite good, indicating that the force field is doing a good job of reproducing experiment. However, there is a slight underestimation of the syn population from the simulations for both compounds 2 and 3. Moreover, as discussed above, this slight underestimation of the syn-conformation in the simulations leads to the underestimation of the calculated 3JC1′,H4. The ability to directly pinpoint limitations in sampling of specific regions of conformational space offers the potential for future improvements in the force field. From the aqueous phase MD simulations, using the recently developed CHARMM additive all-atom force field for hexopyranose disaccharides, the percent population of the syn conformer of compound 1 is calculated to be approximately 95% (Table 3) and the lower limit of ~ 90% calculated from the effective distances and Eq. 12. Both of these results are in good agreement with previous methods, using a DFT molecular dynamics method, where the syn population was calculated to be 91% for α-maltose.43 However, in the latter case a ‘kink’ conformation was also considered but ‘band-flip (anti-ψ) conformations were not present. The results for compound 2 are also very similar to those calculated previously using the Monte Carlo method and molecular dynamics30, as well as for lactose44.
Table 3.
Average φ, ψ, proton-proton distances and the % population for each conformational region calculated from aqueous phase MD simulations. Average φ, ψ are given in degrees and average proton-proton distances are given in Å.
| conformation | 〈φ〉 | 〈ψ〉 | rH1′,H3 | rH1′,H4 | %PopMD | |
|---|---|---|---|---|---|---|
| methyl β-maltoside (1) | syn | −33 | −27 | 3.38 | 2.30 | 94.9 |
| anti-φ | - | - | - | - | 0 | |
| anti-ψ | −36 | −169 | 2.39 | 3.65 | 5.1 | |
| methyl α-cellobioside (2) | syn | 46 | −11 | 4.22 | 2.26 | 92.9 |
| anti-φ | 166 | 2 | 4.53 | 3.58 | 0.2 | |
| anti-ψ | 58 | −162 | 2.28 | 3.59 | 6.9 | |
| methyl α-cellobioside (3) | syn | 46 | −11 | 4.27 | 2.26 | 95.0 |
| anti-φ | 168 | 3 | 4.51 | 3.58 | 0.2 | |
| anti-ψ | 57 | −163 | 2.31 | 3.17 | 4.8 | |
Hydrogen-bonding analysis
Examination of molecular details of solvent effects on the conformational sampling of the disaccharides is performed by investigating both the intra- and intermolecular hydrogen bonding. Previous studies have explored the competition between intra- and intermolecular hydrogen bonding in these types of disaccharide compounds using DFT and MD methods.45,46 Moreover, Serianni and coworkers observed the effects of hydrogen bonding on the preferred conformations of glycosidic linkages using NMR couplings and DFT.47 However in our investigation, hydrogen bonding is directly correlated to changes in the conformational maps and the flexibility of these disaccharide compounds. In our analysis hydrogen bonding is defined as any H-bond donor to acceptor distance < 2.5 Å. It is surmised that methyl β-cellobioside contains an intramolecular hydrogen bond between O5′ and HO3 because of the short interatomic distance between these atoms observed in the x-ray crystal structure4 and from previous NMR and computational studies.48–50 What is unclear is to what extent this intramolecular hydrogen bond is maintained in the aqueous phase. It is also important to investigate any differences in the intramolecular hydrogen bonding between cellobiose and maltose and how these intramolecular hydrogen bonds affect the conformational sampling. Results from the MD simulations allow for such a detailed hydrogen-bonding analysis.
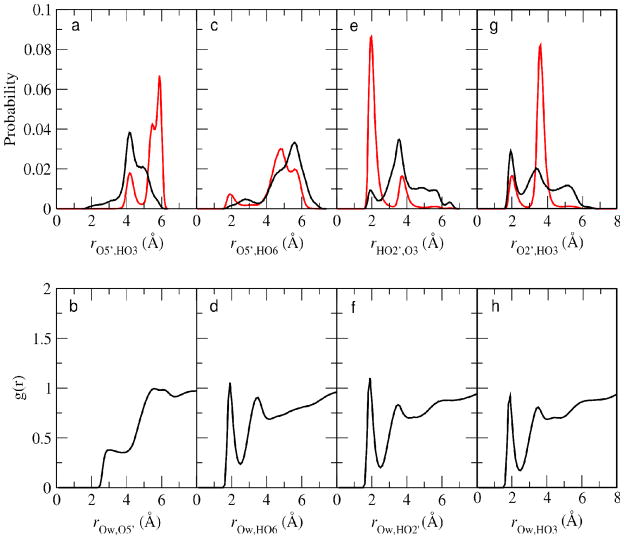
Analysis of the intramolecular and intermolecular (i.e. with solvent) hydrogen bonding of methyl β-maltoside may be performed via radial distribution functions (RDF) (Figure 7). Probability distributions of the O5′-HO3 distance in the gas phase (red) and aqueous phase (black) are plotted in Figure 7a. This analysis determined that a hydrogen bond does not exist between O5′ and HO3. Furthermore, intermolecular hydrogen bonding with O5′ is not significant as indicated by the small peak at 2.5 Å in Figure 7b, which shows the O5′-Ow (water oxygens) RDF. Some intramolecular hydrogen bonds between O5′ and HO6 are detected in methyl β-maltoside in the gas phase; however, in the aqueous phase this hydrogen bonding is lost (Figure 7c), as the peak centered around 2 Å in the gas phase (red) rO5′,HO6 RDF is not present in the aqueous phase (black). In Figure 7d, the HO6-Ow RDF shows a peak around 2 Å. In combination, Figures 7c and 7d indicate that direct hydrogen bonding between O5′ and HO6 in methyl β-maltoside in the gas phase is lost in the presence of water due to competition of water molecules via Ow-HO6 intermolecular hydrogen bonding. Intramolecular hydrogen bonding was also detected between HO2′ and O3 in methyl β-maltoside in the gas and aqueous phases (Figure 7e), with the distribution of rHO2′,O3 centered at 2 Å being much larger in the gas phase than in the aqueous phase. While some HO2′-O3 hydrogen bonding is present in solution, solvent can effectively compete for this intramolecular hydrogen bond which is indicated by the large first peak in the RDF between Ow and HO2′ (Figure 7f). While water is competing for the HO2′-O3 hydrogen bonding interaction, there is also a competition between the HO2′-O3 and O2′-HO3.51 This is evident by the large first peak on the gas phase HO2′-O3 RDF versus the small first peak in the O2′-HO3 RDF (compare Figures 7e and 7g). In the aqueous-phase MD simulations of 1 the O2′-HO3 hydrogen bond is present to a larger extent than the HO2′-O3 hydrogen bond (Figure 7e and 7g), even though there is significant hydrogen bonding with water by both the HO2′ and HO3 atoms (Figures 7f and 7h). Thus, in the aqueous phase there is a limited amount of hydrogen bonding between the individual monosaccharides of methyl-β-maltoside due to competition with water, though some O2′-HO3 hydrogen bonding is occurring.
Figure 7.
a) Probability distribution of the distances between O5′ and HO3 in the aqueous phase (black) and the gas phase (red) in methyl β-maltoside. b) Radial distribution function of Ow and O5′. c) Probability distribution of the distances between O5′ and HO6 in the aqueous phase (black) and the gas phase (red) in methyl β-maltoside. d) Radial distribution function of Ow and HO6. e) Probability distribution of the distances between HO2′ and O3 in the aqueous phase (black) and the gas phase (red) in methyl β-maltoside. f) Radial distribution function of Ow and HO2′. g) Probability distribution of the distances between O2′ and HO3 in the aqueous phase (black) and the gas phase (red) in methyl β-maltoside. h) Radial distribution function of Ow and HO3.
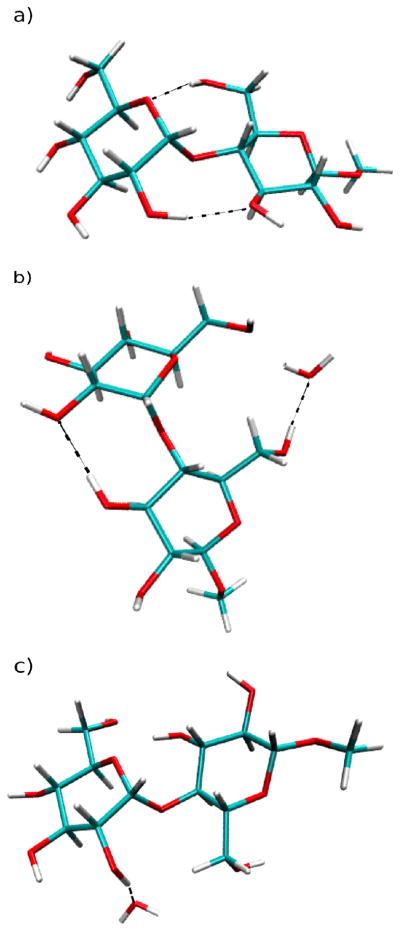
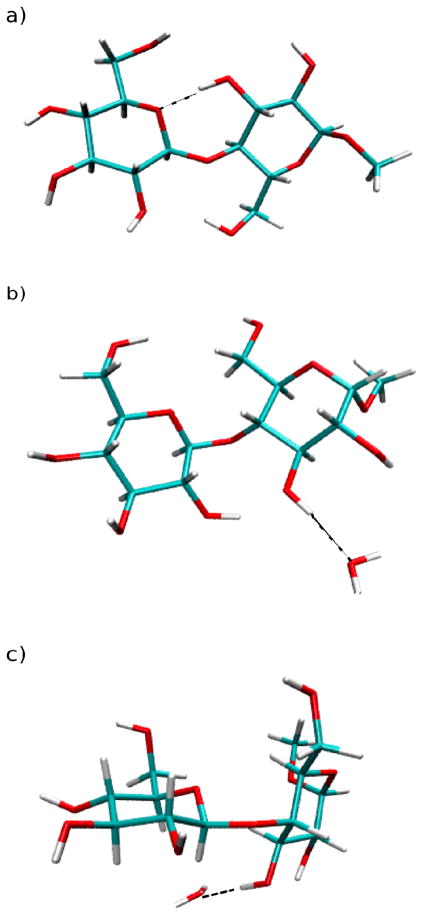
Representative images of 1 from the MD simulations are presented in Figure 8. They show an intramolecular hydrogen bond between O5′-HO6 and HO2′-O3 in the gas phase (Figure 8a) and how in solution a water molecule can compete with the intramolecular hydrogen bonds (Figure 8b and 8c). Figure 8c further illustrates that, while 1 is in the anti-ψ conformation, intramolecular hydrogen bonding between O5′-HO6 and HO2′-O3 cannot exist. However, this does not mean that there is always hydrogen bonding occurring in the syn-conformation, especially for O5′-HO6 (Figure 8b). This will be explained in more detail below.
Figure 8.
Snapshots from the gas-phase and aqueous-phase simulations of methyl β-maltoside. Dashed lines represent hydrogen bonds. Panel (a) illustrates hydrogen bonding between O5′-HO6 and HO2′-O3 while the compound is in the syn-conformation during gas-phase simulations. Panel (b) illustrates the loss of hydrogen bonding between O5′-HO6 due to the presence of water and the existence of a O2′-HO3 hydrogen bond while the compound is in the syn-conformation during aqueous-phase simulations. Panel (c) illustrates the loss of hydrogen bonding between HO2′-O3 due to the presence of water while the compound is in the anti-ψ conformation during the aqueous-phase simulations.
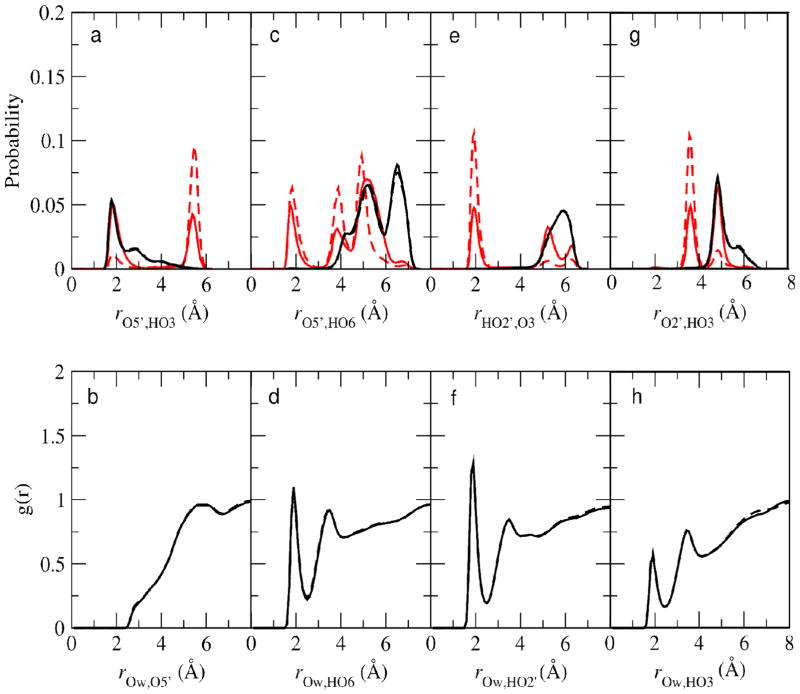
In both methyl α- and β-cellobioside, the intramolecular hydrogen bond between O5′ and HO3 is populated in both the gas phase and the aqueous phase as shown in the RDFs in Figure 9a. Note that unlike methyl β-maltoside, where some hydrogen bonding occurs between O5′ and HO6, in methyl α- and β-cellobioside hydrogen bonding occurs between O5′ and HO3 due to the geometry around the glycosidic linkage. Assuming hydrogen bonding is occurring when donor H to acceptor distances are 2.5 Å or less, the probability of intramolecular hydrogen bonding between O5′ and HO3 in aqueous solution in both methyl α- and β-cellobioside is approximately 60%. This result is similar those calculated previously where the O5′-HO3 hydrogen bond was determined to persist for 35%50 and 70%52.
Figure 9.
a) Probability distribution of the distances between O5′ and HO3 in the aqueous phase (black) and the gas phase (red) in methyl α-cellobioside (solid) and methyl β-cellobioside (dashed). b) Radial distribution function of Ow and O5′ in methyl α-cellobioside (solid) and methyl β-cellobioside (dashed). c) Probability distribution of the distances between O5′ and HO6 in the aqueous phase (black) and the gas phase (red) in methyl α-cellobioside (solid) and methyl β-cellobioside (dashed). d) Radial distribution function of Ow and HO6 in methyl α-cellobioside (solid) and methyl β-cellobioside (dashed). e) Probability distribution of the distances between HO2′ and O3 in the aqueous phase (black) and the gas phase (red) in methyl α-cellobioside (solid) and methyl β-cellobioside (dashed). f) Radial distribution function of Ow and HO2′ in methyl α-cellobioside (solid) and methyl β-cellobioside (dashed). g). Probability distribution of the distances between O2′ and HO3 in the aqueous phase (black) and the gas phase (red) in methyl α-cellobioside (solid) and methyl β-cellobioside (dashed). h) Radial distribution function of Ow and HO3 in methyl α-cellobioside (solid) and methyl β-cellobioside (dashed).
The overall pattern of intra- versus intermolecular hydrogen bonding in methyl α- and β-cellobioside is shown in Figure 9. In the gas phase, significant intramolecular hydrogen bonding is occurring with some competition between the hydrogen bonds evident, for example between HO3 and HO6 for O5′ (Figures 9a and 9c). In aqueous solution, the only significant intramolecular hydrogen bonding occurs between HO3 and O5′, as discussed in the preceding paragraph. This is due to the inability of water to compete for the O5′ acceptor (Figure 9b) and only partially compete for the HO3 donor (Figure 9h). In contrast, water can effectively hydrogen bond to both the HO6 and HO2′ donors (Figures 9d and 9f) leading to a loss of intramolecular bonds in the aqueous phase that were present in the gas phase (Figures 9c and 9e). Molecular representations of methyl α-cellobioside in the syn (Figure 10a), anti-φ (Figure 10b) and anti-ψ (Figure 10c) conformations are given. The presence of the O5′-HO3 hydrogen bond is evident while intermolecular interactions that compete for the hydrogen bonds are shown for anti-φ and anti-ψ conformations. Indeed, these interactions appear to stabilize these conformations, leading to the small amount of sampling of these conformations in the cellobiosides (Table 3), as discussed below.
Figure 10.
Snapshots from the gas-phase and aqueous-phase simulations of methyl α-cellobioside. Dashed lines represent hydrogen bonds. Panel (a) illustrates hydrogen bonding between O5′-HO3 while the compound is in the syn-conformation during gas-phase simulations. Panel (b) illustrates the loss of hydrogen bonding between O5′-HO3 due to the presence of water while the compound is in the anti-φ-conformation during aqueous-phase simulations. Panel (c) illustrates the loss of hydrogen bonding between O5′-HO3 due to the presence of water while the compound is in the anti-ψ conformation during the aqueous-phase simulations.
Differences in the ability of water to compete with the intramolecular hydrogen bonds in the maltoside versus methyl α-cellobioside and methyl β-cellobioside is noteworthy. In the maltoside, all the atoms are accessible, with the lowest accessibility being to the O5′ atom, though a small first peak is evident. (Figures 7b, d, f and h). In contrast, with the cellobiosides, there is no first peak for the O5′ atom while the first peak for the HO3 is significantly diminished as compared to that in maltoside (Figure 9b and 9h). With respect to hydrogen bonds involving the O5′ atom, hydrogen bonding with water is significantly less with the HO3 atom in cellobioside than that for the HO6 atom in the maltoside (Figure 9g versus 7d, respectively). One reason for decreased hydration of the HO3 atom in cellobioside may be due to steric/electrostatic effects caused by the hydroxyls surrounding it. Comparing the geometries of the alpha (1) versus beta (2,3) glycosidic linkages in the most populated syn-conformation (Figure 8a and 10a) indicates that there is less space for water to interact with the HO3 atom in cellobioside than with the HO6 atom in maltoside. Conversely, in maltoside the HO6 atom has a lot of exposure to the solvent environment. The solvent accessible surface area, averaged over all snapshots, for atoms O6 of methyl β-maltoside and O3 of methyl α-cellobioside are 14.0Å2 and 6.4 Å2, respectively, indicating the lowered accessibility of the hydrogen bond donor of the cellobioside. Steric effects in cellobioside, therefore, may contribute to the retention of the hydrogen bonding between O5′ and HO3, while the lack of steric crowding facilitates interactions with water leading to a loss of intramolecular O5′-HO6 hydrogen bonding in the maltoside.
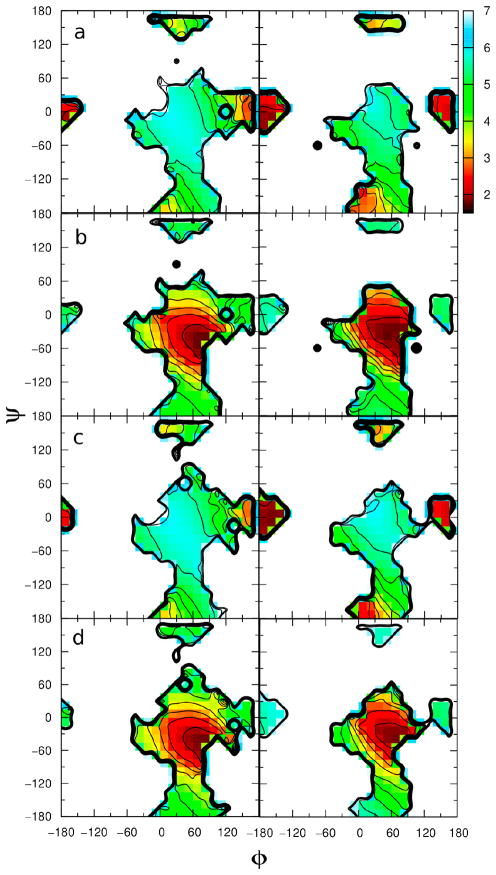
Another important issue is the correlation between the conformational sampling and the intramolecular hydrogen bonding. In Figures 11 and 12, 2-D φ/ψ plots versus average hydrogen bonding distance for compound 1–3 are given. Figure 11a shows distances in the range of 4–5 Å between O5′ and HO6 in methyl β-maltoside in the φ/ψ regions corresponding to the syn region occurring in both the gas phase (right) and the aqueous phase (left). Furthermore, only in the gas phase are short O5′-HO6 distances sampled (Figure 7b) and these distances occur in the anti-φ region of the φ/ψ map. As discussed above, in the anti-ψ region of the φ/ψ map, hydrogen bonding between O5′-HO6 cannot exist; however, hydrogen bonding between O5′-HO6 can occur in the syn and anti-φ conformations but doesn’t necessarily have to occur in these regions. In fact, in the aqueous phase the larger distances (i.e. > 4 Å) dominate throughout the entire φ/ψ map indicating direct hydrogen bonding is not present. On the other hand, there is a larger correlation between the φ/ψ conformations and the average distance for HO2′-O3 (Figure 11b) and O2′-HO3 (Figure 11c) in methyl β-maltoside in both the gas (right) and aqueous (left) phases. In the φ/ψ plot of methyl β-maltoside in the aqueous phase (Figure 11b, left) the region 15° < φ < 60° and −30° < ψ < 30° contains structures with average HO2′-O3 interatomic distances of approximately 2 Å; whereas, structures with average O2′-HO3 interatomic distances of approximately 2 Å are located in the −15° < φ < 15° and −60° < ψ < 0° region (Figure 11c, left). In both plots, the intramolecular distances increase gradually as sampling occurs beyond the regions stated above. In the anti-ψ region of both the aqueous phase and gas phase maps for all of the plots (11a-c), the average distances are much larger than those in the syn or anti-φ region, indicating a loss of hydrogen bonding in that region. Hence, the greater loss of hydrogen bonding due to interactions with water in the aqueous phase (Figure 11a-c, left) lead to a larger amount of phase space, particularly in the anti-ψ region, being sampled during the simulations. In the gas phase, in both the syn and anti-φ regions, there is hydrogen bonding between HO2′-O3 occurring (11b, right); therefore going from the syn to anti-φ region no loss of hydrogen bonding occurs. Furthermore, in the aqueous phase a larger population of the minor syn state having φ ≈ −60° as indicated by experimental NMR data, hydrogen bonding between O3 and O2′ is not occurring any longer.
Figure 11.
2-D plots of average distance versus φ and ψ dihedrals for methyl β-maltoside in the aqueous phase (left) and the gas phase (right). a) Plot of average rO5′,HO6. b) Plot of average rHO2′,O3. c) Plot of average rO2′,HO3. φ/ψ given in degrees and distances given in Å.
Figure 12.
2-D plots of average distance versus φ and ψ dihedrals in the aqueous phase (left) and the gas phase (right). Plots for methyl α-cellobioside of the average a) rHO2′,O3 and b) rO5′,HO3 distances and for β-cellobioside of the average c) rHO2′,O3 and d) rO5′,HO3 distances. φ/ψ given in degrees and distances given in Å.
For compounds 2 and 3, there is a large correlation between average rO5′, HO3 and φ/ψ in both the gas (right) and aqueous (left) phase (Figure 12b and d), but little correlation for average rHO2′, O3 (Figure 12a and c). However, Figures 12a and c show that hydrogen bonding between HO2′ and O3 takes place in the anti-φ region of the φ/ψ map in both the gas (right) and the aqueous (left) phases. Figures 12b and d (left) shows that the smallest average intramolecular distances between O5′ and HO3 in the aqueous phase occur in the 45° < φ < 90° and −75° < ψ < −15° region of the φ/ψ maps. Thus, when ψ < 0° intermolecular hydrogen bonding is possible whereas if ψ > 0° this interaction does not contribute to an intermolecularly stabilized conformation of the cellobiosides. The conformational analysis on 2 carried out by Olsson et al.15 based on experimental 3J coupling constants resulted in ψ ≈ −27°, in agreement with the results presented herein. However, the importance of this hydrogen bond in aqueous solution has been judged low based on experimental data.48,53
In all plots of average distance versus φ/ψ, the correlation patterns are similar in the gas and aqueous phases. In fact it is important to note that in Figures 12b and d hydrogen bonding is only occurring in the syn region in both the gas and aqueous phases. Looking back at Figure 3 for methyl α-cellobioside the lowest energy region on the φ/ψ map occurs in the syn region for both gas and aqueous phase (Figure 3b), but for methyl β-cellobioside in the gas phase the lowest energy region is anti-φ and in the aqueous phase syn is the lowest energy region (Figure 3c). Therefore, for methyl β-cellobioside hydrogen bonding is gained in going from gas to aqueous phase (Figure 9a) due to increased sampling of the syn region in the aqueous environment.
CONCLUSIONS
A conformational analysis of methyl β-maltoside (1), methyl α-cellobioside (2) and methyl β-cellobioside (3) is presented. MD simulations using the CHARMM package and the recently developed hexopyranose disaccharide additive all-atom force field are compared to the experimental NMR results presented in this paper. Percent sampling of conformational regions (syn, anti-φ, and anti-ψ) is correlated to coupling constants and proton-proton distances to pinpoint any sampling deficiencies due to the force field. Intramolecular hydrogen bonding is investigated for all three compounds in both the gas and aqueous phases to understand the solvent effects on intramolecular hydrogen bonding and relate these interactions to conformation sampling.
In general, the force field appears to very slightly underestimate the sampling of the syn conformation. While the overall level of agreement between experiment and simulation may be considered to be quite high, the disagreements with experiment observed presently appear to be directly due to slight undersampling of the syn conformations. Detailed analysis of both intra- and intermolecular hydrogen bonding indicate that the presence of water competes with intramolecular hydrogen bonds that stabilize the syn conformations. Accordingly, the present limitation in the force field, albeit small, appears to be a slight overestimation of intermolecular hydrogen bonding between water and the saccharides thereby competing for the intramolecular hydrogen bonds that stabilize the syn conformations.
A central theme of empirical force fields is the need to properly balance what we have previously referred to as the “interaction triad”.54 The interaction triad is comprised of the solvent-solvent, solvent-solute and solute-solute interactions. In the present case these involve intermolecular water-water, intermolecular water-saccharide and intramolecular saccharide-sacchride interactions. During optimization of additive empirical force fields it is necessary to overestimate the intermolecular hydrogen bonding interactions that occur in the gas phase to reproduce the thermodynamics of the condensed phase. Once this is performed for the water model it is essential that this overestimation be applied to the remainder of the force field to maintain the balance of the interaction triad. With the CHARMM additive all-atom force fields this leads to the use of HF/6–31G* gas phase monomer-monohydrate minimum interaction energies scaled by 1.16 as the target data for optimization of the partial atomic charges. Those charges combined with the reproduction of condensed phase properties ultimately yields the nonbond model for the solutes; the collection of partial atomic charges and the Lennard-Jones parameters. However, while a general scheme for force field optimization is convenient, if not necessary, when being applied to produce a comprehensive model for biological molecules it can lead to limitations. Indeed, with the CHARMM carbohydrate force field being developed in our laboratory it has been noted that the volumes of crystals are systematically overestimated, a problem also observed with the Glycam force field.55 This overestimation suggests that the saccharide-saccharide interactions may be slightly underestimated (ie. not favorable enough). While crystal volumes are dominated by saccharide-saccharide intermolecular interactions, it is those same nonbond parameters that dictate the intramolecular disaccharide interactions occurring in the present study. Thus, it appears that the intramolecular interactions in the current force field may be slightly underestimated, leading to slight undersampling of the syn conformation. While such discrepancies may be considered a limitation in the force field, one must consider that additive force fields are inherently limited by the lack of polarization in the potential energy function. This leads to the initial overestimation of water-water interactions in the TIP3P, as well as other water models, ultimately requiring the balancing of the interaction triad as required to reproduce condensed phase properties. Accordingly, the possibility must be considered that inherent limitations in the form of the energy function; most notable being the omission of explicit electronic polarizability, lead to the limitations observed in the present study. Ongoing efforts in ours as well as other laboratories to develop next generation empirical force fields that include electronic polarizability56–59 may allow this assumption to be directly tested.
Acknowledgments
Financial support from the NIH to ADM Jr. (GM070855) is acknowledged. The NMR research was supported by grants from the Swedish Research Council and The Knut and Alice Wallenberg Foundation
References
- 1.Lang R, Winter G, Vogt L, Zurcher A, Dorigo B, Schimmele B. Drug Development and Industrial Pharmacy. 2009;35:83. doi: 10.1080/03639040802192806. [DOI] [PubMed] [Google Scholar]
- 2.Bansal P, Hall M, Realff MJ, Lee JH, Bommarius AS. Biotechnology Advances. 2009;27:833. doi: 10.1016/j.biotechadv.2009.06.005. [DOI] [PubMed] [Google Scholar]
- 3.Klemm D, Philipp B, Heinze T, Heinze U, Wagenknecht W. Comprehensive Cellulose Chemistry. Vol. 1 Wiley-VCH; Weinheim: 1998. [Google Scholar]
- 4.Ham JT, Williams DG. Acta Crystallogr, Sect B. 1970;26:1373. [Google Scholar]
- 5.Widmalm G. Relaxation and Dynamics. In: Jiménez-Barbero J, Peters T, editors. NMR Spectroscopy of Glycoconjugates. Wiley-VCH Verlag GmbH & Co. KGaA; Weinheim, FRG: 2003. p. 3. [Google Scholar]
- 6.Guvench O, Greene SN, Kamath G, Brady JW, Venable RM, Pastor RW, MacKerell AD., Jr Journal of Computational Chemistry. 2008;29:2543. doi: 10.1002/jcc.21004. [DOI] [PMC free article] [PubMed] [Google Scholar]
- 7.Guvench O, Hatcher ER, Venable RM, Pastor RW, MacKerell AD. Journal of Chemical Theory and Computation. 2009;5:2353. doi: 10.1021/ct900242e. [DOI] [PMC free article] [PubMed] [Google Scholar]
- 8.Hällgren C, Widmalm G. Journal of Carbohydrate Chemistry. 1993;12:309. [Google Scholar]
- 9.Findeisen M, Brand T, Berger S. Magnetic Resonance in Chemistry. 2007;45:175. doi: 10.1002/mrc.1941. [DOI] [PubMed] [Google Scholar]
- 10.Kjellberg A, Widmalm G. Biopolymers. 1999;50:391. doi: 10.1002/(SICI)1097-0282(19991005)50:4<391::AID-BIP5>3.0.CO;2-S. [DOI] [PubMed] [Google Scholar]
- 11.Stott K, Keeler J, Van QN, Shaka AJ. Journal of Magnetic Resonance. 1997;125:392. [Google Scholar]
- 12.Thrippleton MJ, Keeler J. Angewandte Chemie-International Edition. 2003;42:3938. doi: 10.1002/anie.200351947. [DOI] [PubMed] [Google Scholar]
- 13.Dixon AM, Widmalm G, Bull TE. Journal of Magnetic Resonance. 2000;147:266. doi: 10.1006/jmre.2000.2211. [DOI] [PubMed] [Google Scholar]
- 14.Meissner A, Sørensen OW. Magnetic Resonance in Chemistry. 2001;39:49. [Google Scholar]
- 15.Olsson U, Serianni AS, Stenutz R. Journal of Physical Chemistry B. 2008;112:4447. doi: 10.1021/jp710977k. [DOI] [PubMed] [Google Scholar]
- 16.Brooks BR, Brooks CL, III, MacKerell AD, Jr, Nilsson L, Petrella RJ, Roux B, Won Y, Archontis G, Bartels C, Boresch S, Caflisch A, Caves L, Cui Q, Dinner AR, Feig M, Fischer S, Gao J, Hodoscek M, Im W, Kuczera K, Lazaridis T, Ma J, Ovchinnikov V, Paci E, Pastor RW, Post CB, Pu JZ, Schaefer M, Tidor B, Venable RV, Woodcock HL, Wu X, Yang W, York DM, Karplus M. J Comp Chem. 2009;30:1545. doi: 10.1002/jcc.21287. [DOI] [PMC free article] [PubMed] [Google Scholar]
- 17.Jorgensen WL, Chandrasekhar J, Madura JD, Impey RW, Klein ML. Journal of Chemical Physics. 1983;79:926. [Google Scholar]
- 18.Durell SR, Brooks BR, Ben-Naim A. Journal of Physical Chemistry. 1994;98:2198. [Google Scholar]
- 19.Nosé S. Molecular Physics. 1984;52:255. [Google Scholar]
- 20.Hoover WG. Physical Review A. 1985;31:1695. doi: 10.1103/physreva.31.1695. [DOI] [PubMed] [Google Scholar]
- 21.Feller SE, Zhang YH, Pastor RW, Brooks BR. Journal of Chemical Physics. 1995;103:4613. [Google Scholar]
- 22.Hockney RW. The potential calculation and some applications. In: Alder B, Fernbach S, Rotenberg M, editors. Methods in Computational Physics. Vol. 9. Academic Press; New York: 1970. p. 136. [Google Scholar]
- 23.Darden T, York D, Pedersen L. Journal of Chemical Physics. 1993;98:10089. [Google Scholar]
- 24.Steinbach PJ, Brooks BR. Journal of Computational Chemistry. 1994;15:667. [Google Scholar]
- 25.Ryckaert JP, Ciccotti G, Berendsen HJC. Journal of Computational Physics. 1977;23:327. [Google Scholar]
- 26.Tvaroska I, Hricovíni M, Petráková E. Carbohydrate Research. 1989;189:359. [Google Scholar]
- 27.Cloran F, Carmichael I, Serianni AS. Journal of the American Chemical Society. 1999;121:9843. doi: 10.1021/ja002525x. [DOI] [PubMed] [Google Scholar]
- 28.Säwén E, Massad T, Landersjö C, Damberg P, Widmalm G. Organic & Biomolecular Chemistry. 2010;8:3684. doi: 10.1039/c003958f. [DOI] [PubMed] [Google Scholar]
- 29.Bose B, Zhao S, Stenutz R, Cloran F, Bondo PB, Bondo G, Hertz B, Carmichael I, Serianni AS. Journal of the American Chemical Society. 1998;120:11158. [Google Scholar]
- 30.Larsson EA, Staaf M, Söderman P, Höög C, Widmalm G. Journal of Physical Chemistry A. 2004;108:3932. [Google Scholar]
- 31.French AD. Carbohydrate Research. 1989;188:206. [Google Scholar]
- 32.Backman I, Erbing R, Jansson P-E, Kenne L. Journal of Chemical Society Perkin Transactions. 1988;1:889. [Google Scholar]
- 33.Kuttel MM, Naidoo KJ. Journal of Physical Chemistry B. 2005;109:7468. doi: 10.1021/jp044756m. [DOI] [PubMed] [Google Scholar]
- 34.Ha SN, Giammona A, Field M, Brady JW. Carbohydrate Research. 1988;180:207. doi: 10.1016/0008-6215(88)80078-8. [DOI] [PubMed] [Google Scholar]
- 35.Rundlöf T, Kjellberg A, Damberg C, Nishida T, Widmalm Gr. Magnetic Resonance in Chemistry. 1998;36:839. [Google Scholar]
- 36.Nishida T, Widmalm G, Sandor P. Magnetic Resonance in Chemistry. 1996;34:377. [Google Scholar]
- 37.Landersjö C, Stevensson B, Eklund R, Östervall J, Widmalm G, Maliniak A. Journal of Biomolecular NMR. 2006;35:89. doi: 10.1007/s10858-006-9006-0. [DOI] [PubMed] [Google Scholar]
- 38.Olsson U, Säwén E, Stenutz R, Widmalm G. Chemistry A European Journal. 2009;15:8886. doi: 10.1002/chem.200900507. [DOI] [PubMed] [Google Scholar]
- 39.Hardy BJ, Gutierrez A, Lesiak K, Seidl E, Widmalm G. Journal of Physical Chemistry. 1996;100:9187. [Google Scholar]
- 40.Landersjö C, Stenutz R, Widmalm G. Journal of the American Chemical Society. 1997;119:8695. [Google Scholar]
- 41.Perić-Hassler L, Hansen HS, Baron R, Hünenberger PH. Carbohydrate Research. 2010;345:1781. doi: 10.1016/j.carres.2010.05.026. [DOI] [PubMed] [Google Scholar]
- 42.Kuttel MM, Brady JW, Naidoo KJ. Journal of Computational Chemistry. 2002;23:1236. doi: 10.1002/jcc.10119. [DOI] [PubMed] [Google Scholar]
- 43.Schnupf U, Willett JL, Momany FA. Journal of Computational Chemistry. 2010;31:2087. doi: 10.1002/jcc.21495. [DOI] [PubMed] [Google Scholar]
- 44.Martín-Pastor M, Canales A, Corzana F, Asensio JL, Jiménez-Barbero J. Journal of the American Chemical Society. 2005;127:3589. doi: 10.1021/ja043445m. [DOI] [PubMed] [Google Scholar]
- 45.Chen JYJ, Naidoo KJ. Journal of Physical Chemistry B. 2003;107:9558. [Google Scholar]
- 46.Naidoo KJ, Chen JYJ. Molecular Physics. 2003;101:2687. [Google Scholar]
- 47.Zhao H, Pan Q, Zhang W, Carmichael I, Serianni AS. Journal of Organic Chemistry. 2007;72:7071. doi: 10.1021/jo0619884. [DOI] [PubMed] [Google Scholar]
- 48.Leeflang BR, Vliegenthart JFG, Kroonbatenburg LMJ, Vaneijck BP, Kroon J. Carbohydrate Research. 1992;230:41. doi: 10.1016/s0008-6215(00)90512-3. [DOI] [PubMed] [Google Scholar]
- 49.Zhang W, Zhao H, Carmichael I, Serianni AS. Carbohydrate Research. 2009;344:1582. doi: 10.1016/j.carres.2009.06.007. [DOI] [PubMed] [Google Scholar]
- 50.Christensen NJ, Hansen PI, Larsen FH, Folkerman T, Motawia MS, Engelsen SB. Carbohydrate Research. 2010;345:474. doi: 10.1016/j.carres.2009.12.009. [DOI] [PubMed] [Google Scholar]
- 51.St Jacques M, Sundararajan PR, Taylor KJ, Marchessault RH. Journal of the American Chemical Society. 1976;98:4386. [Google Scholar]
- 52.Pereira CS, Kony D, Baron R, Müller M, van Gunsteren WF. Biophysical Journal. 2006;90:4337. doi: 10.1529/biophysj.106.081539. [DOI] [PMC free article] [PubMed] [Google Scholar]
- 53.Kroon J, Kroonbatenburg LMJ, Leeflang BR, Vliegenthart JFG. Journal of Molecular Structure. 1994;322:27. [Google Scholar]
- 54.MacKerell AD., Jr Journal Of Computational Chemistry. 2004;25:1584. doi: 10.1002/jcc.20082. [DOI] [PubMed] [Google Scholar]
- 55.Kirschner KN, Yongye AB, Tschampel SM, González-Outeiriño J, Daniels CR, Foley BL, Woods RJ. Journal of Computational Chemistry. 2008;29:622. doi: 10.1002/jcc.20820. [DOI] [PMC free article] [PubMed] [Google Scholar]
- 56.Lopes PEM, Rouz B, MacKerell AD., Jr Theoretical Chemistry Accounts. 2009;124:11. doi: 10.1007/s00214-009-0617-x. [DOI] [PMC free article] [PubMed] [Google Scholar]
- 57.Rick SW, Stuart SJ. Reviews in Computational Chemistry. Vol. 18. Wiley-Vch, Inc; New York: 2002. Potentials and algorithms for incorporating polarizability in computer simulations; p. 89. [Google Scholar]
- 58.Halgren TA, Damm W. Current Opinion in Structural Biology. 2001;11:236. doi: 10.1016/s0959-440x(00)00196-2. [DOI] [PubMed] [Google Scholar]
- 59.Cieplak P, Dupradeau FY, Duan Y, Wang JM. Journal of Pysics-Condensed Matter. 2009;21:333102. doi: 10.1088/0953-8984/21/33/333102. [DOI] [PMC free article] [PubMed] [Google Scholar]


