

Abstract
Measures of retrieval speed indicated that only a small subset of representations in working memory falls within the focus of attention. An n-back task, which required tracking an item 1, 2, or 3 back in a sequentially presented list, was used to examine the representation and retrieval of recent events and how control processes can be used to maintain an item in focal attention while concurrently processing new information. A speed–accuracy trade-off procedure was used to derive measures of the availability and the speed with which recent events can be accessed. Results converge with other time course studies in demonstrating that attention can be concurrently allocated only to a small number of memory representations, perhaps just 1 item. Measures of retrieval speed further demonstrate that order information is retrieved by a slow search process when an item is not maintained within focal attention.
Many core operations in complex cognitive tasks depend on the by-products of recent perceptual and cognitive processing. In language comprehension, for example, a reader/listener is frequently required to resolve long-distance dependencies in which a constituent assigns a grammatical and semantic role to a representation of a phrase processed at a much earlier point in the sentence (e.g., McElree, 2000). Similarly, subgoals in reasoning and problem solving often require access to the products of operations applied in earlier subgoals (e.g., Anderson, 1983).
The amount of information that can be processed at one time is limited, and, in many cases, it is unlikely that all the relevant by-products of recent processing can be actively maintained in the focus of attention. Whenever information exceeds the span of attention, successful execution of a cognitive operation requires shunting information between memory and focal attention. The span of attention places constraints on possible cognitive operations and the manner in which various mental computations must be performed. Determining the capacity of focal attention and how focal attention interfaces with different memory systems is an essential part of understanding complex cognitive tasks.
The experiments reported here use the n-back task (Awh et al., 1996; Cohen et al., 1994, 1997; Dobbs & Rule, 1989; See & Ryan, 1995; Smith & Jonides, 1997) to examine how much information can be maintained in focal attention while concurrently processing new information. Additionally, the task was used to examine the closely related issue of how information is shunted between memory and focal attention when attentional capacity is exceeded. The n-back task requires judging whether an item matches the nth-item back (e.g., 1-back, 2-back, 3-back) in a sequentially presented list of items. It challenges individuals to maintain the n-back item in focal attention while concurrently processing new items. Substantial demands are placed on control (executive) processes, because the response set must be continually updated as new items are encountered. For example, when a new item is presented, the former n-back item changes from a target to a distractor, the item that was formerly n – 1 back becomes the relevant target, and all items less than n-back must be marked as future targets. The paradigm is a useful one for studying the interaction of various control memory processes (Smith & Jonides, 1997), because it implements many of the demands placed on cognitive functions in circumstances in which information must remain focused across what is sometimes interfering but, at other times, relevant new information (e.g., McElree, 2000; McElree & Griffith, 1998).
A response-signal speed–accuracy trade-off (SAT) procedure was used to measure jointly the accuracy and the temporal dynamics of n-back judgments. Model fits of the time course data from Experiment 1 suggest that n-back judgments are accomplished by matching the test item to its representation in focal attention or, in cases in which the n-back item was not successfully maintained in focal attention, by using retrieval operations to reconstruct the linear order of recent events. The time course profiles indicate that the reconstruction of temporal order requires a relatively slow search of memory, similar to what has been found in tasks that require explicit order judgments (Gronlund, Edwards, & Ohit, 1997; McElree & Dosher, 1993). Experiment 2, which required judging whether an item matched any item up to and including 3-back, suggests that three items could not be effectively maintained in focal attention. This result parallels findings from several time course studies of recognition tasks, outlined later. Collectively, these results indicate that focal attention has a much smaller capacity than has typically been assumed (e.g., Cowan, in press) perhaps being restricted to one item only.
Focal Attention
What is the relationship between focal attention and various proposed memory systems? A classic view argues for two distinct representational states, one of which is associated with focal attention or awareness and the other with passive memory representations outside of focal attention. James (1890) subscribed to this view, arguing that primary memory should be equated with conscious awareness and is distinct from secondary memory, which is the repository of passive memory representations. Current approaches typically assume a tripartite functional architecture: a long-term memory (LTM) system consisting of all passive memory representations, a working memory (WM) system consisting of a small set of currently active representations, and a smaller set of representations that are the current focus of attention. WM is thought to be a limited-capacity system that enables a small number of items outside of focal attention to be maintained in a more accessible state than LTM representations, either because they are maintained in specialized storage structures (e.g., Badde-ley, 1986; Baddeley & Hitch, 1974; Schneider & Detweiler, 1988; Shallice & Vallar, 1990) or simply because they have residual activation from recent processing (e.g., Anderson, 1983; Conway & Engle, 1994; Cowan, 1995, in press; Engle, 1996; Ericsson & Pennington, 1993).
Several indirect lines of evidence have been used to motivate a tripartite architecture (Cowan, 1995; Nairne, 1996). However, McElree (1998; see also McElree & Dosher, 1989, in press; Wickelgren, Corbett, & Dosher, 1980) argued that measures of retrieval speed provide the most direct evidence for distinct representational states. Although by happenstance different representational states may be equally accessible, a natural prediction of tripartite architecture is that three distinct retrieval speeds should be observed. Information in focal attention should exhibit privileged access. Less recent representations—those that are beyond the capacity of focal attention but still within the span of WM—should be accessed slower than items within the focus of attention but faster than LTM representations in a passive state.
Measuring Access Speed
In principle, differences in the speed of accessing representations will be reflected in measures of reaction time (RT) derived from standard paradigms like the probe recognition task (e.g., Sternberg, 1966, 1975). Unfortunately, RT is also determined by the strength (or probability of access) of a memory representation (e.g., Dosher, 1976, 1981; McElree & Dosher, 1989; Ratcliff, 1978; Murdock, 1971; Wickelgren et al., 1980; Wickelgren, 1977). Memory strength affects the degree of match between a test probe and its memory representation, and differences in degree or quality of the match can engender differences in RT without affecting the underlying speed of retrieval. For example, Ratcliff's (1978; Rat-cliff, Van Zandt, & McKoon, 1999) diffusion model of memory retrieval proposes that memory strength determines the resonance between the test probe and its representation in memory. Resonance, in turn, controls the amount of information retrieved. A test probe with a high resonance value will exceed a response criterion before a test probe with a lower resonance value, thereby engendering faster RTs, even if both items are associated with the same rate of information accrual.
It is a near truism that memories will vary in strength or the probability of access depending on their time of acquisition (among others factors). Moreover, empirically derived forgetting functions show that loss of memory strength is particularly dramatic across early retention phases, phases that correspond to the standard assumption concerning the break among focal attention, WM, and LTM (e.g., Dosher & Ma, 1998; McBride & Dosher, 1997, 1999; Rubin & Wenzel, 1996; Rubin, Hinton, & Wenzel, in press; Wickelgren, 1972). Consequently, access or retrieval speed can be used to differentiate representational states only if it can be measured independently of potentially covarying differences in memory strength.
The standard solution to this problem is to derive a full time course function that describes how accuracy varies with retrieval time (Wickelgren, 1977). The response-signal SAT procedure derives such functions by cuing individuals to respond at several times after the onset of the recognition probe. The full time course of retrieval can be recovered with a suitable range of cuing times (e.g., 0.1–3 s), providing measures of when information first becomes available (an intercept), the rate at which information accrues over retrieval time, and the maximum or asymptotic level of performance. The SAT asymptote is a measure of the overall probability of retrieval and provides an estimate of underlying memory strength. The speed of retrieval is measured jointly by when information first becomes available and the rate at which it grows to asymptote. Information that is in a more accessible state will be associated with an earlier intercept or faster rate, irrespective of differences in asymptote (e.g., Dosher, 1976, 1981; Hintz-man & Caulton, 1997; Hintzman, Caulton, & Levitin, 1998; Hintz-man & Curran, 1994; McElree & Dosher, 1989, 1993; McElree & Griffith, 1995; Ratcliff, 1978; Reed, 1973, 1976; Wickelgren, 1977).
Retrieval in Subspan and Supraspan Lists
Wickelgren, Corbett, and Dosher (1980) used an SAT variant of a single-item probe recognition task (e.g., Sternberg, 1966, 1975) to examine time course profiles for various serial positions within lists of 16 sequentially presented consonants. SAT retrieval functions were derived for Serial Positions 16 (the last item on the list), 15, and 14 and for the averages of Serial Positions 13 to 11, 10 to 6, and 5 to 3, providing three time course profiles for what most researchers would consider to be subspan items (Positions 16, 15, and 14) and three time course profiles for supraspan items (Positions 13–11, 10–6, 5–3). Their data demonstrated that asymptotic accuracy decreased monotonically with the decreasing recency of the tested item, indicating that memory strength systematically declines as time or activity is interpolated between study and test. Crucially, however, retrieval speed (SAT intercept and rate) was constant across all serial positions except the last, most recently studied position (Serial Position 16). Retrieval speed for the last item processed was 50% faster than all other items.
Wickelgren et al. (1980) argued that the most recent item (Serial Position 16) remained active in awareness when no activity intervened between study and test. As a consequence, the recognition probe could be compared directly with the contents of focal attention. This engendered a form of privileged access, because, unlike less recent items, no retrieval process was needed to restore the item to a state in which it was amenable to ongoing cognitive operations.
Figure 1 schematically summarizes the effect of recency on the time course of retrieval. The probability of retrieving an item—a reflection of the availability of the representation, measured by SAT asymptote—decreases continuously as more information is interpolated between study and test. In contrast, accessibility—the speed of access, measured by SAT intercept and rate—shows a sharp dichotomous pattern. The last item processed can be accessed quickly; all other items are accessed more slowly but with the same retrieval speed. This pattern motivates a distinction between attended and nonattended states but not a further distinction corresponding to what a tripartite architecture posits as the break between WM and LTM. In short, the temporal dynamics of retrieval are indicative of two rather than three representational states.
Figure 1.
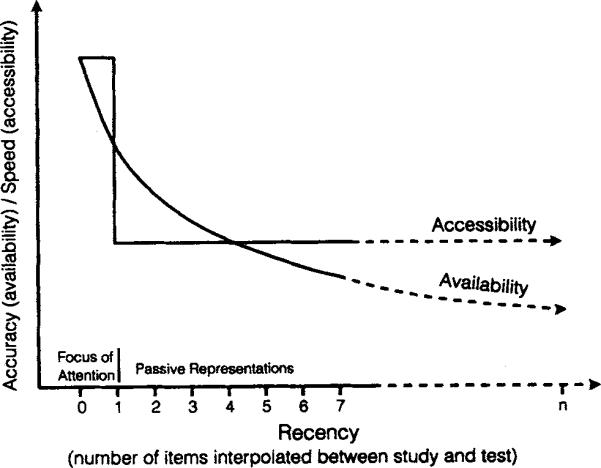
Schematic illustration demonstrating how the speed and accuracy of retrieval, measured by the response-signal speed–accuracy trade-off (SAT) procedure, vary with recency. As more time and items are interpolated between study and test, the availability of a memory representation decreases continuously, engendering lower levels of asymptotic accuracy. In contrast, retrieval speed shows a dichotomous pattern: Retrieval speed (SAT intercept and rate) is constant across all serial positions except the last unit processed (recency = 1), which can be accessed 50% faster than all other representations.
McElree and Dosher (1989) found the same dichotomous time course pattern in lists ranging from three to six words. For all list sizes, asymptotic accuracy decreased as the recognition probe was drawn from less recent positions, coupled with a small primacy effect for the first item on the list. Like Wickelgren et al. (1980), the retrieval speed for the last item was 44% to 55% faster than other positions, and there were no differences in retrieval speed among positions beyond the last.
Additionally, McElree and Dosher (1989) demonstrated that retrieval from what is traditionally thought to be WM is mediated by the same mechanism as retrieval from LTM. Most viable models of LTM posit content-addressable or direct-access retrieval processes (e.g., Gillund & Shiffrin, 1984; Hintzman, 1988; Murdock, 1982, 1993; see Clark & Gronlund, 1996, for a review). The key feature of such a process is that information can be retrieved from a set of cues without the need to search through other, potentially irrelevant information. Retrieval from WM has often been argued to be mediated by a qualitatively different type of mechanism. Sternberg's (1966, 1975) classic model of STM retrieval, and classes of related retrieval models (e.g., Treisman & Doctor, 1987; Theios, 1973), proposed that retrieval from a temporary store involves a serial search operation.
McElree and Dosher (1989) tested these specialized retrieval models by examining whether retrieval speed (SAT intercept and rate) varied with the size of the presumed WM set (set size) or the recency (serial position) of the test probe.1 Neither set size nor recency affected retrieval speed. These findings are inconsistent with search mechanisms in general and with the specialized mechanisms argued to underlie retrieval from WM. Thus, Wickelgren et al. (1980) demonstrated that there is no break point in retrieval speed that corresponds to the traditional sub- and supraspan distinction, and McElree and Dosher (1989) further demonstrated that there are no grounds to argue that subspan items are retrieved by a different mechanism than supraspan items. Both studies indicate that retrieval is markedly distinct for only the last unit processed and are inconsistent with approaches that posit an intermediate state between focal attention and LTM.
Further Evidence for Focal Attention
Does the privileged access associated with the most recently processed item truly reflect a special state associated with the focus of attention? Alternatively, the retrieval advantage may simply reflect a low-level physical or visual match (Posner, Boies, Eichelman, & Taylor, 1969). However, the advantage is not attenuated by imposing a pattern mask between study and test. McElree and Dosher (1989) found the same magnitude of effect with a pattern mask as the Wickelgren et al. (1980) study, which did not use a mask. Additionally, McElree and Dosher found that the advantage was not attenuated by varying letter case (upper vs. lower) between study and test (cf. Experiments 1 and 3; see also McElree, 1996, 1998). These results suggest that the retrieval advantage is mediated by an abstract rather than a low-level visual representation of the most recently processed item.
Stronger evidence for an abstract representation comes from an SAT comparison of recognition based on phonological and semantic cues. McElree (1996) presented five-word lists followed by a recognition probe that was a word from the list, a word that rhymed with a list item, a word that was a synonym of a word on the list, or a nonlist word. Individuals were cued after study to judge whether the probe was in the memory set (item judgment), rhymed with an item in the memory set (rhyme judgment), or was a synonym of an item in the memory set (synonym judgment). The SAT retrieval functions exhibited the same pattern as illustrated in Figure 1. For each type of judgment, recency affected asymptotic accuracy in a continuous fashion. However, retrieval speed (SAT intercept and rate) was equal for all serial positions within each judgment, except for the most recently studied position, which showed a large retrieval advantage. Synonym and rhyme judgments were associated with slower SAT dynamics than item judgments for all serial positions except the last position. For this position, dynamics were equal across the three judgments. These data indicate that the representation that is responsible for the fast processing dynamics is sufficiently abstract to enable phonological and semantic properties of the test probe to be directly matched to it.
If the retrieval advantage for the last item truly reflects those representations that are in focal attention, then the advantage should extend beyond the most recent item in circumstances in which more than one item is processed concurrently. Dosher (1981) reported an advantage for the last pair of items in a word-word paired-associate recognition task. McElree (1998) showed that the advantage extends to the last group of items when task demands induce concurrent encoding of more than one item. Nine-item lists, consisting of three instances from three categories, were presented for study. The words were presented sequentially, blocked by category membership. Like prior studies, asymptotic accuracy decreased with the recency of the test probe. Here, there were also bowed serial position effects within categories, indicating that individuals were using the category structure to encode the list. Again, two retrieval speeds were found, but in this case all three items from the last category were associated with a fast retrieval speed, and all items from the first two categories were associated with a second slower rate. This study provides strong support for the notion that the retrieval advantage stems from representations in focal attention.
The Capacity of Focal Attention
The findings from time course studies that only the last unit processed remains in focal attention contrasts with recent claims that the capacity of focal attention is between three and four items. Cowan (in press) reviewed evidence from several paradigms that suggests that there is a three- to four-item limit on the coding and reproduction of simultaneously presented items. Cowan argued that same limit holds when information is distributed across time. However, that evidence is less direct (McElree & Dosher, in press). The more direct evidence from measures of access speed indicates that focal attention is able to maintain one temporally extended event only. Usually this is the last item processed (McElree, 1996; McElree & Dosher, 1989; Wickelgren et al., 1980), but it may include more than one nominal item if those items can be simultaneously coded into a chunk that forms a single processing epoch (McElree, 1998).
Sustaining and Refocusing Attention
To date, the observed advantage in processing speed has been linked to the last unit encountered. Although this is a natural consequence of the fact that new items often elicit active processing, there need not be a direct coupling of focal attention and recent events. Indeed, one plausible function of an attentional mechanism is to maintain nonrecent events in an accessible state for ongoing and subsequent processing. The reported n-back experiments were undertaken to explore whether the capacity of focal attention is sufficient to enable individuals to maintain one or more items while concurrently processing new information.
The emphasis on focal attention contrasts with alternative accounts of the n-back task derived from tripartite approaches, specifically with those that assume that WM includes a temporary storage buffer (e.g., Baddeley, 1986; Baddeley & Hitch, 1974; Shallice & Vallar, 1990; Smith & Jonides, 1997). These approaches argue that control processes (e.g., subvocal rehearsal) are used to store the current and future n-back targets in a temporary buffer. Smith and Jonides (1997, 1999) interpreted the results of recent brain imaging studies of the n-back task in this fashion (Awh et al., 1996; Cohen et al., 1994, 1997). Using functional magnetic resonance imaging (fMRI) procedures, Cohen et al. (1997; see also Smith & Jonides, 1997, 1999) reported that the n-back task produces significant activation of Broca's area (Brodmann's area 44) and the dorsolateral prefrontal cortex (Brodmann's area 9/46). Activity in these regions increase with n, suggesting that demands on control processes, including rehearsal processes (Broca's area), increase as less recent items are tracked. Additionally, the posterior parietal area (Brodmann's area 40) shows an analogous increase in activation as n increases. Smith and Jonides (1997, 1999; see also Awh et al., 1996) suggested that the (left) posterior parietal area is associated with storage rather than control processes. In particular, they argued that it is the locus of the phonological buffer postulated in Baddeley's (1986) WM model. In this construal, increased activation in the posterior parietal region reflects the neural activity directly associated with increased storage demands.
The findings from time course analysis of item recognition—that there is no evidence for a differential retrieval speed for sub-and supraspan list positions (Wickelgren et al., 1980) and that retrieval does not qualitatively differ for sub- and supraspan lists (McElree & Dosher, 1989; see also McElree, 1996, 1998)—cast doubt on interpretations that assume a unique WM buffer. The view pursued here is that the n-back task is performed by using rehearsal or other control processes to attempt to maintain the item in focal attention. If the nth-item back is successfully maintained in focal attention, then it should be immediately available for matching to the test probe. If subsequent processing usurps the n-back item from focal attention, then the n-back target must be retrieved from more passive episodic representations.
The reported experiments examine accuracy and processing speed across 1-, 2-, and 3-back conditions. If the n-back target can be maintained in focal attention, access speed should be fast and should not vary across 1- to 3-back conditions. If the target cannot be actively maintained in focal attention, then it must be retrieved from a more passive memory state when a judgment is required. Retrieval requires more time than matching to focal attention, so minimally the time course functions will slow markedly whenever retrieval is required. Additionally, the n-back task requires the retrieval of temporal order information, because a positive response must be given only to an item in a particular position in the sequence. Current evidence indicates that the retrieval of item information is accomplished by a direct-access or content-addressable mechanism (McElree & Dosher, 1989), but temporal and positional order information is retrieved by a slow, search-like process (Gronlund et al., 1997; McElree & Dosher, 1993).
For example, McElree and Dosher (1993) used an SAT version of a judgment of recency (JOR) task to examine the recovery of order information. Like a probe recognition task, a list of items was sequentially presented followed immediately by a recognition probe. The test probes in the JOR task, however, consisted of two items from the list, and the task was to choose the item that occurred more recently. Retrieval dynamics for JORs depended on the recency of the most recent item in the test pair: Retrieval speed dramatically slowed as the most recent item in the test probe was drawn from less recent positions. The data reported in McElree and Dosher (1993) demonstrated that both the SAT intercepts and SAT rates were affected by recency, with the most dramatic effects on the intercept. The intercepts varied as much as 500 ms across a list of six consonants. The form of dynamics differences implicated a serial search process in which the search began from the most recent position and extended backward in time.2
The n-back task does not require an explicit judgment of recency. Nevertheless, restricting responses to a position in the list implicitly requires a determination of order. Temporal dynamics in the n-back task will be slower if an item has to be retrieved from memory rather than matched to focal attention, and they may also systematically increase with n if order information is required. The observed dynamics in any n-back condition may reflect mixtures of cases in which the test item is matched to focal attention and cases in which a retrieval process is needed to access the n-back item.
Experiment 1
The first experiment was designed to examine how retrieval speed and accuracy vary across 1-, 2-, and 3-back conditions. The standard version of the n-back task uses a continuous recognition paradigm, in which judgments are made after each item is presented. However, this procedure is not optimal for collecting time course data. In the SAT procedure, individuals are cued to respond at various times after the onset of a test item, here at one of seven times ranging from 43 to 3,000 ms. In a continuous recognition paradigm, the different response lags would introduce large differences in retention interval (time between study and test) and in study time for trials within a condition. In the latter case, for example, judgments would be made on items that varied in presentation times from 43 to 3,000 ms. A modified probe recognition paradigm avoids differences in retention interval and study time. Figure 2 presents a schematic of the procedure. A sequential list of items was presented on each trial, followed by a single test item. The task demands inherent in a standard n-back paradigm were implemented by randomly varying the number of items in the list from 6 to 15 letters. The unpredictable list length challenged individuals in exactly the same way as a continuous recognition variant: Because individuals did not know when the test item would appear, the response set had to be modified as new items were presented.
Figure 2.
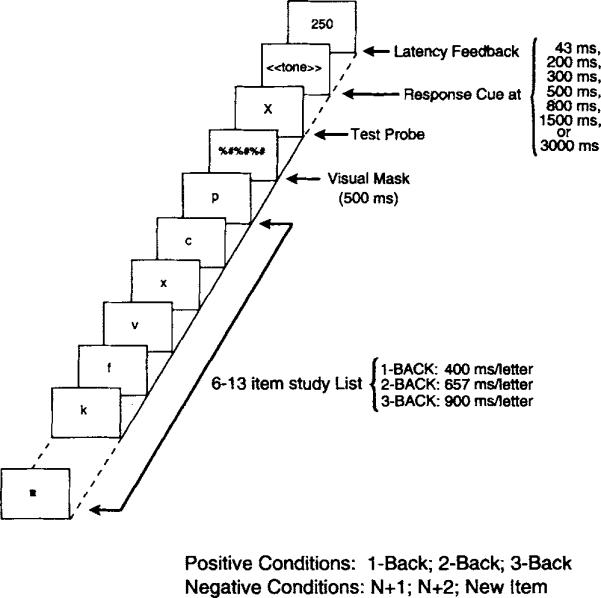
Sample trial sequence illustrating the speed—accuracy trade-off (SAT) variant for the n-back task used in Experiment 1.
The 1 -back, 2-back, and 3-back conditions were run in separate sessions. Blocking ensured that participants could optimally adapt study strategies to the demands of each target position. Additionally, the rate of presentation of items (letters) was decreased with n; a 400-ms/letter rate was used for 1-back, a 657-ms/letter rate for 2-back, and a 900-ms/letter rate for 3-back. The rate was systematically slowed to provide more time for control processes in the more demanding 2- and 3-back conditions. Rates were selected on the basis of exploratory sessions with two pilot participants. Individuals reported that these rates provided sufficient time to rehearse items up to and including the n-back item, and that slower rates in fact disrupted their ability to integrate rehearsal with the presentation of new items.
Method
Participants
Six students from New York University participated in nine 45-min sessions, plus two additional 1-hr practice sessions. One practice session served as training for the SAT procedure and the other as training in the 1-back, 2-back, and 3-back conditions. All participants had normal or corrected vision.
Materials
Study lists were composed of 6 to 13 letters randomly sampled (without replacement) from the set: B, C, D, F, H, J, K, L, M, P, R, S, T, V, and X. The study list was presented in lowercase, and the test probe in uppercase.
Procedure
Stimulus presentation and response collection were controlled by a personal computer. Each trial consisted of the presentation of a 6- to 13-letter study list. List length was randomized across trials. An equal number of positive and negative test probes was used. Half of the negative trials used were drawn from the n + 1 and n + 2 positions and the remaining from a letter not presented in the study list. List and nonlist lures were used to estimate the degree to which responses were based on overall familiarity versus specific list information (see Appendix).
The sequence and timing of events within a trial are schematically illustrated in Figure 2 and were as follows.
First, a centered, square fixation point was presented for 500 ms. Second, study letters were sequentially presented for 400 (1-back), 657 (2-back), or 900 (3-back) ms in the center of an otherwise blank screen. Third, the final letter in the study list was masked by a collection of nonletter symbols presented for 500 ms. Fourth, the test letter was presented in the same region as the study list and mask. Fifth, the test letter remained on the screen for 43, 200, 300, 500, 800, 1,500, or 3,000 ms, at which point the screen cleared and a 50-ms (2,000-Hz) tone sounded to cue the individuals to respond. Participants responded by pressing one of two keys on a numeric keypad to denote either that the test item had appeared in the n-back position (3) or not (1). And sixth, after a response, visual feedback on the participant's latency to respond to the interruption tone was presented. Participants were instructed to respond within 300 ms of the tone. They were informed that responses longer than 300 ms were too long and that responses faster than 120 ms were anticipations. Participants initiated the next trial by pressing a key.
Each 30- to 45-min session (depending on presentation rate) consisted of 280 trials. Each participant performed three sessions for each n-back condition. For each individual, this yielded 60 positive trials for each n-back condition at each of the seven response lags and 30 negative trials for the combinations of n + 1 and n + 2 distractors and 30 negative trials for nonlist distractors for each of the seven response lags. Sample size was sufficient to yield stable data for individual participants.
Data analysis
Equal-variance Gaussian d′ scores were computed to derive time course measures that were not influenced by particular response biases. The primary measure scaled the hit rate for each positive condition against the false-alarm rate for the average of n + 1 and n + 2 distractor conditions. This provided a measure of the ability to discriminate different ordinal positions in the sequence. Perfect performance at any lag was adjusted by a minimum-error correction (Macmillan & Creelman, 1991) to ensure that the d′ values were measurable given the sample sizes. The Appendix presents a second type of scaling that was used to examine differences between list and nonlist distractors.
To estimate asymptotic accuracy and processing dynamics (speed), the empirical SAT functions were fit with an exponential approach to a limit:
| (1) |
Equation 1 describes the growth of accuracy over processing time using three parameters: (a) λ, an asymptotic parameter reflecting the overall accuracy at maximal processing time; (b) δ, an intercept parameter reflecting the discrete point in time when accuracy departs from chance (d′ = 0); and (c) β, a rate of rise parameter that describes the rate at which accuracy grows from chance to asymptote. Numerous studies found that Equation 1 provides a precise quantitative summary of the shape of a full time course SAT function (e.g., Dosher, 1976; McElree, 1993, 1996; McElree & Dosher, 1989, 1993; Reed, 1973, 1976; Wickelgren, 1977; see also Ratcliff, 1978, for an alternative three-parameter equation derived from the random-walk [diffusion] model and McElree & Dosher, 1989, for a comparison of the two equations).
All analyses were performed on the individual participant's data. Consistent patterns across participants were summarized with the fits of the average (over participants) data. Differences among the SAT functions were quantified by fitting Equation 1 to the data with an iterative hill-climbing algorithm (Reed, 1976), similar to STEPIT (Chandler, 1969), which minimized the squared deviations of predicted values from observed data. A hierarchical model testing scheme was used. The SAT data were fit with sets of nested models that systematically varied the three parameters of Equation 1. These models ranged from a null model, in which 1-back, 2-back, and 3-back functions were fit with a single asymptote (λ), rate (β), and intercept (δ) to a fully saturated model in which each function was fit with a unique set of parameters. The quality of the fit was assessed using three criteria: The first was the value of an R2 statistic,
| (2) |
where di represents the observed data values, indicates the predicted values, is the mean, n is the number of data points, and k is the number of free parameters (Reed, 1973). This R2 statistic is the proportion of variance accounted for by the fit, adjusted by the number (k) of free parameters (Judd & McClelland, 1989). The second was evaluation of the consistency of parameter estimates across the subjects. The third was evaluation of whether the fit yielded systematic (residual) deviations that could be accommodated by allocating more (i.e., separate) parameters to various conditions.
Results and Discussion
N-back detection
Figure 3 presents the average (over participants) d′ data as a function of retrieval or processing time (lag of the interruption cue plus the latency to respond to the cue) for the three positive n-back conditions scaled against the average of the n + 1 and n + 2 distractor conditions.
Figure 3.
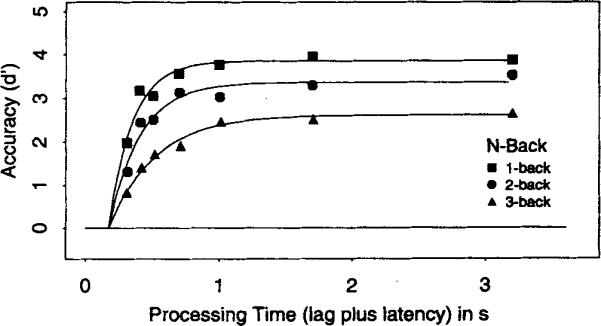
Average d′ accuracy (symbols) as a function of processing time (lag of the response cue plus latency to respond to the cue) for the 1-back, 2-back, and 3-back conditions in Experiment 1. Smooth curves show the best fits of Equation 1 with the (average) parameters listed in Table 1.
Figure 3 shows that asymptotic accuracy decreased as the n increased. The average d′ score at the longest interruption time (3 s) was 3.9 for 1-back, 3.5 for 2-back, and 2.6 for 3-back. An analysis of variance (ANOVA) on the d′ scores at the longest interruption time was significant across participants, F(2, 10) = 7.06, MSE = 0.338. These asymptotic differences indicate that the probability of identifying the n-back target with maximal processing time decreased as additional items intervened between study and test. Prima facie, the substantial differences in asymptotic levels demonstrate that participants were not completely successful in maintaining the n-back target in focal attention, and that they were less likely to retrieve the n-back target from memory representations outside of focal attention when more items intervened between study and test. The inability to retrieve the relevant n-back target may represent the loss of item or order information as time and the number of items interpolated between study and test increased.
Retrieval speed was the primary datum of interest. Retrieval speed was assessed by competitive fits of Equation 1 to the full time course functions to test whether the two dynamics parameters, rate (β) and intercept (δ), varied across the n-back conditions. However, the systematic asymptotic effects required that the functions were first fit by models that allocated a separate asymptote (λ) to each n-back condition. A 1λ-1β-1δ (null) model, in which all three conditions were fit with a common set of parameters, produced extremely low adjusted-R2 values, .454 in the average data (range = .193-–822 across the 6 participants). In contrast, a 3λ-1β-1δ model, in which a separate asymptote (λ) was allotted to each n-back condition, produced an adjusted-R2 value of .926 in the average data (range = .767–.868 across the 6 subjects). Equally important, this model yielded a consistent set of λ estimates across the three n-back conditions. In the average data, the λ estimates were 4.0, 3.3, and 2.4 for 1- to 3-back (respectively), and every participant showed this ordering of estimates. Consonant with the ANOVA on the d′ scores at the longest interruption time, the difference in parameter estimates was also significant, F(2, 10) = 21.3, MSE = 0.226.
Further model fits demonstrated that the n-back conditions did not simply differ in the probability that a representation of the target item could be accessed (λ). In the average data, a 3λ-3β-1δ model, in which each n-back condition was allotted a separate rate (β) in addition to asymptote (λ), improved the fit to .956. No other model with fewer, higher, or a different allocation of parameters yielded as high an adjusted-R2 value. The 3λ-3β-1β model indicates that retrieval speed systematically slowed as n increased from 1- to 3-back. The average rate (β) estimates were 231 in β−1-ms units for 1-back, 344 ms for 2-back, and 581 ms for 3-back. This order was evident in every participant,3 and an ANOVA on the rate estimates was significant, F(2, 10) = 25.1, MSE = 0.0037. The parameter estimates for the 3λ-3β-1δ model are presented in Table 1 for the average data and each participant. The smooth functions in Figure 3 are fits of the 3λ-3β-1δ model to the average data using the parameters listed in Table 1.
Table 1.
Exponential Parameter Estimates From Experiment 1
| Participant |
|||||||
|---|---|---|---|---|---|---|---|
| Parameter | Avg | E.O. | H.M. | M.L. | S.F. | S.G. | Y.P. |
| λ 1-back (d' units) | 3.87 | 4.31 | 2.85 | 4.04 | 4.18 | 4.29 | 4.11 |
| λ 2-back (d' units) | 3.36 | 4.14 | 2.03 | 3.84 | 3.46 | 4.16 | 3.07 |
| λ 3-back (d' units) | 2.62 | 3.48 | 1.57 | 2.86 | 2.40 | 4.08 | 1.23 |
| β−1 1-back (s) | 0.231 | 0.068 | 0.179 | 0.160 | 0.086 | 0.106 | 0.637 |
| β−1 2-back (s) | 0.344 | 0.085 | 0.290 | 0.352 | 0.152 | 0.137 | 0.748 |
| β−1 3-back (s) | 0.581 | 0.172 | 0.392 | 0.520 | 0.252 | 0.183 | 0.886 |
| δ common (s) | 0.172 | 0.230 | 0.148 | 0.152 | 0.229 | 0.203 | 0.199 |
| Adjusted R2 | .956 | .939 | .927 | .924 | .896 | .894 | .851 |
Note. Avg = average. All other abbreviations are participants' initials.
Like the asymptotic differences, the systematic slowing of the rate (β) parameters indicates that the target item was not perfectly maintained in focal attention across 1- to 3-back conditions, and that a retrieval operation was required to restore the target item to active processing on some portion of trials (see later discussion). The ordering of rate (β) parameters is indicative of a backward or recency-based search operation, as has been found in tasks that explicitly require the recovery of order information (McElree & Dosher, 1993; see also Gronlund et al., 1997). That is, restricting responses to a particular ordinal position in the list appears to require the same type of retrieval operations that are required for overt judgments of order. The Appendix presents an analysis of the rejection of list (n + 1 and n + 2) lures that is consistent with this contention, in that the time at which a list lure can be discriminated from a nonlist lure also systematically increased across 1- to 3-back conditions.
Search models
The dynamics (rate) differences suggest that the ordinal position of a target item was determined, in part, by a serial search that began with the most recent item and moved backward through the list. That contention was further evaluated by fitting an explicit search model to the data. At issue was whether such a model provides a sufficient explanation of the data. In particular, could the pattern of data be explained without assuming that the n-back item was maintained in focal attention on a portion of trials?
McElree and Dosher (1993) found that systematic dynamics differences in the JOR task were well fit by a backward search model, in which the list was serially searched in the order of recency. That model was adapted to the n-back task, with the plausible assumption that the same type of retrieval mechanism was used to recover order information in both tasks. The probability that a single memory comparison operation finishes by time t was represented as an exponential with a rate of information accrual equal to β. A serial model entails that the search was accomplished by performing a sequence of these comparison operations. The probability that a series of exponentially distributed comparisons will be completed by time t is gamma distributed, with an order α equal to the number of implicit comparison processes:
| (3) |
Equation 3 is a cumulative gamma function, representing the convolution of α independently and identically distributed exponential distributions, each of which describes the completion time for a single comparison in a serial search. The overall function is offset by a base time δ to reflect encoding and response time.
To compute the probability of a correct response as a function of processing time for the n-back conditions, gammas of various orders (α) must be used to model the different number of comparison processes implicit in each condition. The number of comparisons is equal to the number of memory representations that must be searched up to and including the target item. Therefore, the order (α) of the gamma for each n-back condition is equal to n. Consistent with the empirical differences in SAT asymptote and the analogous λ differences in the descriptive exponential fits, the overall probability of finding a target was assumed to vary across n-back conditions. The asymptotes (λs) were scalar values for the gamma function and were estimated from the data. The rate (β) of the comparison process and intercept (δ) of the overall gamma function were free parameters.
The top panel of Figure 4 shows the fits of the pure search model to the average d′ data. Although the free λ parameters ensured that the model adequately fit the asymptotic differences, the serial search assumption overpredicted the range of dynamics differences across 1- to 3-back conditions. At times less than 500 ms, the model overpredicted performance for the 1-back condition but underpredicted performance for the 3-back condition. This systematic misfit of the data indicates that the observed dynamics differences are not compatible with a pure serial search assumption. Note that this misfit is not a consequence of particular modeling assumptions. Whereas other distributions could be used to model a serial process, plausible distributions will misfit the data in exactly the same manner as the gamma distribution. The failure of the model is not because the exponential rises too slowly or too quickly—rate of rise is a free parameter—but rather is due to the core assumption that retrieval is mediated by a pure sequentially ordered search. Such an assumption mathematically requires that overall performance is determined by convolving the finishing time distributions for each comparison process. The inability of the model to capture the observed range stems directly from this convolution requirement.
Figure 4.

Top panel: Best fit of a pure backward-search model to the average d′ data from Experiment 1. Bottom panel: Best fit to the average d′ data from Experiment 1 with a mixture of a backward search and a direct match to focal attention using the (average) parameters listed in Table 2.
An alternative model is that the time course functions reflect a mixture of responses based on two states. On a proportion of trials, individuals succeed in maintaining the nth-item back in focal attention, thereby circumventing the need for a search process. On the remainder of trials, a search process is used to recover the nth-back item from memory representations outside of focal attention. This mixture model was fit to the data by allotting a parameter to the 2-back and 3-back conditions that estimated the proportion of search trials. When a search was required, the gamma function outlined previously was used. When the n-back target was in focal attention, a simple exponential (Equation 1) was used to model the matching operation. It was assumed that the target was always maintained in focal attention in the 1-back condition. This assumption is consistent with item recognition studies demonstrating that the test item is matched to the contents of focal attention when no list item intervenes between study and test (McElree, 1996, 1998; McElree & Dosher, 1989, 1993; Wickelgren et al., 1980).
The bottom panel of Figure 4 shows the fit of the mixture model to the average data. In contrast to the pure search model (top panel), this model more accurately fit the range of dynamics differences across the three conditions in that it did not systematically overpredict 1-back dynamics nor underpredict 3-back dynamics. Table 2 lists the parameter estimates of the mixture model for the average data and individual participants. For the average data, the proportion of search trials was .11 in the 2-back condition and .27 for the 3-back condition. The proportion of searches was higher for 3-back than for 2-back in all but 2 individuals (M.L. and Y.P.), who showed nearly identical estimates. The difference in the likelihood of a search was marginal, t(6) = 2.23, p = .06 (but see Experiment 2); however, the ordering of estimates is consistent with the contention that the n-back target was more likely to be displaced from focal attention as more material was processed between study and test.
Table 2.
Parameter Estimates for the Mixture Model for Experiment 1
| Participants |
|||||||
|---|---|---|---|---|---|---|---|
| Parameter | Avg | E.O. | H.M. | M.L. | S.F. | S.G. | Y.P. |
| λ 1-back (d' units) | 4.07 | 4.74 | 3.15 | 4.30 | 4.51 | 4.07 | 4.16 |
| λ 2-back (d' units) | 3.46 | 4.48 | 2.09 | 3.94 | 3.62 | 4.23 | 3.05 |
| λ 3-back (d' units) | 2.71 | 3.56 | 3.60 | 2.92 | 2.59 | 4.20 | 1.17 |
| Proportion of searches in 2-back | .11 | .05 | .07 | .53 | .18 | .29 | .12 |
| Proportion of searches in 3-back | .27 | .10 | .26 | .51 | .35 | .46 | .11 |
| β−1 common (s) | 0.342 | 0.342 | 0.452 | 0.342 | 0.341 | 0.173 | 0.067 |
| δ common (s) | 0.116 | 0.010 | 0.010 | 0.014 | 0.101 | 0.296 | 0.292 |
| Adjusted R2 | .916 | .612 | .717 | .901 | .811 | .726 | .849 |
Note. Avg = average. All other abbreviations are participants' initials.
Experiment 2
Model fits of the time course data suggest that the n-back task is mediated by a mixture of two processes: (a) a fast matching of the test probe to representations in focal attention and (b) a slow search process for cases in which the target item was not maintained in focal attention. A search process was motivated by the systematic slowing of dynamics as n increased. The difference in dynamics is not consistent with the contention that n-back judgments were mediated by a direct-access or content-addressable retrieval process, as is found for item recognition (McElree & Dosher, 1989), nor with the contention that such judgments were exclusively mediated by matching the test item to the contents of focal attention. However, that n-back judgments are sometimes mediated by a fast matching process was indirectly motivated by the failure of a pure search model to capture the range of observed dynamics differences adequately. The purpose of the second experiment was to provide more direct behavioral evidence for the role of a limited-capacity attention mechanism.
The logic of the second experiment was to vary the demands on control processes to differentially affect the likelihood that target items could be actively maintained in focal attention at test time. Two variants of a 3-back condition were used. One was the standard 3-back condition used in the first experiment, in which individuals were required to respond positively to a test item only if it occurred 3 items back. This condition is referred to as 3-back exclusion, because individuals were required to exclude all positions other than 3-back. A second variant, referred to as 3-back inclusion, required participants to respond positively to all items up to and including 3-back (viz., 1-back, 2-back, and 3-back). If the n-back task is in part performed by actively maintaining the n-back item within the focus of attention, then n-back inclusion challenges individuals to maintain three items rather than one item within the focus of attention. Performance should suffer as a consequence of the additional attentional demands.
The crucial prediction concerns the speed of retrieval for the two types of 3-back conditions. If the time course functions observed in the first experiments were composed of a mixture of fast matching operations and slow search operations, as the model fits of Experiment 1 suggest, then the dynamics (rate or intercept) of the 3-back condition in the exclusion task should be faster than the dynamics of the 3-back condition in the inclusion condition. For 3-back exclusion, control processes that serve to maintain an item within the focus of attention can be directed at one rather than three items. Relative to the 3-back inclusion condition, this should increase the probability that the relevant item is maintained in focal attention and decrease the proportion of trials on which a slower search process is required. The net effect of increasing the proportion of fast matching trials will be to speed the overall function. Alternatively, if three items are within the capacity of focal attention, then no difference in retrieval speed is predicted, because an individual can respond positively if the test item matches any of the items in focal attention. McElree (1998) found that, according to these criteria, three words could be maintained in focal attention, but only if they formed a semantic unit or chunk. No time course study has found that more than one discrete unit can be actively maintained in focal attention across intervening material.
Additionally, this experiment was used to provide further evidence for a slow search process. The 3-back inclusion task included 1-back and 2-back test items in addition to 3-back test items. On the basis of Experiment 1, asymptotes should decrease and dynamics should slow as n increases if order information is used to restrict positive responses to the last three positions on the list. It is important to note that this is a nontrivial extension of the findings reported in Experiment 1. A positive response in the inclusion task (but not the exclusion task) could be based on a simple assessment of familiarity rather than on the output of a (slow) search process. To do so, an individual need only set a criterion on familiarity that would differentiate items greater than 3 back from items less than 4 back. McElree and Dosher (1993) argued that, in principle, JOR tasks could also be based on an assessment of familiarity (in this case, by a direct assessment of the difference in familiarity between the two JOR probes). However, the data indicated that JOR performance was nevertheless mediated by a (slow) search process. Model fits demonstrated that if the JOR task was mediated by familiarity, the levels of asymptotic performance would have been far less (2.0 d′ units) than the observed levels. Apparently, individuals opted for a slower search process to maximize accuracy. The same may be true of the n-back inclusion task.
Method
Participants
Seven students from New York University served as participants. None had participated in Experiment 1. Each individual participated in sixteen 50-min experimental sessions, consisting of eight 3-back exclusion sessions interleaved with eight 3-back inclusion sessions. Participants performed one practice session for training in the SAT procedure. All participants had normal or corrected vision.
Materials, procedure, and data analysis
The same method as in Experiment 1 was used, with several exceptions. In the exclusion task, lures consisted of items from the 1-back, 2-back, and 4-back positions, and new (nonlist) items in equal (.25) proportions. In the inclusion task, lures consisted of items from the 4-back position and new (nonlist) items. Overall, an equal number of positive and negative test probes was used in both tasks. Inclusion and exclusion sessions were interwoven to equate practice across the 16 experimental sessions. The presentation rate was 900 ms, as in the 3-back condition of Experiment 1.
Results and Discussion
N-back detection
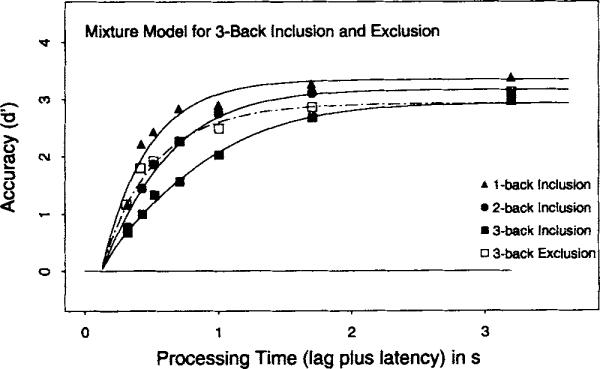
Figure 5 presents the average (over subjects) d′ data as a function of processing time for the three inclusion conditions and the one (3-back) exclusion condition. In each case, the d′ measure was constructed by scaling the hit rate for the positive conditions against the false-alarm rate from the n + 4 distractor conditions in the corresponding task.
Figure 5.
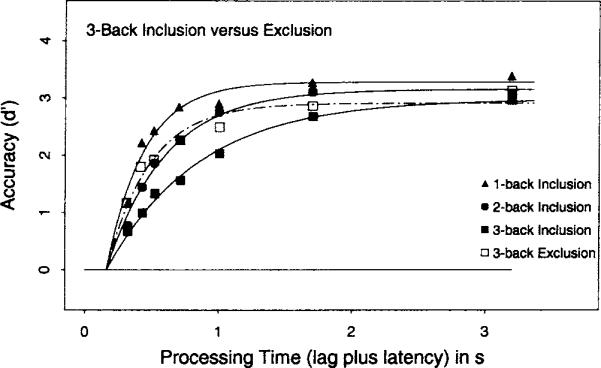
Average d′ accuracy (symbols) as a function of processing time (lag of the response cue plus latency to respond to the cue) for the 1-back, 2-back, and 3-back inclusion conditions and the 3-back exclusion condition in Experiment 2. Smooth curves show the best fits of Equation 1 with the (average) parameters listed in Table 3.
Consider first the n-back inclusion task. Inspection of the filled symbols in Figure 5 indicates that asymptotic accuracy decreased as n increased. The average d′ score at the longest interruption time (3 s) was 3.3 for a 1-back target, 3.1 for a 2-back target, and 2.7 for a 3-back target. An ANOVA on the d′ scores at the longest interruption time was significant across subjects, F(2, 12) = 5.8, MSE = 0.131. Analogous to Experiment 1, these asymptotic differences provide prima facie evidence that three n-back targets could not be perfectly maintained in focal attention, and that the probability of recovering the relevant target from a memory representation decreased as more items intervened between study and test.
The significant differences in asymptote required allotting separate λ parameters in fits of the full time course data with Equation 1. A 1 λ-1/β-1δ (null) model, in which all three conditions were fit with a common set of parameters, produced a low adjusted-R2 value of .753 in the average data (range = .216–.917 across the 7 participants). In contrast, a 3λ-1/β-1δ model, in which a separate asymptote (λ) was allotted to each n-back condition, produced an adjusted-IR2 of .906 in the average data (range = .769–.916 across the 7 participants). This model yielded a consistently ordered set of A estimates across the three n-back conditions. In the average data, the λ estimates were 3.55, 3.07, and 2.5 for 1-, 2-, and 3-back, respectively, and the difference in parameter estimates was significant across subjects, F(2, 12) = 11.4, MSE = 0.166.
Subsequent model fits clearly demonstrated, as in Experiment 1, that retrieval dynamics also systematically slowed as n increased. The form of the dynamics difference was again best expressed in SAT rate (β), in that a 3λ-3β-1δ model gave the highest adjusted-R2 value for the average data and all 7 participants. For the average data, the adjustedR2 was .977 (range = .871–.932 across the 7 participants), with β−1 estimates of 238 ms for a 1-back, 386 ms for a 2-back, and 629 ms for a 3-back target. All participants showed this ordering of β estimates, F(2, 12) = 17.3, MSE = 1.170. The systematic differences in rate are consistent with the notion that restricting positive responses to a list position induced a backward search operation of the form seen in Experiment 1 and other order tasks like JOR.
Turning to the crucial 3-back exclusion condition, inspection of Figure 5 suggests that the 3-back exclusion condition was associated with faster dynamics than the corresponding 3-back inclusion condition in that the former had substantially higher d, values early in retrieval (times less than 1 s). This contention was directly supported by model fits in which the 3-back exclusion condition was jointly fit with the three n-back inclusion conditions. A 4λ-4β-1δ, in which the exclusion condition was allotted a separate asymptote (λ) and rate (β) parameter, yielded a modest and nonsignificant difference in asymptotes between 3-back inclusion and exclusion, t(6) = 0.13, ns, but a large and reliable difference in rate, t(6) = 3.3,p < .01. In the average data, the β−1 rate estimates were 689 ms for 3-back inclusion and 317 ms for 3-back exclusion. All participants showed a faster rate estimate for the 3-back exclusion condition. Parameter estimates from the 4λ-4β-1δ model are presented in Table 3.
Table 3.
Exponential Parameter Estimates From Experiment 2
| Participants |
||||||||
|---|---|---|---|---|---|---|---|---|
| Parameter | Avg | A.D. | A.K. | A.M. | D.A. | E.L. | K.S. | T.T. |
| λ 1-back inclusion (d' units) | 3.28 | 2.98 | 2.84 | 2.82 | 2.96 | 3.86 | 4.27 | 3.08 |
| λ 2-back inclusion (d' units) | 3.15 | 1.61 | 2.94 | 2.88 | 1.61 | 3.90 | 4.19 | 3.24 |
| λ 3-back inclusion (d' units) | 2.98 | 1.39 | 3.59 | 2.99 | 1.32 | 3.85 | 4.16 | 2.45 |
| λ 3-back exclusion (d' units) | 2.91 | 1.42 | 3.48 | 3.13 | 1.41 | 4.00 | 4.27 | 3.01 |
| β−1 1-back inclusion (s) | 0.277 | 0.344 | 0.446 | 0.315 | 0.344 | 0.206 | 0.215 | 0.164 |
| β−1 2-back inclusion (s) | 0.469 | 0.458 | 0.536 | 0.560 | 0.458 | 0.322 | 0.246 | 0.332 |
| β−1 3-back inclusion (s) | 0.689 | 1.001 | 0.781 | 1.312 | 1.010 | 0.498 | 0.420 | 0.704 |
| β−1 3-back exclusion (s) | 0.317 | 0.892 | 0.621 | 0.391 | 0.884 | 0.215 | 0.067 | 0.335 |
| δ common (s) | 0.161 | 0.141 | 0.148 | 0.167 | 0.152 | 0.225 | 0.188 | 0.162 |
| Adjusted R2 | .965 | .887 | .927 | .833 | .887 | .911 | .942 | .869 |
Note. Avg = average. All other abbreviations are participants' initials.
In the average data, the rate estimate for 3-back exclusion was positioned between the estimates for 1-back and 2-back inclusion, slightly slower than 1-back inclusion (317 ms vs. 277 ms) and somewhat faster than 2-back inclusion (317 ms vs. 469 ms). However, both pairwise comparisons were nonsignificant across subjects, t(6) = 0.01 and t(6) = 0.58, respectively. For individual participants, the rate estimate for 3-back exclusion was between 2- and 3-back inclusion (A.D., A.K., D.A., T.T.), between 1- and 2-back inclusion (A.M., E.L.) or, in one case (K.S.), earlier than 1-back inclusion. Given this distribution of differences, the 4λ-4β-1δ model provided the best summary of the data, because it places no constraints on the relative ordering of the rate parameter for 3-back exclusion. This model yielded one of the highest adjusted-R2 values (.975 in the average data; range = .833–.942 across subjects), although for some participants a slight improvement in adjusted-R2 (less than .01) was observed for 4λ-3β-1δ models, in which the rate for 3-back exclusion was constrained to be equal to either 1- or 2-back inclusion. However, these differences were small and of little theoretical consequence. The crucial fact is that the rate for 3-back exclusion was found to be statistically faster than that for 3-back inclusion, and this fact directly motivates the claim that the n-back task is in part mediated by actively maintaining the target item in focal attention.
The logic of comparing 3-back inclusion and exclusion was that the latter enables individuals to focus on one rather than three items. Maintaining an item in the focus of attention circumvents a search process, and so dynamics should be appreciably faster in the exclusion condition. The data confirm that prediction. Whether 3-back inclusion is faster than 1- or 2-back inclusion is determined by the efficiency of maintaining more than one item in an active state. The data indicate that there are individual differences in this ability, although all participants were better at maintaining one rather than three items. An interesting property of the data is that, although there were large differences in retrieval speed between 3-back inclusion and exclusion, there were no reliable differences in asymptotic accuracy. This suggests that the asymptotic levels of performance were largely determined by the recency of the target item.
Search model
The mixture model used to fit the data of Experiment 1 was applied to the joint inclusion and exclusion data. Of interest was whether the differences between 1-, 2-, and 3-back inclusion conditions and, crucially, the difference between the 3-back exclusion and inclusion conditions could be adequately modeled by different mixtures of a search and a fast matching operation. As before, the 1-back condition was assumed to always involve matching the test item to the item active in focal attention. The 2-back inclusion, 3-back inclusion, and 3-back exclusion conditions were given a separate parameter that determined the relative proportion of search and matching operations. If the target item could be more accurately maintained in focal attention in the 3-back exclusion task, then the estimated proportion of searches should be lower than in the 3-back and possibly 2-back inclusion conditions.
Figure 6 shows the fit of the mixture model to the average data using the parameters listed in Table 4. Overall, the model captured the dynamics differences well, yielding an adjusted-R2 of .964, which is comparable to the best fitting exponential (descriptive) model. As in Experiment 1, these differences in dynamics were produced by varying the proportion of search operations across conditions greater than 1-back. The average proportion of trials in which a search was required was .38 for 2-back inclusion compared with .48 for 3-back inclusion. All participants had a higher proportion in 3-back inclusion than 2-back inclusion, t(6) = 3.5, p = .01. Crucially, the proportion in 3-back exclusion was substantially lower than 3-back inclusion: .08 versus .48 in fits of the average data. This supports the hypothesis that participants were better able to maintain the 3-back target in focal attention in the less demanding exclusion task. All participants but 1 (A.D.) showed a lower proportion in 3-back exclusion, t(6) = 2.8, p = .03. In the average data, fewer search operations were performed in 3-back exclusion than 2-back inclusion (.08 vs. .38), but the difference across subjects was not significant, t(6) = 1.3, p = .23.
Figure 6.
Best fit to the average d′ data from Experiment 2 with a mixture of a backward search and a direct match to focal attention using the (average) parameters listed in Table 4.
Table 4.
Parameter Estimates for the Mixture Model for Experiment 2
| Participants |
||||||||
|---|---|---|---|---|---|---|---|---|
| Parameter | Avg | A.D. | A.K. | A.M. | D.A. | E.L. | K.S. | T.T. |
| λ 1-back inclusion (d' units) | 3.35 | 3.67 | 2.86 | 2.93 | 3.31 | 4.07 | 3.91 | 3.26 |
| λ 2-back inclusion (d' units) | 3.17 | 3.41 | 2.94 | 2.95 | 1.67 | 3.99 | 4.13 | 3.34 |
| λ 3-back inclusion (d' units) | 2.93 | 2.79 | 3.60 | 2.68 | 1.42 | 3.92 | 4.22 | 2.40 |
| λ 3-back exclusion (d' units) | 2.99 | 1.99 | 3.49 | 3.38 | 1.51 | 4.21 | 4.52 | 3.19 |
| Proportion of searches in 2-back inclusion | .38 | .36 | .16 | .49 | .10 | .24 | .72 | .51 |
| Proportion of searches in 3-back inclusion | .48 | .38 | .34 | .63 | .41 | .38 | .74 | .63 |
| Proportion of searches in 3-back exclusion | .08 | .43 | .19 | .17 | .37 | .01 | .01 | .29 |
| β−1 common (s) | 0.342 | 0.060 | 0.452 | 0.452 | 0.060 | 0.342 | 0.173 | 0.342 |
| δ common (s) | 0.122 | 0.493 | 0.153 | 0.084 | 0.010 | 0.154 | 0.102 | 0.100 |
| Adjusted R2 | .964 | .861 | .928 | .833 | .868 | .887 | .807 | .854 |
Note. Avg = average. All other abbreviations are participants' initials.
The Appendix presents an analysis of the rejection of list lures from the 1-, 2-, and 4-back conditions of the exclusion task and the 4-back condition in the inclusion task. This analysis provides independent evidence that the n-back task is partly mediated by a search process of the form embodied in the mixture model.
The average proportion of searches in 3-back (exclusion) in Experiment 1 was .27, which is substantially higher than the .08 for 3-back exclusion in this experiment. Inspection of individual subject parameter estimates in Table 4 show that the low average value in this experiment was due to exceptionally high performance of 2 participants in 3-back exclusion (E.L. and K.S., with asymptotic d′ values of 4.21 and 4.52, respectively). Comparison of the performance of these participants with that of the other 5 clearly illustrates that there are substantial individual differences in the ability to maintain an item in focal attention while concurrently processing new information. Nevertheless, participants E.L. and K.S. showed a substantial proportion of search trials in 2- and 3-back inclusion (estimates range from .24 to .74). Although these individuals may have been better able than others to maintain one target in focal attention, they do not appear to have been more efficient at maintaining more than one item in focal attention.
Finally, it should be noted that the model estimates of the proportion of trials mediated by a match process does not exclusively reflect the proportion of trials that the target was maintained in focal attention. It is possible that the 500-ms interval between the onset of the mask and the onset of the test item was used to retrieve and restore the n-back target to focal attention when it had been displaced by intervening items. (The mask was necessary to ensure that 1-back conditions were not mediated by a visual matching process.) Such a strategy may be more effective for the exclusion task than the inclusion task, but even in the latter case there is a 1 in 3 chance of selecting the correct target. It is questionable whether the interval was sufficient to enable such a strategy, particularly when the onset of the mask was unpredictable. However, to the degree that it was, the proportion of matches will have overestimated the proportion of trials that the target was successfully maintained in focal attention and, likewise, underestimated the proportion of trials in which a search was needed to restore the target to focal attention.
General Discussion
Empirical Summary
Two important findings were reported. First, the speed (SAT rate) of retrieval decreased as n increased in both variants of the n-back task. The slowing of retrieval indicates that the n-back target could not be maintained consistently in focal attention, and that a search process was needed to recover the target when it was displaced from focal attention. The inability to perfectly maintain the n-back target in focal attention was independently supported by findings that asymptotic accuracy systematically decreased as n increased. The Appendix provides additional support for a search process, demonstrating that the time at which a nontarget list member was rejected depended on the ordinal position of either the target or the lure.
Second, retrieval speed was significantly faster in the 3-back exclusion task than in the 3-back inclusion task. The dynamics advantage for the exclusion task implicates the role of limited-capacity control processes that circumvented the need for a search process by maintaining a target item within the focus of attention. It also suggests that three sequentially presented items cannot be reliably maintained in focal attention. Broader implications of both findings are discussed next.
Retrieving Order Information
N-back retrieval dynamics are similar to the dynamics for explicit judgments of recency (McElree & Dosher, 1993), and both contrast sharply with the dynamics for item recognition. Less recent items engender lower asymptotic performance levels in tasks that require either item or order information. However, retrieval speed for item information is not directly affected by recency (McElree, 1996, 1998; McElree & Dosher, 1989, Wickelgren et al., 1980) or by the number of items in the memory set (McElree & Dosher, 1989). These findings have motivated the contention that access to an item's representation in memory is mediated by a content-addressable mechanism (Dosher & McElree, 1992). For judgments that require order information, in contrast, retrieval speed systematically slows as recency decreases. Order information is not retrieved by a content-addressable operation but by a search process that is sensitive to the amount of information interpolated between study and test.
McElree and Dosher (1993) argued that the recovery of order information in a JOR task was mediated by a serial search operation that began with the most recent item in memory. Seriality was compelled by the large shifts in intercept that were observed when the relevant test probe was drawn from less recent positions. The dynamics differences in both Experiments 1 and 2 were expressed in rate rather than intercept. Rate differences can motivate a serial model but not to the exclusion of certain forms of limited-capacity parallel models, as do shifts in intercept (see McElree & Carrasco, 1999; McElree & Dosher, 1989, 1993)4. However, because the SAT intercept is determined by the first process to complete, shifts in intercept are not expected when a serial process is mixed with a fast matching process. The mixture model demonstrated that the impact of the serial process in such cases will be to engender progressively slower rates as more serial comparisons are needed (cf. Figure 4, top and bottom panels).
Given independent evidence for the role of attention (Experiment 2; see later discussion), the most parsimonious account of the two order tasks is that they are mediated by the same type of search mechanism. McElree and Dosher (1993) suggested that this mechanism could consist of a serial self-terminating scan that begins with the most recent representation and moves backward in time (Hacker, 1980; see also Sternberg, 1975). This type of model assumes that memory representations preserve (temporal or spatial) order information. Given an ordered set of representations, a scan can determine how a given item is temporally or spatially situated with respect to another item (JOR tasks) or a series of items (n-back tasks). Alternatively, the search process could consist of a serial-chaining operation that capitalizes on pairwise associative information (Lewandowsky & Murdock, 1989). A serial-chaining mechanism need not assume that temporal or spatial relations are directly coded in memory, rather only that associative relations are formed between adjacent items during encoding. Order information is reconstructed at retrieval by using the last item on the list as a cue to recover the next item on the list, the 2-back item as a cue to retrieve the 3-back item, and so on, until a match to the target item is found. Lewandowsky and Murdock (1989) argued that a chaining mechanism provides the most viable approach to order information in distributed memory models in which memory traces are not stored in discrete locations.
Either mechanism is compatible with the JOR and n-back data, and the gamma model (Equation 3) gives expression to the temporal dynamics of both. The common aspect of both approaches is that the recovery of order information requires a sequence of operations rather than a unitary operation. This fact has implications for how order information is coded in the n-back task and in memory more broadly defined (see McElree & Dosher, 1993). It speaks against approaches that propose that order information is derived from comparing time tags that are explicitly and ubiquitously coded with a memory trace (e.g., Yntema & Trask, 1963; Hasher & Zacks, 1984) or that order is derived from a comparison of mnemsic properties like trace strength (e.g., Hinrichs, 1970; Morton, 1968), trace fragility (Wickelgren, 1974), or attribute counts (Bower, 1972; Flexser & Bower, 1974). If such were the case, order information, like item information, would be derived by a direct assessment of the retrieved mnemsic property without the need for a sequence of operations. Differences in retrieval speed would not have emerged if, for example, the position of the item in the n-back tasks was explicitly coded and stored (e.g., third from the last, second from the last). The inclusion task provided particularly strong evidence against the notion that order information is recovered by a direct assessment of less explicit properties like trace strength, trace fragility, or attribute counts. In principle, the inclusion task could be performed by setting a criterion on the property that would differentiate items less than 4-back from those greater than 3-back. Again, however, such a model incorrectly predicts that retrieval dynamics would be invariant across recency (McElree & Dosher, 1993).
The similarity of the time course profiles for JOR and n-back suggests that a serial search process is a general mechanism for the recovery of order information. However, such a claim does not entail that a serial mechanism is always used for order information. Intuition suggests that salient events can be encoded with explicit time tags (e.g., birth dates of family members). As several investigators noted (e.g., Bower, 1972; Estes, 1985; McElree & Dosher, 1989; Wickelgren, 1972), the recovery of order information for specially coded events may be mediated by a direct retrieval of the associated time tags. Additionally, McElree and Dosher (1993) argued with supporting data that an assessment of properties such as trace strength, trace fragility, or attribute counts can be used as a quick heuristic for order information in circumstances in which speed rather than accuracy is at a premium. The Appendix documents that list lures in both experiments produced higher false-alarm rates than nonlist lures early in retrieval. This analysis, like the results reported in McElree and Dosher (1993), suggests that an assessment of strength (or related notions) can be used as a quick heuristic for order information when speed is at issue. A serial search operation appears to be the general means of recovering order information when accuracy is at a premium.
Finally, time course measures of the n-back task and other order tasks such as JOR (McElree & Dosher, 1993) place clear boundary conditions on the applicability of retrieval models such as Ratcliffs (1978) diffusion model. Ratcliff et al. (1999) argued that the diffusion model is a general-purpose decision mechanism that has had great success in modeling an impressive range of tasks, including, for example, simple and choice RT tasks, matching or same-different judgments, recognition tasks, categorization tasks, and decision making. However, the diffusion model assumes that memory representations are content addressable and accessed in parallel. As such, it is ill equipped to model tasks that involve a serial sequence of operations. The implication of the current work is that a complete account of processing dynamics will require alternative models (i.e., the gamma function used here) for cases in which performance is not mediated by content-addressable, parallel operations.
The Focus of Attention
Prior analyses of the dynamics of retrieval suggest that a few items can remain within the focus of attention, obviating the retrieval operations that are otherwise needed to restore passive representations to active processing. Two facets of the n-back data similarly motivate a distinction between attended and more passive memory representations. First, a pure search model gave an inadequate account of retrieval dynamics in Experiment 1. To fit the time course profiles adequately, it was necessary to assume that the functions partly comprised a fast matching process. The second, more direct evidence for the role of attention came from the contrast between the exclusion and inclusion tasks in Experiment 2. The logic of contrasting 3-back exclusion and inclusion tasks was that the former enables more attentional resources to be devoted to the 3-back item. Retrieval speed for judgments of a 3-back target was substantially faster in the exclusion than inclusion condition, indicating that attentional demands clearly affected the time course of processing. This retrieval advantage follows from an assumption that there is a higher probability of maintaining the 3-back item in attention with one rather than three potential targets. Parameter estimates from the mixture model (Table 4) supported that contention.
There are, of course, alternative interpretations of the differences in retrieval speed between n-back inclusion and exclusion tasks, but none appear to be fully consistent with the time course data from this and other studies. For example, it might be argued that maintaining three items (inclusion) compared with one item (exclusion) in focal attention taxes a limited-capacity decision process (cf. Murdock, 1971; Townsend & Ashby, 1983), such that the comparison process slows as additional (parallel) operations are performed. McElree and Dosher (1989) explored and rejected such models for item recognition. In the McElree (1998) study, in which three items forming one cohesive unit were maintained in focal attention, there were no differences in retrieval speed among the three items in focal attention. Crucially, retrieval speed was not slower for these items than what was found in the McElree and Dosher (1989) study, in which only the last item was maintained in focal attention (retrieval speed, δ + β−1, was 449 ms in McElree, 1998, vs. 458 ms [Exp. 1] and 482 ms [Exp. 2] in McElree and Dosher, 1989; as a point of comparison, here retrieval speed was 478 ms for 3-back exclusion vs. 850 ms for 3-back inclusion). These data are directly at odds with the core prediction of a limited-capacity decision process that processing speed slows as additional comparisons are performed. Note also that if three items were indeed maintained in focal attention, there is no principled account for why accuracy also decreased across the 1-, 2-, and 3-back targets in the inclusion task. To account for the observed asymptotic differences, one must assume that, as more items are interpolated between study and test, there is a greater likelihood of an item being displaced from focal attention and that there is a lower probability of recovering the correct item and order information from memory representations outside of focal attention.
Another possibility appeals to the notion of the distinctiveness of representations (Nairne, 1996): An item may be less distinctive when there are other items in focal attention, and distinctiveness affects the speed of access. Again, if this account were correct, one would have expected retrieval speed to be slower in the McElree (1998) study than in the experiments in McElree and Dosher (1989). More generally, if distinctiveness affects retrieval speed, then increasing set size in a classic Sternberg paradigm should slow retrieval. McElree and Dosher (1989) demonstrated that set size does not affect retrieval speed.
The most consistent account of the differences in dynamics for 3-back exclusion and inclusion is that individuals could not reliably maintain three items in the focus of attention. This account reinforces the conclusions from other studies that focal attention has a very limited capacity, perhaps being restricted to one item or semantically related unit (McElree, 1998). The n-back task arguably provides stronger evidence for the limited nature of focal attention than other time course studies. Tasks such as item recognition can be easily accomplished with an efficient direct-access process, so there may be little incentive for individuals to deploy more cognitively engaging operations to maintain more than the last item in focal attention. In the n-back task, in contrast, a strategy of maintaining more than one item in focal attention would ostensibly circumvent the more difficult process of recovering order information (see McElree & Dosher, 1993). It is reasonable to assume, therefore, that individuals would have attempted to maintain three items if they were capable of doing so.
Results from the n-back inclusion task indicate that the upper limit on the number of units that can be actively maintained in focal attention is less than three items. For example, the parameter estimates in Table 4 indicate that, in the 3-back inclusion task, participants had to search for either the 2-back or 3-back target on 86% of the trials. In fact, this estimate is conservative. It was assumed in the mixture model that individuals always maintained the 1-back item in focal attention. This assumption was necessary to estimate the time needed for a matching operation. However, if individuals were attempting but unable to maintain all three items in focal attention, an effective strategy would have been to cycle through the last three items. If the last item was not in focal attention every time it was tested, then the baseline estimate of the time to match an item to the contents of focal attention is inflated by those trials when additional time was needed to search for the 1-back target. The net effect of overestimating the time to match a test item to focal attention would be to underestimate the proportion of searches necessary to respond to a 2- or 3-back target. The data unequivocally indicate that three items could not be maintained in focal attention, but it is also possible that the time course differences between 3-back exclusion and inclusion are fully consistent with prior results suggesting that the limit on focal attention is one unit. Garavan (1998) also argued, based on RT patterns in a switching task, that only one object can be maintained in focal attention.
Implications for Functional and Neural Architectures
Recent brain imaging studies of the n-back have found significant activation of the dorsolateral prefrontal cortex (DLPFC; Brodmann's area 9/46), Broca's area (Brodmann's area 44), and the posterior parietal area (Brodmann's area 40; Awh et al., 1996; Cohen et al., 1994, 1997; Smith & Jonides, 1997, 1999). Smith and Jonides (1997, 1999) suggested that activation in the DLPFC and Broca's area are reflections of executive or control processes, with the latter specifically linked to rehearsal processes. Activation in the posterior parietal area is argued to reflect WM storage rather than control processes. The evidence for this claim is that activation in this region increases with more distant n-back targets.
However, the time course data show that n-back judgments are in part mediated by a search process, and that the complexity of the search depends on n. Activation in the posterior parietal region is as likely to reflect correlates of the search or reconstructive process as it is to reflect passive storage. The controls that are used with subtractive logic in the series of studies reported by Smith and Jonides (1997, 1999) do not provide a means of disentangling retrieval and storage.5 Given the inability to localize storage unambiguously, an alternative strategy is to seek evidence for the involvement of the posterior parietal region in tasks that require storage but not a search operation. Item recognition is a likely candidate, because it involves a content-addressable retrieval operation that does not depend on recency. A PET study of the probe recognition task did find activation in the posterior parietal region (Awh et al., 1996). Unfortunately, however, the long retention interval (3 s) used in this study enabled individuals to rehearse the memory list (significant activation in Broca's region was also found). Although a search process may not have been used at test time, rehearsal during the retention interval is likely to have involved such an operation.
Different types of evidence have traditionally been used to motivate a temporary memory store associated with WM. These include, for example, differences in coding or presentation modality, effects of distractor tasks, recency effects, and purported clinical dissociations between the retention of information over short and long durations. However, much of this evidence is of questionable logic or has been complicated by additional research (for critical reviews see Crowder, 1993; Nairne, 1996; Wickelgren, 1973). Brain imaging data hold great potential for addressing issues of functional architecture, but the evidence to date does not appear to provide additional grounds on which to motivate a WM storage buffer.
The capacity of WM is often thought to be an important constraint on cognitive processing and to provide a basis on which to characterize differences among individuals and special populations. However, WM capacity need not reflect storage capacity. Indeed, theorizing on individual differences and age-related changes in cognition has appealed more to differences in control and automatic processes than to differences in storage capacity (e.g., Engle, 1996; Stoltzfus, Hasher, & Zacks, 1996). These approaches are largely consistent with a view of WM that eschews a limited-capacity storage assumption and instead emphasizes constraints on control processes with limited capacities. A simple dichotomy between attended and nonattended states is motivated by time course measures of accessibility. The current study suggests that this type of dichotomy also provides a sufficient account of a complex WM task that places substantial demands on the retention, retrieval, and manipulation of the representations of recent events.
Acknowledgments
This research was supported by National Institute of Mental Health Grant MH57458. I thank Lisbeth Dyer, Stephani Foraker, and Kinga Szprengiel for assistance with data collection and preparation of this article.
Appendix
Rejecting Lures
Experiment 1
Negative trials included list items from the n + 1 and n + 2 positions and nonlist (new) items. The former were used in the d′ scaling of the n-back time course functions to construct functions that reflected the ability to discriminate an item in a target position from items in other list positions. Nonlist lures, in contrast, can be rejected on the basis of an overall assessment of familiarity rather than the retrieval of positional information. Assuming that individuals do reject nonlist lures on the basis of a low familiarity value on a proportion of trials, an examination of the differences between list and nonlist lures can provide convergent evidence for how positional information is recovered.
Table A1 presents the mean proportion (and standard error) of false alarms for nonlist lures and the average of n + 1 and n + 2 lures. Differences among the false-alarm rates were initially analyzed with a repeated measures ANOVA on the proportion of false alarms using n-back condition (1-back, 2-back, and 3-back), lure type (list or nonlist lure), and lag of the interruption cue (seven lag times) as fixed factors. Overall, the proportion of false alarms increased with n (.03 for 1-back, .06 for 2-back, and .11 for 3-back), and this resulted in a significant main effect of condition, F(2, 10) = 10.67, MSE = 0.0010. Additionally, list lures engendered higher false-alarm rates than nonlist lures (0.092 vs. 0.043), which resulted in a significant main effect of lure type, F(1, 5) = 18.24, MSE = 0.0081. However, both main effects were qualified by a significant two-way interaction, F(1, 5) = 8.65, MSE = 0.0039, reflecting the fact that the differences in false-alarm rates between list and nonlist lures increased with n (.01, .05, and .09 for 1-, 2-, and 3-back conditions, respectively).
Crucially, however, the false-alarm rate also varied across response lag. There was a significant main effect of lag, F(4, 30) = 24.25, MSE = 0.0024, and a significant interaction between lag and type of lure, F(6, 30) = 2.51, MSE = 0.0014. The main effect of lag reflects the fact that false alarms decreased with additional retrieval time. The interaction of lure type and lag is complex but also informative. Inspection of Table A1 shows that false-alarm rates for both conditions monotonically decreased across lag; however, the differences across lag in false-alarm rate for the two types of lures is nonmonotonic. The pattern can be highlighted by a type of d′ scaling, here referred to as scaling, in which the z score for the false-alarm rate for list lures is scaled against the false-alarm rate for the nonlist lures (Dosher, McElree, Hood, & Rosedale, 1989; McElree, Dolan, & Jacoby, 1999; McElree & Dosher, 1989). With this scaling, a denotes poorer performance as a result of a higher false-alarm rate for list lures, a denotes lower false-alarm rates for list lures, and a denotes equal false-alarm rates.
Figure A1 shows the scaling for the average data. Inspection of the observed values shows that they all tend to be greater than 0, consistent with the ANOVA showing a significantly higher false-alarm rate for list lures. The interaction of lag and lure type results from the nonmonotonic form of these functions. The functions reach a peak false-alarm rate at times under 1 s and then diminish with further retrieval time. If list and nonlist lures simply differed by a single factor, like overall familiarity, then values would monotonically rise to the asymptotic difference in familiarity. The pattern here suggests that responses early in retrieval were based in part on an assessment of familiarity, which resulted in higher false-alarm rates for the more familiar list lures, but that additional information was retrieved with further retrieval time that served to differentially attenuate false alarms based on high familiarity values. Crucially, the time at which the functions decrease coincides with the rise portions of the standard d′ functions (cf. Figure 3) and appears to systematically shift to longer times as n increases by an amount comparable to the rate differences observed in the fits of the standard d′ functions. This suggests that the attenuation of the high false-alarm rates for list lures was also mediated by the recovery of order information. A plausible assumption is that additional retrieval time enabled participants to search backward in the list to recover either the (correct) n-back item or the ordinal position of the lure in the list. In either case, the information recovered by the search provides a basis on which to attenuate the higher false-alarm rate for the list lures.
Table A1.
False-Alarm Rate for Lures in Experiment 1
| Lag of response cue (ms) |
||||||||
|---|---|---|---|---|---|---|---|---|
| N-back | Lure | 43 | 200 | 300 | 500 | 800 | 1,500 | 3,000 |
| 1-back | n + 1 or 2 | 0.106 ± 0.032 | 0.045 ± 0.022 | 0.079 ± 0.035 | 0.018 ± 0.012 | 0.013 ± 0.013 | 0.000 ± 0.000 | 0.013 ± 0.012 |
| New | 0.108 ± 0.041 | 0.041 ± 0.023 | 0.023 ± 0.011 | 0.000 ± 0.000 | 0.018 ± 0.012 | 0.006 ± 0.006 | 0.012 ± 0.007 | |
| 2-back | n + 1 or 2 | 0.186 ± 0.029 | 0.101 ± 0.032 | 0.098 ± 0.027 | 0.052 ± 0.020 | 0.087 ± 0.045 | 0.039 ± 0.011 | 0.034 ± 0.021 |
| New | 0.156 ± 0.027 | 0.045 ± 0.033 | 0.022 ± 0.021 | 0.017 ± 0.007 | 0.018 ± 0.012 | 0.012 ± 0.011 | 0.011 ± 0.007 | |
| 3-back | n + 1 or 2 | 0.225 ± 0.027 | 0.189 ± 0.047 | 0.162 ± 0.041 | 0.159 ± 0.045 | 0.093 ± 0.040 | 0.132 ± 0.039 | 0.093 ± 0.038 |
| New | 0.117 ± 0.041 | 0.084 ± 0.039 | 0.046 ± 0.033 | 0.039 ± 0.027 | 0.044 ± 0.030 | 0.032 ± 0.025 | 0.059 ± 0.027 | |
Note. Values represent average ± standard error.
Figure A1.
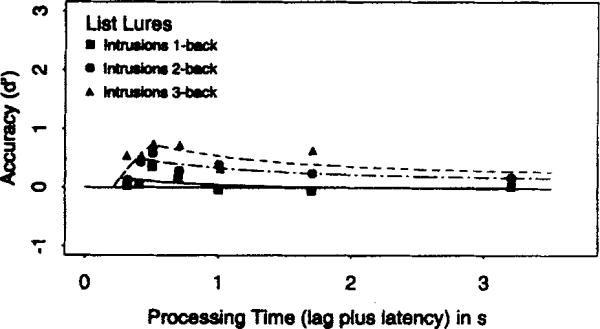
Average scaling of the false-alarm rates for 1-back, 2-back, and 3-back list lures as a function of processing time (lag of the response cue plus latency to respond to the cue) in Experiment 1. Smooth curves show the best fits of the dual-process model (Equation A1).
If a search process was used to reject list lures, then the point in time at which information from the search becomes available should differ as a function of the n-back condition. A dual-process retrieval model can be used to examine whether the false-alarm rates observed here are consistent with this contention. Ratcliff (1980) derived a two-process SAT model from the diffusion (random walk) model (see Dosher et al., 1989, for an application to a priming paradigm), and in McElree & Dosher (1989) this approach was adapted to the exponential form:
| (A1) |
Equation A1 states that during an initial time slice (δ1 < t < δ2) response accuracy is controlled by the accrual of one type of information. Here it is assumed that early in retrieval, before search information was available, the accrual of familiarity information was the primary basis for responding. Accuracy during this period can be modeled by the top equation, viz., by a simple exponential approach to the asymptote λ1, where λ1 represents the evidence derived from an assessment of the lure's familiarity. At time δ2, the products of a search process begin to accrue, because either the n-back target or the position of the lure has been found. The net effect is to shift response accuracy from the asymptote λ1, operative during the first period (δ1 < t < δ2) to a new asymptote λ2. The λ2 parameter reflects the evidence that is derived from the search, which is used to counter the high familiarity values (λ1). The second part of Equation A1 estimates this new asymptote and when the shift in processing begins (δ2).
To test this hypothesis, the three functions were fit with a common λ1, δ1, and β parameter, but with separate δ2 and λ2 parameters. Allowing the (λ2) parameter to vary with n-back instantiates the notion that the probability of a successful search varies with the recency. Allowing δ2 to vary tests whether search time also varies with n, as is observed in the fits of the standard d′ functions.1
The smooth functions in Figure A1 show fits of this dual-process model to the average functions. The estimate of familiarity, λ1, was 1.43 d′ units in the average data and ranged from 0.81 to 1.38 across subjects. The average λ2 parameters, representing the corrective influence hypothesized to arise from the search process, were estimated at 1.47, 1.33, and 1.28 d′ units for 1-, 2-, and 3-back conditions, respectively. Although the average parameters were ordered in the expected direction, viz., information derived from a search was less likely to be recovered the further back the subject was required to search, the differences across subjects were not reliable, F(2, 10) < 1. Crucially, the estimates of when search information began to be available, δ2, also varied with n in the anticipated direction. The average δ2 estimates were 265, 390, and 527 ms for 1-, 2-, and 3-back conditions, respectively. This ordering was reliable across subjects, F(2, 10) = 5.081, MSE = 0.0438.
Error data are inherently less stable than are the standard d′ functions, being based on a much smaller sample. Given this fact, it is not unexpected for a trend such as that seen in the λ2 parameters to be nonsignificant. What is notable about these error data is the significant differences in the δ2 estimates. As with the dynamics differences seen in the fits of the standard d′ functions, the longer δ2 estimates for less recent list lures implicate a recency-based (backward) search. Indeed, the two estimates of search time are remarkably close. The average differences in the rate estimates of the standard d′ functions were 231, 344, and 581 in (β−1) ms units for 1-, 2-, and 3-back conditions. The comparable δ2 estimates in the error data were 265, 390, and 527 ms.
Experiment 2
Table A2 lists the average false alarms for the 1-back, 2-back, 4-back, and new (nonlist) lures in the exclusion task. An ANOVA on the error rates yielded a significant effect of lure type, F(3, 18) = 3.76, MSE = 0.0468. The average proportion of false alarms were .058 for 1-back, .163 for 2-back, .127 for 4-back, and .033 for new lures. There was a main effect of lag, F(6, 36) = 8.68, MSE = 0.0041, and a significant interaction of lag and lure type, F(18, 108) = 2.77, MSE = 0.0027. As with Experiment 1, false alarms decreased with lag, but the differences between conditions were not proportional across lag.
A scaling was again used to highlight time course differences. The false-alarm rates for 1-back, 2-back, and 4-back lures were scaled against the false-alarm rate for new lures. Figure A2 shows the scaling for the average data. As with Experiment 1, observed values tend to be greater than 0 early in retrieval. All functions display clear nonmonotonicity, with a higher false-alarm rate for times less than 1 s compared with those later in retrieval. To quantify these differences, the dual-process model (Equation A1) was fit to the average data and the individual participant's data. As before, the functions were fit with a common λ1, parameter, reflecting the strength of evidence derived from the familiarity of the test probe, and common dynamics parameters, δ1, and β, reflecting the accrual of familiarity information. Each of the functions was fit with a separate λ2, reflecting the amount of evidence derived from the search process, and a separate δ2, measuring the point in time at which search information began to accrue.
The smooth functions in Figure A2 show fits to the average data. The average λ2 estimates were 2.13 for 1-back, 2.02 for 2-back, and 1.70 for 4-back. This pattern is what is expected if the probability of finding the position of the lure in the list varies with recency. However, the differences were not reliable across subjects. The time at which search information became available, δ2, was estimated at 346 ms for 1-back and 471 ms in 2-back. All but 1 participant (D.A.) showed this ordering, and a t test on the δ2 estimates was significant, t(6) = 2.53, p < .04. For 4-back lures, δ2 was estimated at 455 ms, which is earlier than 2-back but later than 1-back. However, these differences were not reliable. The δ2 difference between 1-back and 2-back is suggestive of a search process: If, to reject a lure, a search process was used to determine the ordinal position of the lure, then one would expect δ2 for 2-back to be earlier than that for 3-back. However, a simple search-to-reject notion is not consistent with the shorter δ2 for 4-back than for 2-back, despite the fact that this difference was nonsignificant.
Table A2.
False-Alarm Rate for Exclusion Lures in Experiment 2
| Lag of response cue (ms) |
|||||||
|---|---|---|---|---|---|---|---|
| N-back | 43 | 200 | 300 | 500 | 800 | 1,500 | 3,000 |
| 1-back | 0.109 ± 0.027 | 0.120 ± 0.044 | 0.076 ± 0.033 | 0.045 ± 0.026 | 0.015 ± 0.008 | 0.020 ± 0.008 | 0.025 ± 0.014 |
| 2-back | 0.226 ± 0.078 | 0.215 ± 0.086 | 0.234 ± 0.090 | 0.199 ± 0.089 | 0.119 ± 0.067 | 0.082 ± 0.058 | 0.063 ± 0.046 |
| 4-back | 0.149 ± 0.030 | 0.117 ± 0.031 | 0.151 ± 0.046 | 0.146 ± 0.069 | 0.139 ± 0.053 | 0.105 ± 0.046 | 0.078 ± 0.040 |
| New | 0.079 ± 0.027 | 0.034 ± 0.019 | 0.026 ± 0.015 | 0.024 ± 0.015 | 0.011 ± 0.011 | 0.029 ± 0.021 | 0.025 ± 0.019 |
Note. Values represent average ± standard error.
Figure A2.
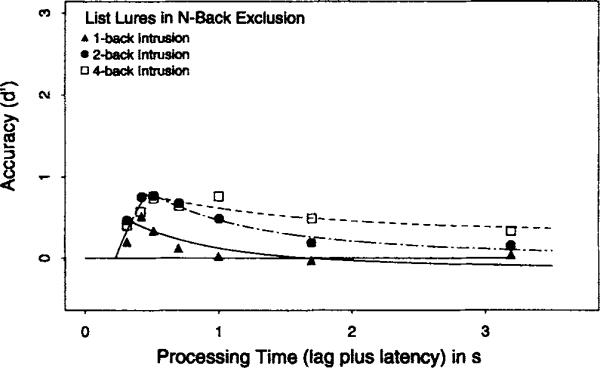
Average scaling of the false-alarm rates for 1-back exclusion, 2-back exclusion, and 4-back exclusion list lures as a function of processing time (lag of the response cue plus latency to respond to the cue) in Experiment 2. Smooth curves show the best fits of the dual-process model (Equation A1).
Caution is in order when drawing conclusions based on sparse error data; reliable differences between the δ2 for 2-back and 4-back may emerge with a larger sample of errors. However, the error rates for the 4-back lures in the exclusion task were not found to be statistically different from those for the 4-back lures in the inclusion task, F(1, 6) < 1, MSE = 0.022, nor did task interact with lag, F(6, 36) < 1, MSE = 0.031. The false-alarm rate in the 4-back exclusion condition constitutes an independent replication of the error patterns for 4-back inclusion, and this suggests that the latter may be a representative sample. Although speculative, the faster correction time for 4-back targets may have resulted from explicitly marking the item as a distractor once three subsequent items were presented. If the item was recoded as a distractor, then direct retrieval of that information may have circumvented the need for a search process on some unknown proportion of trials. Alternatively, δ2 times may have been influenced by the proximity of the n-back target.
Footnotes
Specialized retrieval models predict that one or the other of these variables will affect retrieval dynamics: Set size is predicted to control retrieval speed in serial or parallel retrieval models that assume exhaustive processing of the memory set (e.g., Ratcliff, 1978; Sternberg, 1966, 1975; Treisman & Doctor, 1987), whereas recency (serial position) is predicted to control retrieval speed in serial models that assume a self-terminating decision rule (Theios, 1973) or in parallel models that assume recency-based differences in processing rate (Murdock, 1971; Townsend & Ashby, 1983; for details, see McElree & Dosher, 1989).
This argument was buttressed by convergent evidence from an analysis of RT distributions. In an RT variant of the JOR task, the leading edge of the RT distributions shifted toward longer times with less recent test probes (Hacker, 1980; Hockley, 1984; McElree & Dosher, 1993; Muter, 1979). Shifts in the leading edge provide strong support for a serial (self-terminating) process (Steinberg, 1973). Additionally, Hacker (1980) and Muter (1979) showed that the same pattern is evident in sub- and supraspan lists, suggesting that the serial search process is not particular to WM.
Subject ML was marginally better fit by a 3λ-1β-3δ as compared to a 3λ-3β-1δ model (adjusted-R2 of .928 vs. .924), but both fits were better than the 3λ-1β-1δ model (.833).
Differing numbers of serial operations will engender SAT functions that differ in intercept (δ) or rate (β), because the number of serial processes determines the distribution of finishing times. The absence of either a rate or intercept difference provides empirical grounds on which to reject a serial hypothesis in favor of a parallel hypothesis. Intercept differences, conversely, provide empirical grounds on which to reject a parallel hypothesis in favor of a serial hypothesis. In a parallel architecture, all operations are assumed to be initiated at the same time. Consequently, conditions with differing numbers of parallel operations must, by definition, be associated with a common intercept (δ). Rate differences in the absence of intercept differences do not partition possible architectures strictly along a serial-parallel dimension but rather limit the class of architectures within both sets. Whether a serial process engenders rate as opposed to intercept depends on model-specific assumptions, including the mean and variance of the serial processes and whether the ordering of processes is deterministic or stochastic. McElree (1993), for example, found that a serial process produced rate but not intercept differences in a simulation that imposed a stochastic rather than deterministic order on the serial stages. Although all processes are initiated at the same time in parallel architecture, processes may proceed at different rates, either because a stimulus factor controls the rate of processing (e.g., Murdock, 1971) or because there are internal resource limitations (e.g., Townsend & Ashby, 1983). Thus, differences in rate can be consistent with a restricted set of parallel models (for an application, see McElree & Carrasco, 1999).
Control tasks in the Cohen et al. (1997) study, and related positron emission tomography (PET) studies (see Smith & Jonides, 1999) consisted of a search task (searching for a predefined target) and a task that simply required individuals to rehearse the last item presented during the inter-stimulus interval. Crucially, neither task required the retrieval of order information.
It might be further assumed that λ1, also varies with n, because the familiarity of an item typically decreases with recency. However, allowing this parameter to vary did not improve the overall fit and reduced the overall adjusted-R2 value. There is simply not enough power in the error data to adequately test whether λ1 also varied across list lures.
References
- Anderson JR. The architecture of cognition. Harvard University Press; Cambridge, MA: 1983. [Google Scholar]
- Awh E, Jonides J, Smith EE, Schumacher EH, Koeppe RA, Katz S. Dissociation of storage and rehearsal in verbal working memory: Evidence from positron emission tomography. Psychological Science. 1996;7:25–31. [Google Scholar]
- Baddeley AD. Working memory. Oxford University Press; Oxford, England: 1986. [Google Scholar]
- Baddeley AD, Hitch G. Working memory. In: Bower GH, editor. The psychology of learning and motivation: Advances in research and theory. Vol. 8. Academic Press; New York: 1974. pp. 47–89. [Google Scholar]
- Bower GH. Stimulus sampling theory of encoding variability. In: Melton AW, Martin E, editors. Coding processes in human memory. Winston; New York: 1972. [Google Scholar]
- Chandler JP. Subroutine STEPIT finds local minimum of a smooth function of several parameters. Behavioral Science. 1969;14:81–82. [Google Scholar]
- Clark SE, Gronlund SD. Global matching models of recognition memory: How the models match the data. Psychonomic Bulletin & Review. 1996;3:37–60. doi: 10.3758/BF03210740. [DOI] [PubMed] [Google Scholar]
- Cohen JD, Forman SD, Braver TS, Casey BJ, Servan-Schreiber D, Noll D. Activation of the prefrontal cortex in a nonspatial working memory task with functional MRI. Human Brain Mapping. 1994;1:293–304. doi: 10.1002/hbm.460010407. [DOI] [PubMed] [Google Scholar]
- Cohen JD, Perlstein WM, Braver TS, Nystrom LE, Noll D, Jonides J, Smith EE. Temporal dynamics of brain activation during a working memory task. Nature. 1997;386:604–608. doi: 10.1038/386604a0. [DOI] [PubMed] [Google Scholar]
- Conway ARA, Engle RW. Working-memory capacity as long-term memory activation: An individual-differences approach. Journal of Experimental Psychology: General. 1994;123:354–373. [Google Scholar]
- Cowan N. Attention and memory: An integrated framework. Oxford University Press; Oxford, England: 1995. [Google Scholar]
- Cowan N. The magical number 4 in short-term memory: A reconsideration of mental storage capacity. Behavioral and Brain Sciences. doi: 10.1017/s0140525x01003922. in press. [DOI] [PubMed] [Google Scholar]
- Crowder RG. Short-term memory: Where do we stand. Memory and Cognition. 1993;21:142–145. doi: 10.3758/bf03202725. [DOI] [PubMed] [Google Scholar]
- Dobbs AR, Rule BG. Adult age differences in working memory. Psychology and Aging. 1989;4:500–503. doi: 10.1037//0882-7974.4.4.500. [DOI] [PubMed] [Google Scholar]
- Dosher BA. The retrieval of sentences from memory: A speed-accuracy study. Cognitive Psychology. 1976;8:291–310. [Google Scholar]
- Dosher BA. The effect of delay and interference: A speed-accuracy study. Cognitive Psychology. 1981;13:551–582. [Google Scholar]
- Dosher BA, Ma JJ. Output loss or rehearsal loop? Output-time versus pronunciation-time limits in immediate recall for forgetting-matched materials. Journal of Experimental Psychology: Learning, Memory, and Cognition. 1998;24:316–335. doi: 10.1037//0278-7393.24.2.316. [DOI] [PubMed] [Google Scholar]
- Dosher BA, McElree B. Memory search: Retrieval processes in short-term and long-term recognition. In: Squire Larry., editor. Encyclopedia of learning and memory. Macmillan; New York: 1992. pp. 398–406. [Google Scholar]
- Dosher BA, McElree B, Hood RM, Rosedale GR. Retrieval dynamics of priming in recognition memory: Bias and discrimination analysis. Journal of Experimental Psychology: Learning, Memory, and Cognition. 1989;15:868–886. [Google Scholar]
- Engle RW. Working memory and retrieval: An inhibition resource approach. In: Richardson J, Engle R, Hasher L, Logic R, Stoltzfus E, Zacks R, editors. Working memory and human cognition. Oxford University Press; Oxford, England: 1996. pp. 89–119. [Google Scholar]
- Ericsson KA, Pennington N. The structure of memory performance in experts: Implications for memory in everyday life. In: Davis GM, Logic RH, editors. Memory in everyday life. North Holland; Amsterdam: 1993. pp. 241–272. [Google Scholar]
- Estes WK. Memory for temporal information. In: Michon JA, Jackson JL, editors. Time, mind, and behavior. Springer-Verlag; Berlin: 1985. pp. 149–168. [Google Scholar]
- Flexser AJ, Bower GH. How frequency affects recency judgments: A model of recency discriminations. Journal of Experimental Psychology. 1974;103:706–716. doi: 10.1037/h0037194. [DOI] [PubMed] [Google Scholar]
- Garavan H. Serial attention within working memory. Memory & Cognition. 1998;26:263–276. doi: 10.3758/bf03201138. [DOI] [PubMed] [Google Scholar]
- Gillund G, Shiffrin RM. A retrieval model for both recognition and recall. Psychological Review. 1984;91:1–67. [PubMed] [Google Scholar]
- Gronlund SD, Edwards MB, Ohrt DD. Comparison of the retrieval of item versus spatial position information. Journal of Experimental Psychology: Learning, Memory, and Cognition. 1997;23:1261–1274. doi: 10.1037//0278-7393.23.5.1261. [DOI] [PubMed] [Google Scholar]
- Hacker MJ. Speed and accuracy of recency judgments for events in short-term memory. Journal of Experimental Psychology: Learning, Memory, and Cognition. 1980;6:651–675. [Google Scholar]
- Hasher L, Zacks RT. Automatic processing of fundamental information: The case of frequency of occurrence. American Psychologist. 1984;39:1372–1388. doi: 10.1037//0003-066x.39.12.1372. [DOI] [PubMed] [Google Scholar]
- Hinrichs JV. A two process memory-strength theory for judgments of recency. Psychological Review. 1970;77:223–233. [Google Scholar]
- Hintzmaan DL. Judgments of frequency and recognition memory in a multiple-trace memory model. Psychological Review. 1988;95:528–551. [Google Scholar]
- Hintzman DL, Caulton DA. Recognition memory and modality judgments: A comparison of retrieval dynamics. Journal of Memory and Language. 1997;37:1–23. [Google Scholar]
- Hintzman DL, Caulton DA, Levitin DJ. Retrieval dynamics in recognition and list discrimination: Further evidence for separate processes of familiarity and recall. Memory & Cognition. 1998;26:448–462. doi: 10.3758/bf03201155. [DOI] [PubMed] [Google Scholar]
- Hintzman DL, Curran T. Retrieval dynamics of recognition and frequency judgments: Evidence for separate processes of familiarity and recall. Journal of Memory and Language. 1994;33:1–18. [Google Scholar]
- Hockley WE. Analysis of response time distribution in the study of cognitive processes. Journal of Experimental Psychology: Learning, Memory, and Cognition. 1984;10:598–615. [Google Scholar]
- James W. The Principles of Psychology. Henry Holt; New York: 1890. [Google Scholar]
- Judd CM, McClelland GH. Data analysis: A model-comparison approach. Harcourt Brace Jovanovich; San Diego, CA: 1989. [Google Scholar]
- Lewandowsky S, Murdock BB., Jr. Memory for serial order. Psychological Review. 1989;96:25–53. [Google Scholar]
- Macmillan NA, Creelman CD. Detection theory: A user's guide. Cambridge University Press; New York: 1991. [Google Scholar]
- McBride DA, Dosher BA. A comparison of forgetting in an implicit and explicit memory task. Journal of Experimental Psychology: General. 1997;126:371–392. doi: 10.1037//0096-3445.126.4.371. [DOI] [PubMed] [Google Scholar]
- McBride DA, Dosher BA. Forgetting rates are comparable in conscious and automatic memory: A process-dissociation study. Journal of Experimental Psychology: Learning, Memory, and Cognition. 1999;25:583–607. [Google Scholar]
- McElree B. The locus of lexical preference effects in sentence comprehension: A time-course analysis. Journal of Memory and Language. 1993;32:536–571. [Google Scholar]
- McElree B. Accessing short-term memory with semantic and phonological information: A time-course analysis. Memory & Cognition. 1996;24:173–187. doi: 10.3758/bf03200879. [DOI] [PubMed] [Google Scholar]
- McElree B. Attended and non-attended states in working memory: Accessing categorized structures. Journal of Memory and Language. 1998;38:225–252. [Google Scholar]
- McElree B. Sentence comprehension is mediated by content-addressable memory structures. Journal of Psycholinguistic Research. 2000;29:111–123. doi: 10.1023/a:1005184709695. [DOI] [PubMed] [Google Scholar]
- McElree B, Carrasco M. The temporal dynamics of visual search: Speed-accuracy trade-off analysis of feature and conjunctive searches. Journal of Experimental Psychology: Human Perception and Performance. 1999;25:1517–1539. doi: 10.1037//0096-1523.25.6.1517. [DOI] [PMC free article] [PubMed] [Google Scholar]
- McElree B, Dolan PO, Jacoby LL. Isolating the contributions of familiarity and source information in item recognition: A time-course analysis. Journal of Experimental Psychology: Learning, Memory, and Cognition. 1999;25:563–582. doi: 10.1037//0278-7393.25.3.563. [DOI] [PMC free article] [PubMed] [Google Scholar]
- McElree B, Dosher BA. Serial position and set size in short-term memory: Time course of recognition. Journal of Experimental Psychology: General. 1989;118:346–373. [Google Scholar]
- McElree B, Dosher BA. Serial retrieval processes in the recovery of order information. Journal of Experimental Psychology: General. 1993;122:291–315. [Google Scholar]
- McElree B, Dosher BA. The focus of attention across space and across time. Behavioral and Brain Sciences. in press. [Google Scholar]
- McElree B, Griffith T. Syntactic and thematic processing in sentence comprehension: Evidence for a temporal dissociation. Journal of Experimental Psychology: Learning, Memory, and Cognition. 1995;21:134–157. [Google Scholar]
- McElree B, Griffith T. Structural and lexical constraints on filling gaps during sentence processing: A time-course analysis. Journal of Experimental Psychology: Learning, Memory, and Cognition. 1998;24:432–460. [Google Scholar]
- Morton J. Repeated items and decay in memory. Psychonomic Sciences. 1968;10:219–220. [Google Scholar]
- Murdock BB., Jr. A parallel-processing model for scanning. Perception and Psychophysics. 1971;10:289–291. [Google Scholar]
- Murdock BB., Jr. A theory for the storage and retrieval of item and associative information. Psychological Review. 1982;89:609–626. doi: 10.1037/0033-295x.100.2.183. [DOI] [PubMed] [Google Scholar]
- Murdock BB., Jr. TODAM2: A model for the storage and retrieval of item, associative, and serial-order information. Psychological Review. 1993;100:183–203. doi: 10.1037/0033-295x.100.2.183. [DOI] [PubMed] [Google Scholar]
- Muter PA. Response latencies in discriminations of recency. Journal of Experimental Psychology: Learning, Memory, and Cognition. 1979;5:160–169. [Google Scholar]
- Nairne JS. Short-term/working memory. In: Bjork EL, Bjork RA, editors. Memory. Academic Press; San Diego, CA: 1996. pp. 160–169. [Google Scholar]
- Posner MI, Boies SJ, Eichelman WH, Taylor RL. Retention of visual and name codes of single letters. Journal of Experimental Psychology Monographs. 1969;791(Pt. 2) doi: 10.1037/h0026947. [DOI] [PubMed] [Google Scholar]
- Ratcliff R. A theory of memory retrieval. Psychological Review. 1978;85:59–108. [Google Scholar]
- Ratcliff R. A note on modelling accumulation of information when the rate changes over time. Journal of Mathematical Psychology. 1980;21:178–184. [Google Scholar]
- Ratcliff R, Van Zandt, McKoon G. Connectionist and diffusion models of reaction time. Psychological Review. 1999;106:261–300. doi: 10.1037/0033-295x.106.2.261. [DOI] [PubMed] [Google Scholar]
- Reed AV. Speed-accuracy trade-off in recognition memory. Science. 1973;181:574–576. doi: 10.1126/science.181.4099.574. [DOI] [PubMed] [Google Scholar]
- Reed AV. The time course of recognition in human memory. Memory & Cognition. 1976;4:16–30. doi: 10.3758/BF03213250. [DOI] [PubMed] [Google Scholar]
- Rubin DC, Hinton S, Wenzel A. The precise time course of retention. Journal of Experimental Psychology: Learning, Memory, and Cognition. in press. [Google Scholar]
- Rubin DC, Wenzel AE. One hundred years of forgetting: A quantitative description of retention. Psychological Review. 1996;103:734–760. [Google Scholar]
- Schneider W, Detweiler M. The role of practice in dual-task performance: Toward workload modeling in a connectionist/control architecture. Human Factors. 1988;30:539–566. doi: 10.1177/001872088803000502. [DOI] [PubMed] [Google Scholar]
- See STK, Ryan BR. Cognitive mediation of adult age differences in language performance. Psychology and Aging. 1995;3:458–468. doi: 10.1037//0882-7974.10.3.458. [DOI] [PubMed] [Google Scholar]
- Shallice T, Vallar G. The impairment of auditory-verbal short-term storage. In: Vallar G, Shallice T, editors. Neuropsychological impairments of short-term memory. Cambridge University Press; New York: 1990. pp. 11–53. [Google Scholar]
- Smith EE, Jonides J. Working memory: A view from neuroimaging. Cognitive Psychology. 1997;33:5–42. doi: 10.1006/cogp.1997.0658. [DOI] [PubMed] [Google Scholar]
- Smith EE, Jonides J. Storage and executive processes in the frontal lobes. Science. 1999;283:1657–1661. doi: 10.1126/science.283.5408.1657. [DOI] [PubMed] [Google Scholar]
- Sternberg S. High speed scanning in human memory. Science. 1966;153:652–654. doi: 10.1126/science.153.3736.652. [DOI] [PubMed] [Google Scholar]
- Sternberg S. Evidence against self-terminating memory search from properties of the RT distribution; meeting of Psychonomic Society; St. Louis, MO. Nov, 1973. [Google Scholar]
- Sternberg S. Memory-scanning: New findings and current controversies. Quarterly Journal of Experimental Psychology. 1975;27:1–32. [Google Scholar]
- Stoltzfus ER, Hasher L, Zacks RT. Working memory and aging: The current status of the inhibitory view. In: Richardson J, Engle R, Hasher L, Logie R, Stoltzfus E, Zacks R, editors. Working memory and human cognition. Oxford University Press; Oxford, England: 1996. pp. 66–88. [Google Scholar]
- Theios J. Reaction time measurement in the study of memory processes: Theory and data. In: Bower GH, editor. The psychology of learning and motivation. Vol. 7. Academic Press; New York: 1973. pp. 44–85. [Google Scholar]
- Townsend JT, Ashby FG. The stochastic modeling of elementary psychological processes. Cambridge University Press; New York: 1983. [Google Scholar]
- Treisman M, Doctor E. Memory scanning: A comparison of the dynamic stack and exhaustive serial scan models with an extension of the latter. Ada Psychologica. 1987;64:39–92. [Google Scholar]
- Wickelgren W. Trace resistance and the decay of long-term memory. Journal of Mathematical Psychology. 1972;9:418–455. [Google Scholar]
- Wickelgren W. The long and the short of memory. Psychological Bulletin. 1973;80:425–438. [Google Scholar]
- Wickelgren W. Single-trace fragility theory of memory dynamics. Memory & Cognition. 1974;4:775–780. doi: 10.3758/BF03198154. [DOI] [PubMed] [Google Scholar]
- Wickelgren W. Speed-accuracy tradeoff and information processing dynamics. Acta Psychologica. 1977;41:67–85. [Google Scholar]
- Wickelgren WA, Corbett AT, Dosher BA. Priming and retrieval from short-term memory: A speed-accuracy tradeoff analysis. Journal of Verbal Learning and Verbal Behavior. 1980;19:387–404. [Google Scholar]
- Yntema DB, Trask FP. Recall as a search process. Journal of Verbal Learning and Verbal Behavior. 1963;2:65–74. [Google Scholar]