

Abstract
Introduction
Recent evidence indicates that spontaneous sarcoplasmic reticulum Ca release and Na-Ca exchanger current activation contribute to the sinoatrial node (SAN) automaticity. These findings suggest that SAN activity may share mechanisms that underlie both automaticity and triggered activity. The aim of this study is to test the hypothesis that spontaneous, non-voltage gated, intracellular Ca (Cai) elevation may induce delayed afterdepolarization (DAD) in intact SAN during isoproterenol infusion.
Methods and Results
We simultaneously mapped Cai and membrane potential in 31 isolated Langendorff-perfused canine right atriums (RA). Isoproterenol increased heart rate and late diastolic Cai elevation (LDCAE) of the superior SAN, leading to consistent SAN automaticity in all 31 RAs. However, DAD-like diastolic depolarizations (DD) were transiently observed in 4 RAs during isoproterenol infusion. These DAD-like DDs were preceded by LDCAE, but did not trigger a full action potential. The LDCAE preceding DAD-like DDs had smaller amplitude (0.41 ± 0.08 AU vs. 0.48 ± 0.07 AU, p=0.001) and less steep slopes (3.7 ± 1.3 AU/s vs. 4.8 ± 1.4 AU/s, p=0.001) than that of sinus beats. The coupling interval of DAD-like DDs was longer than that of the preceding normal beats (407 ± 48 ms vs. 371 ± 44 ms, p=0.002).
Conclusion
The isoproterenol-induced LDCAE of superior SAN induced a full action potential in most cases. However, if the LDCAE was too small to trigger an action potential, then it induces only DAD-like DD. The failure of DAD-like DD to consistently trigger a sinus beat is a novel mechanism of atrial arrhythmogenesis.
Keywords: calcium dynamics, sympathetic nervous system, triggered activity, sinoatrial node, afterdepolarization
Introduction
Automaticity and triggered activity are thought to be two distinct mechanisms for the initiation of heart beats. Automaticity occurs spontaneously and can be a source of both normal and abnormal heart beats, while triggered activity is pacing-induced and is almost always pathological. A mechanism of triggered activity is spontaneous (non-voltage gated) sarcoplasmic reticulum (SR) Ca release, which causes Na-Ca exchanger current (INCX) activation and membrane depolarization, resulting in delayed afterdepolarization (DAD).1 When DAD reaches threshold, it initiates triggered activity and arrhythmia (reverse excitation-contraction coupling).2–3 Recent studies, however, showed that rhythmic spontaneous Ca release (“Ca clock”) 4–6 may work together with hyperpolarization-activated membrane currents (“membrane clock”) to generate normal sinus rhythm, a prototypical example of normal automaticity. These findings suggest that sinoatrial node (SAN) activity may share mechanisms that underlie both automaticity and triggered activity, i.e., INCX activation.1, 7–13 Consistent with this hypothesis, Bogdanov et al 12 showed that in single isolated SAN cells, spontaneous SR Ca release in conditions of impaired INCX may result in membrane potential (Vm) oscillation without leading to regenerative action potential. Maltsev and Lakatta 5 used computer models to study the mutual dependence of the Ca clock and the membrane clock. The authors demonstrated that when membrane current (such as L-type Ca current, ICa,L) is inhibited, the SAN may demonstrate DADs rather than an action potential. Similarly, intracellular calcium (Cai) waves 14 may trigger Vm oscillations in ventricular tissues of intact hearts during isoproterenol infusion, suggesting that insufficient amount of SR Ca release may cause DADs but not full action potential in intact tissues. However, whether or not DADs can occur in the intact SAN remains unknown. It is also unclear if the DADs in the SAN can lead to atrial arrhythmia. The purpose of the present study was to test the hypothesis that the spontaneous intracellular Ca (Cai) elevation may induce DAD-like activity in intact SAN during isoproterenol infusion, and that failure of the DAD-like activity to trigger sinus beats is a mechanism of atrial arrhythmia.
Methods
Dual Vm and Cai recordings in Langendorff-perfused Canine right atrium preparations
This study protocol was approved by the Institutional Animal Care and Use Committee and conforms to the guidelines of the American Heart Association. We studied isolated canine right atriums (RA) in 31 mongrel dogs (22 to 28 kg). Among them, 11 were from a previous study,15 20 were from subsequently (unpublished) studies. The dogs were intubated and anesthetized with isoflurane. The chest was opened via median sternotomy and the heart was rapidly excised. The dogs were euthanized by exsanguination during general anesthesia. The right coronary artery was perfused with 37°C Tyrode’s solution equilibrated with 95% O2 and 5% CO2 to maintain a pH of 7.4. The composition of Tyrode’s solution was (in mmol/L): 125 NaCl, 4.5 KCl, 0.25 MgCl2, 24 NaHCO3, 1.8 NaH2PO4, 1.8 CaCl2, and 5.5 glucose). The perfusion pressure was between 50 mmHg and 60 mmHg. All ventricular coronary branches were tied off. Both ventricles and the left atrium were excised and removed from the preparation. During optical recordings, contractility was inhibited by 10–17 μmol/L of blebbistatin.15
Dual Vm and Cai recordings
We used 0.5 mg of Rhod-2 AM (Molecular Probes) dissolved in 1 mL of dimethylsulfoxide containing Pluronic F-127 (20%wt/vol) to stain Cai. This solution was diluted in 300 ml of Tyrode’s solution to achieve a final Rhod-2 concentration of 1.48 μmol/L and was infused into the heart over a 10-minute period. The heart was perfused with dye-free Tyrode’s solution for 15–30 minutes for de-esterification of Rhod-2 AM. The hearts were then stained again by direct injection of voltage sensitive dye (RH237, Molecular Probes) into the perfusion system. The double-stained hearts were excited with laser light at 532 nm.15 Fluorescence was collected using 2 cameras (MiCAM Ultima, BrainVision, Tokyo, Japan) at 1 ms/frame and 100 X 100 pixels with spatial resolution of 0.35 × 0.35 mm2/pixel. The fluorescence was obtained through a common lens, separated with a dichroic mirror (650 nm cutoff wavelength), and directed to the respective camera with additional filtering (715 nm long pass for Vm and 580 ± 20 nm for Cai). The sources of optical signals came from both the surface and up to 1–2 mm below the surface.16 After dual Vm and Cai optical mapping of baseline spontaneous beats, isoproterenol was infused starting from 0.01 μmol/L and gradually increased to 1.0 μmol/L.
Data Analysis
Isoproterenol infusion increased heart rate and induced the Cai elevation at superior SAN during late diastolic period (arrow in Figure 1A).15 This Cai elevation was defined as the late diastolic Cai elevation (LDCAE). The LDCAE induced diastolic depolarization (DD) and generated a sinus beat. However, when an LDCAE induced DD but failed to generate a sinus beat, the down slope of the DD became visible and showed same morphology as the DAD in other sites of heart. Therefore, we defined these DDs as the “subthreshold DADs” or “DAD-like activities”.
Figure 1. The intermittent pattern of subthreshold DADs.
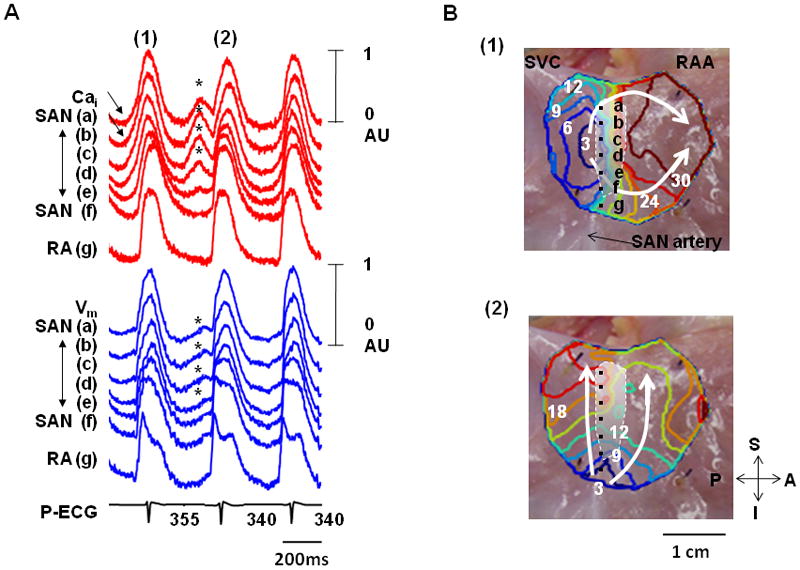
These tracings were obtained during isoproterenol infusion (0.03 μmol/L) in the first RA preparation. A, Optical signals of Cai (red) and Vm (blue) from superior (a, b), middle (c, d), and inferior (e, f) SAN, and RA (g). There were 3 consecutive activations in this figure. Among them, the first (1) and third beats show LDCAE (arrows) followed by the initiation of sinus beats from the same sites. In contrast, the second beat (2) showed both LDCAE on Cai tracings and subthreshold DADs on Vm tracings (asterisks). The down slope of the subthreshold DADs were observed because they failed to trigger an action potential. B, Vm isochronal maps of the first (1) and second (2) beats. The white shaded area is the SAN. The first beat (1) was from SAN. Because subsequent LDCAE in the SAN (asterisks in Panel A) failed to trigger a sinus beat, an ectopic pacemaker was able to take over and activate the mapped region (2). RAA, right atrial appendage; SVC, superior vena cava; A, anterior; P, posterior; S, superior; I, inferior.
The Cai and Vm traces were normalized to their respective peak-to-peak amplitude for comparison of timing and morphology. Considering the total amplitude of Cai and Vm tracings as 1 arbitrary unit (AU), the maximum amplitudes of LDCAE (b of Figure 2) and DD (d of Figure 2) were measured from baseline to the peak level of LDCAE and DD, respectively. The slopes of LDCAE (a of Figure 2) and DD (c of Figure 2) were measured from the onsets of LDCAE or DD to peak levels of LDCAE or DD, respectively. The onsets of LDCAE and DD were defined by the time of the transition between negative to positive values in dCai/dt and dVm/dt curves.15 We generated activation isochronal maps using the onset of phase 0 of the action potential in the leading pacemaker site as time 0. The time of the isochronal map is time when the Vm reached 50% of the maximum amplitude of phase 0. We compared the slopes and maximum amplitude of LDCAE and DD between subthreshold DADs (n=30) and adjacent sinus beats (n=32) with Student’s t tests. Data were presented as mean ± SD. A p value of < 0.05 was considered significant.
Figure 2. The methods of measurement.
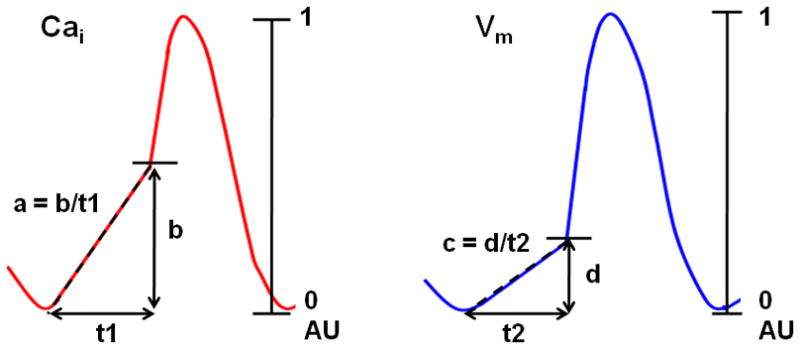
Schematic explanation of how the slope of LDCAE (a) and DD (c), and the maximum amplitudes of LDCAE (b) and DD (d) were measured. The largest magnitude of Cai and Vm changes was used as 1 arbitrary unit (AU). The slopes of segments a and c were calculated by b/t1 and d/t2, respectively. The unit of the slope was AU/s. In this and subsequent figures, red lines indicate Cai tracings, while blue lines were used for Vm tracings.
Results
At baseline, the LDCAE was observed at the inferior SAN in only 4 (13%) RA preparations. However, a robust LDCAE occurred at the leading pacemaker site of superior SAN in all RA preparations during isoproterenol infusion.15 Among 31 preparations studied, 37 episodes of subthreshold DADs were observed in 4 RA preparations during increasing doses of Isoproterenol. The following analyses are limited to the data from these 4 RAs. The remaining 27 RAs are not included in the statistical analyses.
Intermittent Subthreshold DAD
Three RAs had a total of 20 episodes of subthreshold DADs that occurred intermittently. Figure 1 shows optical maps of intermittent subthreshold DADs during 0.03 μmol/L isoproterenol infusion. The first beat (1) shows LDCAE (arrows in Cai tracings of Figure 1A) followed by the initiation of sinus beats from the same sites (sites b and c of Figure 1B(1) and Movie I), compatible with LDCAE-induced SAN activation. In comparison, LDCAE (asterisks) before the second beat (Figure 1A(2)) was associated with gradual rise and fall of the Vm but not a full action potential. These Vm changes (asterisks) were consistent with subthreshold DAD induced by LDCAE. A latent pacemaker in the inferior RA then generated the second beat, as shown by the isochronal map (Figure 1B(2) and Movie II). Note that the PP interval between beats (1) and (2) was 355 ms, while the baseline intervals were 340 ms. Because there were irregular cycle lengths and competing pacemaking sites, Figure 1A demonstrates atrial arrhythmias induced by failure of DAD to reach threshold in the SAN. After further increase of isoproterenol dosage to 0.1 μmol/L or more, the superior SAN became a consistent leading pacemaker site. The DAD-like activity and atrial arrhythmia were no longer observed.
Alternans Between Subthreshold DAD and Sinus Beat
One RA had 17 episodes of alternating subthreshold DAD. All episodes showed alternans of cycle length and the origin of activation. Figure 3 shows a typical example. The pseudo ECG shows PP intervals alternating between 415 ms and 455 ms. During the shorter PP intervals, LDCAE was observed at superior SAN (arrows in Figure 3A) and successfully induced action potentials from that site. The isochronal maps in Figure 3B(1) confirmed that the origin of activation was the superior SAN. However, during longer PP intervals, the subthreshold DAD of SAN (asterisks in Figure 3A) failed to trigger a sinus beat. The isochronal map in Figure 3B(2) shows that the activation started from the inferior SAN.
Figure 3. The alternans pattern of Cai release and the development of cardiac arrhythmia.
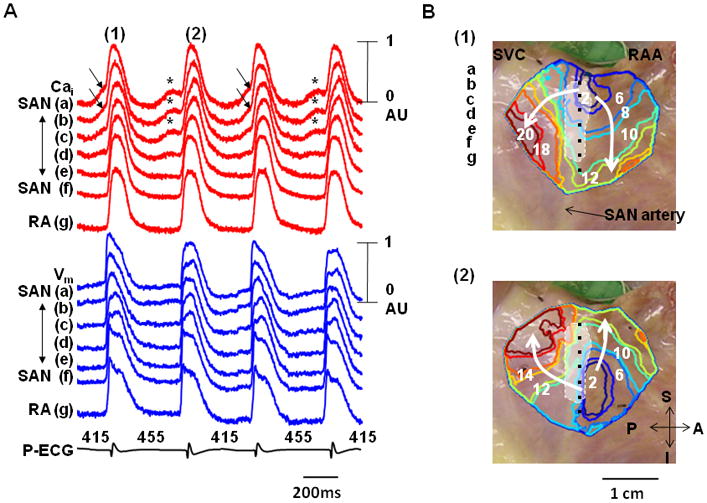
These data were obtained during isoproterenol infusion (0.3 μmol/L) in the second RA. A, Cai (red) and Vm (blue) tracings from superior (a, b), middle (c, d), and inferior (e, f) SAN, and RA (g). Arrows point to LDCAE that induced sinus beats from SAN. Asterisks indicate LDCAE that did not result in a sinus beat. B, Vm isochronal maps. The first beat (1) originated from SAN while the second beat (2) originated from an ectopic pacemaker. The white shaded area is the SAN. These two activation patterns alternated with each others, resulting in a cycle length alternans in Panel A.
Subthreshold DADs Causing Atrial Arrhythmia
Figure 4 shows additional examples of subthreshold DADs causing atrial arrhythmia. Figure 4A shows intermittent pattern of subthreshold DAD (asterisks) recorded from the first RA, while figure 4B shows alternans between subthreshold DADs and sinus beats recorded from a second RA. In all 37 different episodes, cycle length prolongation (mean ± SD, 37 ± 25 ms) occurred because these subthreshold DADs failed to trigger sinus beats. The coupling interval of subthreshold DAD was longer than the preceding normal beats (407 ± 48 ms vs. 371 ± 44 ms, p=0.002). A latent pacemaker from outside of the mapped region or inferior RA then antidromically activated the SAN. In some episodes (arrows in Figure 4B), the Cai elevation was associated with small or no Vm changes. Figure 4C shows that subthreshold DAD (#) and arrhythmia were recorded only with an intermediate dose of isoproterenol (0.03 μmol/L). Higher and lower doses of isoproterenol resulted in normal sinus rhythm, with the superior SAN as the leading pacemaker site. This is the case for all RAs studied.
Figure 4. Additional examples of the subthreshold DADs.
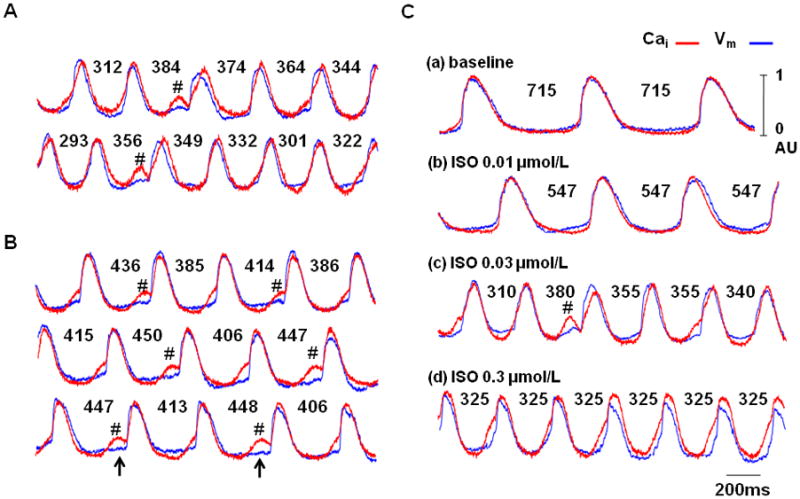
Cai (red) and Vm (blue) tracings of superior SAN during isoproterenol infusion from the first (A) and second RA preparation (B). Note that there were intermittent lengthening of the activation cycle lengths. The presence of LDCAEs and subthreshold DADs (asterisks) were coincidental with the prolongation of the cycle lengths. Upward arrows indicate that occasionally, large LDCAEs were not associated with changes of Vm. C shows the effects of isoproterenol dosage on the occurrence of the subthreshold DADs (asterisks). The subthreshold DADs only occurred with intermediate dose (0.03 μmol/L) of isoproterenol. Higher and lower doses did not induce LDCAE or subthreshold DADs. The numbers are cycle lengths in ms.
Amplitudes and Slopes of Subthreshold DADs
In all 37 episodes of subthreshold DADs, the slopes of DD preceding sinus beats were significantly higher than those of subthreshold DADs (1.7 ± 0.7 AU/s, vs. 1.3 ± 0.6 AU/s, p=0.02, Figure 5A). The slopes of LDCAE preceding sinus beats were also significantly higher than that of subthreshold DADs (4.8 ± 1.4 vs. 3.7 ± 1.3 AU/s, p=0.001, Figure 5B). The maximum amplitude of DD preceding sinus beats was significantly higher than that of subthreshold DADs (0.23 ± 0.04 AU vs. 0.20 ± 0.05 AU, p=0.002, Figure 5C). The maximum amplitude of LDCAE preceding sinus beats was significantly higher than that of subthreshold DADs (0.48 ± 0.07 AU vs. 0.41 ± 0.08 AU, p=0.001, Figure 5D). These findings suggest that insufficient magnitudes of LDCAE and DD were associated with the failure of subthreshold DAD to trigger a full action potential.
Figure 5. The comparisons between subthreshold DADs (n=37) and sinus beats (n=37).
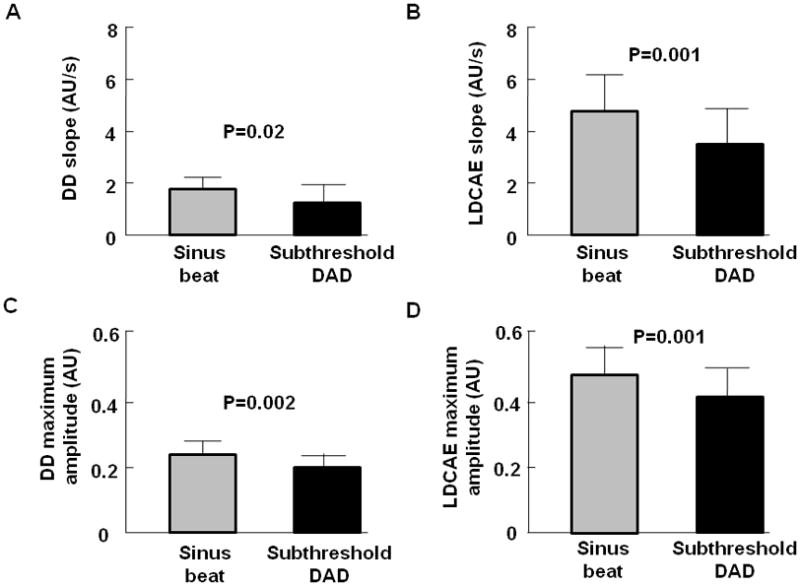
A, The slopes of DD. B, The slopes of LDCAE. C, The maximum amplitude of DD. D, The maximum amplitude of LDCAE. These data show that the slopes of DD and LDCAE were higher for the sinus beats than the subthreshold DADs. Similarly, the maximum amplitudes of DD and LDCAE were higher in sinus beats than for subthreshold DADs. These findings suggest that insufficient magnitudes of LDCAE and DD were associated with the failure of subthreshold DAD to reach threshold.
Discussion
Major findings
We found that sympathetic stimulation increased heart rate, and induce LDCAE at the superior SAN. In normal conditions, the LACAE induced DD with sufficient Vm changes, leading to the activation of ICa,L and a full action potential. However, if the LACAE and DD were too small to trigger an action potential, then a DAD is observed.
Subthreshold DADs in the SAN
We propose that the subthreshold DD in the SAN documented in the present study were subthreshold DADs. The reasons were: (A) In all instances, the onset of Cai elevation preceded or was simultaneous with the onset of Vm elevation, suggesting non-voltage gated SR Ca release is the driving mechanism for Vm changes. (B) In some episodes, apparent Cai elevation at the SAN was not associated with significant Vm changes. These latter findings are consistent with recent studies that show Ca waves in multicellular preparations may fail to change Vm due to electrotonic interaction with neighboring cells.14, 17 Single cell transmembrane potential recordings in the past have shown spontaneous membrane potential elevations during late diastole in cells with spontaneous phase 4 depolarizations.18–19 However, those authors did not perform simultaneous Cai transient mapping at the site of Vm changes. It is therefore unclear if those depolarizations were subthreshold DADs or were due to other mechanisms.
SAN Activations and Propagation
Fedorov et al20 showed that SAN activation exit to the RA through specific pathways. Due to structural complexities, the authors propose that optical signals from the SAN may be mixed with that from the RA. When exit block occurs, the SAN may activate alone. The size of the SAN activation recorded in their study is similar to the large subthreshold DADs observed in the present study. Therefore, an alternative explanation to our observation is that the subthreshold DADs observed in the present study were in fact a full activation of the SAN. Some of the SAN activations failed to propagate into the neighboring RA, resulting in an isolated activation confined to SAN itself.
However, this alternative explanation did not satisfactorily explain all findings of this study. While Fedorov et al20 did not have simultaneous Cai mapping in their study, we observed that spontaneous Cai elevation preceded the changes of the DAD-like Vm changes at the SAN. Due to this temporal sequence, the Cai elevation could not have been triggered by the Vm changes. A second inconsistency is that the LDCAE amplitude and slope were larger in conducted beats than in the ones not associated with conducted beats, as shown in Figure 4. In some cases, the Cai elevation was not associated with any changes of the Vm (arrows, Figure 4B). Exit block hypothesis cannot fully explain the variations of Vm amplitude in the SAN, nor the LDCAE without Vm changes at that site. On the other hand, LDCAE with variable Vm changes are commonly observed in the intact ventricular tissues and in the whole heart.14, 17 Therefore, while the results of the present study can be partially explained by the exit block hypothesis,20 we propose that subthreshold DAD of SNA remains the best explanation of our findings.
Subthreshold DAD and a New Mechanism of Atrial Arrhythmia
An escape beat after a subthreshold DAD in a single SAN cell was followed by a full compensatory pause.12 In intact RA preparation, however, failure of subthreshold DAD to reach threshold allowed latent pacemakers elsewhere to activate the atrium, resulting in atrial arrhythmia. In these arrhythmic episodes, a beat that closed the longer PP interval, rather than a premature beat, was from an ectopic focus. This phenomenon was also compatible with the concept of parasystole in which the SAN was a source of normal rhythm while the ectopic pacemaker was the parasystolic focus. When the SAN failed to generated a rhythm to inhibit (or pre-excite) the parasystolic focus, the latter was able to exit and capture the entire RA. Shinohara et al21 recently used the same intact RA preparation to study the mechanisms of pacemaking of the ectopic pacemakers. They found that while spontaneous SR Ca release (Ca clock) underlies isoproterenol-induced increase of superior SAN activity, the atrial ectopic pacemaker is less dependent on the Ca clock and more dependent on the membrane clock for its automaticity. These ectopic pacemakers outside the SAN therefore can effectively serve as backup pacemakers when SAN fails. The co-existence of two pacemaking sites resulted in atrial arrhythmias observed in the present study.
Clinical Implications
Atrial arrhythmia occurs in 35% of apparently normal subjects during treadmill exercise testing.22 It was possible that some of these atrial arrhythmias were induced by the mechanisms reported in the present study. While atrial arrhythmias might be benign in normal subjects, exercise induced atrial arrhythmias were known to be associated with adverse long-term outcome in patients with underlying cardiovascular diseases.23 It was possible that these arrhythmias were manifestations of abnormal SR function associated with organic heart diseases. Abnormal SR function could affect both cardiac contraction and the Ca clock of the SAN. The association between exercise induced atrial arrhythmia and poor prognosis might therefore be an epiphenomenon related to poor SR Ca handling in those patients.
Study limitations
Because it was not possible to record the optical signals continuously for prolonged period of time, some subthreshold DADs might not have been recorded. Therefore, the low incidence of subthreshold DAD in the intact SANs (4/31, or 13%) shown in this study may underestimate the importance of this mechanism in atrial arrhythmogenesis.
Conclusion
The isoproterenol-induced LDCAE of superior SAN results in DD and full action potentials in most cases. However, in rare situations, the isoproterenol-induced LDCAE triggered only a DAD but not an action potential, allowing latent ectopic atrial pacemakers to activate and excite the atrium. The failure of DAD-like DD to consistently trigger a sinus beat is a novel mechanism of atrial arrhythmogenesis.
Supplementary Material
LDCAE triggers sinus beat in the superior SAN. This movie shows Vm and Cai optical mapping of the first beat of Figure 1. The Cai elevation is observed during late diastolic period at the superior SAN (yellow mark in Cai map), and the activation starts from the same site (yellow mark in Vm map).
The subthreshold DAD at the superior SAN. This movie shows Vm and Cai optical mapping of the second beat of Figure 1. The Cai elevation is observed during late diastolic period at the superior SAN (yellow mark in Cai map), but failed to trigger a full action potential. The activation starts from the ectopic focus at the inferior RA (white mark in Vm map).
Acknowledgments
This study was supported by the National Institute of Health, National Heart Lung and Blood Institute grant number P01 HL78931, R01 HL78932, 71140, a Korean Healthcare Technology Research and Develop grant number A085136, a Yonsei faculty research grant (BJ), a Chinese National Natural Science Foundation grant number 30870659 (HZ), a Korea Research Foundation Grant (KRF-2008-357-E00028) funded by the Korean Government (Dr Choi), an AHA Established Investigator Award (SFL) and a Medtronic-Zipes Endowment (PSC).
Footnotes
Dr. Chen reports equipment donated by St. Jude Medical, Medtronic and Cryocath, as well as travel support for lectures. Other authors: No disclosures.
References
- 1.Bers DM. Calcium cycling and signaling in cardiac myocytes. Annu Rev Physiol. 2008;70:23–49. doi: 10.1146/annurev.physiol.70.113006.100455. [DOI] [PubMed] [Google Scholar]
- 2.ter Keurs HE, Zhang YM, Miura M. Damage-induced arrhythmias: reversal of excitation-contraction coupling. Cardiovasc Res. 1998;40(3):444–455. doi: 10.1016/s0008-6363(98)00263-6. [DOI] [PubMed] [Google Scholar]
- 3.Boyden PA, ter Keurs HE. Reverse excitation-contraction coupling: Ca2+ ions as initiators of arrhythmias. J Cardiovasc Electrophysiol. 2001;12(3):382–385. doi: 10.1046/j.1540-8167.2001.00382.x. [DOI] [PubMed] [Google Scholar]
- 4.Lakatta EG, DiFrancesco D. What keeps us ticking: A funny current, a calcium clock, or both? J Mol Cell Cardiol. 2009 doi: 10.1016/j.yjmcc.2009.03.022. [DOI] [PMC free article] [PubMed] [Google Scholar]
- 5.Maltsev VA, Lakatta EG. Synergism of coupled subsarcolemmal Ca2+ clocks and sarcolemmal voltage clocks confers robust and flexible pacemaker function in a novel pacemaker cell model. Am J Physiol Heart Circ Physiol. 2009;296(3):H594–H615. doi: 10.1152/ajpheart.01118.2008. [DOI] [PMC free article] [PubMed] [Google Scholar]
- 6.Lakatta EG, Maltsev VA, Vinogradova TM. A coupled SYSTEM of intracellular Ca2+ clocks and surface membrane voltage clocks controls the timekeeping mechanism of the heart’s pacemaker. Circ Res. 2010;106(4):659–673. doi: 10.1161/CIRCRESAHA.109.206078. [DOI] [PMC free article] [PubMed] [Google Scholar]
- 7.Zhou Z, Lipsius SL. Na(+)-Ca2+ exchange current in latent pacemaker cells isolated from cat right atrium. Journal of Physiology. 1993;466:263–285. [PMC free article] [PubMed] [Google Scholar]
- 8.Hata T, Noda T, Nishimura M, Watanabe Y. The role of Ca2+ release from sarcoplasmic reticulum in the regulation of sinoatrial node automaticity. Heart Vessels. 1996;11(5):234–241. doi: 10.1007/BF01746203. [DOI] [PubMed] [Google Scholar]
- 9.Rigg L, Terrar DA. Possible role of calcium release from the sarcoplasmic reticulum in pacemaking in guinea-pig sino-atrial node. Exp Physiol. 1996;81(5):877–880. doi: 10.1113/expphysiol.1996.sp003983. [DOI] [PubMed] [Google Scholar]
- 10.Ju YK, Allen DG. Intracellular calcium and Na+-Ca2+ exchange current in isolated toad pacemaker cells. Journal of Physiology. 1998;508 ( Pt 1):153–166. doi: 10.1111/j.1469-7793.1998.153br.x. [DOI] [PMC free article] [PubMed] [Google Scholar]
- 11.Huser J, Blatter LA, Lipsius SL. Intracellular Ca2+ release contributes to automaticity in cat atrial pacemaker cells. J Physiol. 2000;524(Pt 2):415–422. doi: 10.1111/j.1469-7793.2000.00415.x. [DOI] [PMC free article] [PubMed] [Google Scholar]
- 12.Bogdanov KY, Vinogradova TM, Lakatta EG. Sinoatrial nodal cell ryanodine receptor and Na(+)-Ca(2+) exchanger: molecular partners in pacemaker regulation. Circ Res. 2001;88(12):1254–1258. doi: 10.1161/hh1201.092095. [DOI] [PubMed] [Google Scholar]
- 13.Maltsev VA, Vinogradova TM, Lakatta EG. The emergence of a general theory of the initiation and strength of the heartbeat. J Pharmacol Sci. 2006;100(5):338–369. doi: 10.1254/jphs.cr0060018. [DOI] [PubMed] [Google Scholar]
- 14.Fujiwara K, Tanaka H, Mani H, Nakagami T, Takamatsu T. Burst Emergence of Intracellular Ca2+ Waves Evokes Arrhythmogenic Oscillatory Depolarization via the Na+-Ca2+ Exchanger Simultaneous Confocal Recording of Membrane Potential and Intracellular Ca2+ in the Heart. Circ Res. 2008;103(5):509–518. doi: 10.1161/CIRCRESAHA.108.176677. [DOI] [PubMed] [Google Scholar]
- 15.Joung B, Tang L, Maruyama M, Han S, Chen Z, Stucky M, Jones LR, Fishbein MC, Weiss JN, Chen PS, Lin SF. Intracellular calcium dynamics and acceleration of sinus rhythm by beta-adrenergic stimulation. Circulation. 2009;119(6):788–796. doi: 10.1161/CIRCULATIONAHA.108.817379. [DOI] [PMC free article] [PubMed] [Google Scholar]
- 16.Efimov IR, Fedorov VV, Joung B, Lin SF. Mapping cardiac pacemaker circuits: methodological puzzles of the sinoatrial node optical mapping. Circ Res. 2010;106(2):255–271. doi: 10.1161/CIRCRESAHA.109.209841. [DOI] [PMC free article] [PubMed] [Google Scholar]
- 17.Maruyama M, Joung B, Tang L, Shinohara T, On YK, Han S, Choi EK, Kim DH, Shen MJ, Weiss JN, Lin SF, Chen PS. Diastolic intracellular calcium-membrane voltage coupling gain and postshock arrhythmias: role of Purkinje fibers and triggered activity. Circulation Research. 2010;106:399–408. doi: 10.1161/CIRCRESAHA.109.211292. [DOI] [PMC free article] [PubMed] [Google Scholar]
- 18.Wit AL, Cranefield PF. Triggered activity in cardiac muscle fibers of the simian mitral valve. Circ Res. 1976;38(2):85–98. doi: 10.1161/01.res.38.2.85. [DOI] [PubMed] [Google Scholar]
- 19.Bromberg BI, Hand DE, Schuessler RB, Boineau JP. Primary negativity does not predict dominant pacemaker location: implications for sinoatrial conduction. American Journal of Physiology. 1995;269(3 Pt 2):H877–H887. doi: 10.1152/ajpheart.1995.269.3.H877. [DOI] [PubMed] [Google Scholar]
- 20.Fedorov VV, Schuessler RB, Hemphill M, Ambrosi CM, Chang R, Voloshina AS, Brown K, Hucker WJ, Efimov IR. Structural and functional evidence for discrete exit pathways that connect the canine sinoatrial node and atria. Circ Res. 2009;104(7):915–923. doi: 10.1161/CIRCRESAHA.108.193193. [DOI] [PMC free article] [PubMed] [Google Scholar]
- 21.Shinohara T, Joung B, Kim D, Maruyama M, Luk HN, Chen PS, Lin SF. Induction of atrial ectopic beats with calcium release inhibition: Local hierarchy of automaticity in the right atrium. Heart Rhythm. 2010;7(1):110–116. doi: 10.1016/j.hrthm.2009.09.068. [DOI] [PMC free article] [PubMed] [Google Scholar]
- 22.Whinnery JE. Dysrhythmia comparison in apparently healthy males during and after treadmill and acceleration stress testing. American Heart Journal. 1983;105(5):732–737. doi: 10.1016/0002-8703(83)90233-8. [DOI] [PubMed] [Google Scholar]
- 23.Bunch TJ, Chandrasekaran K, Gersh BJ, Hammill SC, Hodge DO, Khan AH, Packer DL, Pellikka PA. The prognostic significance of exercise-induced atrial arrhythmias. J Am Coll Cardiol. 2004;43(7):1236–1240. doi: 10.1016/j.jacc.2003.10.054. [DOI] [PubMed] [Google Scholar]
Associated Data
This section collects any data citations, data availability statements, or supplementary materials included in this article.
Supplementary Materials
LDCAE triggers sinus beat in the superior SAN. This movie shows Vm and Cai optical mapping of the first beat of Figure 1. The Cai elevation is observed during late diastolic period at the superior SAN (yellow mark in Cai map), and the activation starts from the same site (yellow mark in Vm map).
The subthreshold DAD at the superior SAN. This movie shows Vm and Cai optical mapping of the second beat of Figure 1. The Cai elevation is observed during late diastolic period at the superior SAN (yellow mark in Cai map), but failed to trigger a full action potential. The activation starts from the ectopic focus at the inferior RA (white mark in Vm map).