

Abstract
The morphology of postcranial articular surfaces is expected to reflect their weight-bearing properties, as well as the stability and mobility of the articulations to which they contribute. Previous studies have mainly confirmed earlier predictions of isometric scaling between articular surface areas and body mass; the exception to this is ‘male-type’, convex articular surface areas, which may scale allometrically due to differences in locomotor strategies within the analysed samples. In the present study, we used new surface scanning technology to quantify more accurately articular surface areas and to test those predictions within the talus of hominoid primates, including modern humans. Our results, contrary to predictions, suggest that there are no generalised rules of articular scaling within the talus of hominoids. Instead, we suggest that articular scaling patterns are highly context-specific, depending on the role of each articulation during locomotion, as well as taxon- and sex-specific differences in locomotion and ontogenetic growth trajectories within any given sample. While this may prove problematic for inferring body mass based on articular surface area, it also offers new opportunities of gaining substantial insights into the locomotor patterns of extinct species.
Keywords: allometry, ankle, articular facet, astragalus, hominoidea, human, isometry, joint surface area, primates, scaling, talus
Introduction
The morphology of postcranial articular surfaces is expected to reflect their weight-bearing properties, as well as the stability and mobility of the articulations to which they contribute (Swartz, 1989). As a result, it has been argued that a key determinant of articular surface morphology should be the aim of constraining the amount of load relative to surface area to minimise the risk of damage to cartilage and subchondral bone structure (Radin et al. 1982; Jungers, 1991; Lieberman et al. 2001). Alexander (1980, 1981) proposed that maximum joint stresses may be of the same order of magnitude across mammals, irrespective of body mass, implying a biomechanical foundation for a null hypothesis of isometric scaling between articular surface area and body mass (Ruff, 1988; Jungers, 1991). A number of studies set out to test this hypothesis for primates and other mammals, primarily based on the articular surface areas of the long bones (humerus, femur, tibia) but also using estimates for tarsal articular surface areas (Dagosto & Terranova, 1992). Although some have suggested scaling relationships that deviate from isometry (Swartz, 1989), most have found support for isometric scaling, particularly where analyses are restricted to species with similar modes of locomotion (Ruff, 1988; Godfrey et al. 1991; Jungers, 1991). Previous reports of positive allometric relationships were shown to be an artefact of species of different sizes adopting different types of locomotion (Godfrey et al. 1991; Ruff & Runestad, 1992). Godfrey et al. (1991) also highlight the importance of understanding and stating a priori how joint surfaces operate within an articulation. The ‘female’ (concave) facet of an articular pair is likely to be more informative with respect to identifying patterns of surface area scaling with body mass related to weight-bearing, whereas ‘male’ (convex) articular surfaces are more likely to reflect differences in mobility. As such, Godfrey et al. (1991) predict, and largely confirm for their sample, that female articular surface areas should scale isometrically with body mass (or body mass proxies), whereas male surface areas may scale non-isometrically with body mass as a result of size-related differences in locomotor modes.
In apparent contrast, a study of scaling patterns in the radiocarpal joints of strepsirrhine primates suggested that the size of both ‘male’ and ‘female’ articular surface areas, measured as the transverse (radio-ulnar) arc length of each area, scaled isometrically with body size (Hamrick, 1996). The study concluded that in the strepsirrhine radiocarpal joint, differences in locomotor type were reflected in differences in articular surface curvature, but not articular size (Hamrick, 1996).
The recent development of surface pin scanning and of surface laser scanning techniques has vastly improved the feasibility of studies of articular surface areas, as well as their accuracy (Tocheri et al. 2003, 2005; Polly, 2008; Tocheri, 2007). To date, however, these new techniques have not been used to revisit the questions of how different articular surface areas scale with size and how these scaling relationships relate to biomechanical function.
The talus
The talus provides an ideal model bone for testing hypotheses relating to the scaling of articular facet surface areas. It contributes to the upper ankle joint, as well as to the more complex talo-calcaneo-navicular (mid-tarsal) and subtalar joints (Gray, 1989). It has both predominantly convex articular facets (the trochlea, talus head and sustentaculum facets) and predominantly concave articular facets (the calcaneal, medial and lateral facets) (Fig. 1). In addition, it is more frequently found in a near-complete state in the fossil record than other elements of the post-cranial skeleton, making a better understanding of its morphology desirable for the interpretation of locomotor patterns in extinct species, including hominins. Further, Dagosto & Terranova (1992) found the articular surfaces in strepsirrhine primates to be at least as effective for predicting body mass as dental measurements, and used their tarsal articular surface area measurements to calculate body mass estimates for fossil Adapiformes and Omomyiformes specimens.
Fig. 1.
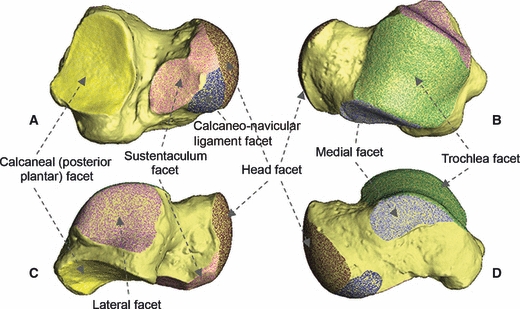
Plantar (A), dorsal (B), lateral (C) and medial (D) aspects of the right astragalus of a male Homo sapiens. Articular facets are shown in stippled colour and labelled. The non-articular surface is shown in uniform light yellow.
The talus contributes to two separate synovial joints (i.e. joints isolated by synovial capsules) (Gray, 1989): the upper ankle joint (between the trochlea, lateral and medial articular facets of the talus and the tibia and fibula) and the talo-calcaneo-navicular joint. The talo-calcaneo-navicular joint is a compound articulation between the talus, calcaneus and navicular bones, which incorporates the sustentaculum, head and calcaneo-navicular ligament facets of the talus (Fig. 2). It also possesses a fibrous capsule that isolates it as an articular unit. The subtalar joint is a functional unit, which forms the articulation between the talus and the calcaneus (Gray, 1989). It incorporates the talus’ calcaneal (posterior plantar) facet and the sustentaculum facet, which is also part of the talo-calcaneo-navicular articular unit (Fig. 2). Although the sub-talar joint is a functional unit, it is not an articular unit, as it lacks a continuous synovial capsule.
Fig. 2.
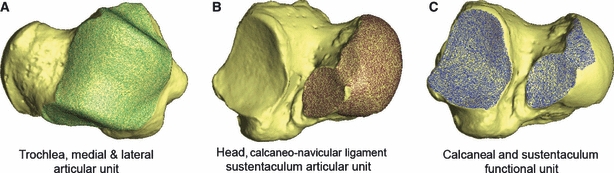
Right Homo sapiens astragalus showing (A) the upper ankle joint, or trochlea, articular unit (incorporating trochlea, medial and lateral facets) highlighted in green, (B) the talo-calcaneo-navicular articular unit (incorporating head, calcaneo-navicular ligament and sustentaculum facets) highlighted in brown, and (C) the sub-talar functional unit (incorporating calcaneal and sustentaculum facets) highlighted in blue.
Aims and hypotheses
In the present study we use new quantitative surface data, acquired using laser scanning techniques, to examine the scaling properties of articular surface areas in the talus of hominoid primates. We first test the relationship between centroid size, commonly used in geometric morphometric studies as a proxy for size (Rohlf & Slice, 1990), and body mass. A resulting model with high explanatory power (high R2) would indicate that centroid size is a useful proxy for body mass.
Following the predictions made by Alexander (1980) and broadly confirmed by studies of long bones by others (Ruff, 1988; Godfrey et al. 1991; Jungers, 1991; Hamrick, 1996), we expect weight-bearing ‘female’-type articular surface areas to scale close to isometrically with body mass across species. Thus, we predict that the calcaneal articular facet will scale isometrically with body mass across species. We expect the inter-specific scaling pattern of ‘male’-type articular surface areas to differ from isometry to reflect size-related differences in locomotor patterns between species. Although the trochlea is saddle-shaped rather than exclusively convex, its predominant curvature makes it a convex facet, reflecting its potential for guiding dorso-plantar flexion and extension. Thus, we hypothesise that scaling patterns of the trochlea, sustentaculum and head articular facets will differ from isometry. The synovial articular units are composed principally of convex (‘male’-type) facets, thus we hypothesise that both trochlea and head articular units will scale allometrically across species. The subtalar joint functional unit consists of both convex (sustentaculum) and concave (calcaneal) facets, with the calcaneal facet being the larger of the two. Thus, in line with previous hypotheses, we predict that the subtalar joint surface area will scale isometrically across species.
Intra-specifically, we expect similar scaling patterns for both ‘female’ and ‘male’-type articular surface areas, in line with the limited variation in locomotor patterns within individual species.
Possible exceptions are the gorillas and orang-utans, where significant levels of sexual body mass dimorphism may be reflected in a more pronounced range of locomotor types and substrate use. More specifically, the lighter females may be able to engage in more diverse arboreal locomotion and benefit from more mobile articulations than the heavier males. This in turn may be reflected in relatively larger convex (male-type) articular surface areas and, consequently, result in negative allometric scaling of the trochlea, sustentaculum and head articular facets, as well as of the trochlea and head articular units within those two taxa.
Materials and methods
The extant sample consisted of tali of individuals of Hylobates moloch, Symphalangus syndactylus, Pongo pygmaeus sensu lato, Gorilla gorilla, Pan troglodytes and Homo sapiens (Table 1). Orang-utans from Borneo and Sumatra were treated as one sample.
Table 1.
Material and sample sizes
| Species/populations | Sample size | Collections |
|---|---|---|
| Hylobates moloch | 9 | ZSM |
| Symphalangus syndactylus | 10 | ZSM |
| Pongo pygmaeus | 14 | ZSM, NC, GMZ, OUMNH |
| Gorilla gorilla | 31 | PCM, NHMZ, NC |
| Pan troglodytes | 30 | PCM, NHMZ, NC |
| Homo sapiens | 58 | |
| Andomanese islander | 13 | NHMP |
| Australian aboriginal | 5 | NHMP |
| Sri Lankan (Osman Hill collection) | 8 | NHMP |
| African bushwomen | 7 | NHMP |
| Industrial Briton (Spitalfields collection) | 12 | NHMP |
| Romano Briton (Poundbury collection) | 13 | NHMP |
| Fossils | ||
| OH-8, AL-288, KNM-ER 1464, KNM-ER 1476 | 4 | NHMP |
| Homo neanderthalensis: SP4B, EM 3519 | 2 | NHMP |
| Homo sapiens: Clarke Howell Omo (anatomically modern human?) | 1 | NHMP |
GMZ, Grant Museum of Zoology, University College London; NHMP, Palaeontology Department, The Natural History Museum, London; NHMZ, Zoology Department, The Natural History Museum, London; OUMNH, Oxford University Museum of Natural History; PCM, Powell Cotton Museum, Kent; NC, Napier Collection, Department of Anthropology, University College London; UMZC, University Museum of Zoology, Cambridge; ZSM, Zoologische Staatssammlung, Munich.
All fossil specimens used in the study were casts housed in the Palaeontology Department of Natural History Museum, London. EM3519 and SPB4 are assigned to Homo neanderthalensis. EM 3519 is the talus from the Tabun C1 skeleton, which was recently dated to 122 ± 16 Ka by Grün & Stringer (2000). The much larger SP4B specimen is from the Spy 2 (Belgium) Homo neanderthalensis and belongs to an adult male of about 25 years of age. The Clark Howell Omo specimen is a previously un-reported specimen labelled Clark Howell Omo in the NHM collection. This fossil is from the Omo deposits in Ethiopia, and specifically from the ‘pelvic corner’ region of the deposits. These same deposits yielded other fossil specimens, which were assigned to early anatomically modern Homo sapiens (Stringer, 2003; McDougall et al. 2005; Pearson et al. 2008). These other fossil specimens have been dated to between 104 ± 7 and 196 ± 2 Kyr (McDougall et al. 2005). The AL-288 talus belongs to the Australopithecus afarensis individual ‘Lucy’ from 3.18 mya (Walter, 1994). The OH8 talus is derived from a very complete tarsal complex from Olduvai and dated to 1.8–1.9 mya (Wood, 1992). The taxonomic affiliation of this specimen is still the subject of debate as no dental remains accompanied the tarsals. Gebo & Schwartz (2006) suggest that OH8 is most likely either Australopithecus boisei or Homo habilis. The two Koobi Fora specimens, KNM-ER 1464 and KNM-ER 1476 from 1.7 to 1.9 mya (Feibel et al. 1989), also lack associated dental remains, and taxonomic allocation of these specimens remains tentative. While ER 1476 may belong to a robust australopithecine, assigning ER 1464 to either Australopithecus or Homo has proved particularly difficult (Gebo & Schwartz, 2006).
A Konica Minolta Vivid 910 surface laser scanner was used to capture the entire surface morphology of each talus. The scanner is accurate to X: ± 0.22 mm, Y: ± 0.16 mm, Z: ± 0.10 mm. Surface data are initially captured and processed using the scanner's associated software, polygon editing tool (pet) (Minolta, 2006). Four individual scans of each specimen were performed at 90° intervals using a rotating platform attached to the scanner. The specimen was then re-positioned and an additional four scans were performed at 90° intervals to ensure that all aspects of the bone had been captured. The resulting surface scans were stored for registration and further manipulation using the pet software. The registration step is an iterative closest point (ICP) fit of the surface morphology of overlapping regions in each of the scans (Besl & McKay, 1992). After registration, additional scans were occasionally taken to cover any parts of the bones that previously had not been captured sufficiently well. Once registration of all scans was complete, the scans were ‘merged’ to create a 3D virtual bone. Merged scans would often have small holes due to the merging process not succeeding in integrating the initial scans flawlessly. These holes were filled using rapidform 2006 (INUS Technology, 2006). It is important to fill all holes of the bone surface so that any measures of bone surface area are not influenced by the size of holes in the model surface. All other scanning and merging artefacts that are not attached to the shell surface are then deleted to leave the finished shell, or 3D virtual bone. The resulting shells, or virtual 3D bones, are made up of point clouds and triangles. The points have x, y, z coordinates in 3D space, and the triangles are created by joining these 3D points.
To calculate the surface areas of articular facets, the facets are isolated using the 3D editing software pet (Minolta, 2006). The isolation of articular surfaces was done by hand, as in Tocheri (2007) and Jungers et al. (2009), as opposed to using watershed segmentation algorithm software (Razdan & Bae, 2003), such as that used by Tocheri et al. (2005, 2007) in earlier works. For smaller specimens, the surfaces of the whole bones were ‘subdivided’ prior to isolating articular facets. In this process the number of 3D points that describe the surface of the bone is increased. 3D points are effectively laid down on the surface of the 3D virtual bone, meaning that the surface area and appearance of the 3D virtual bone are unchanged. Subdivision prevents the edges of cut out surfaces from being too jagged, which may result in inaccurate quantification of surface areas.
The hominin fossil casts were scanned and their talar articular surfaces isolated using the same protocol. Some fossil specimens had suffered damage to some of their articular facets. Where the extent of damage would have significantly influenced surface area measurements, the affected articular facets were excluded from the analyses.
Some of the articular facets were grouped into articular or functional units (Fig. 2). As the surface of the virtual bone models is made up of triangulated point clouds, the surface areas of the articular facets, and articular and functional units, can be calculated by summing the surface areas of all of the triangles (between the 3D coordinate points) making up those elements of the surface of the bone model.
An error analysis was performed to test the reliability of the model creation and articular facet isolation. Six specimens, one from each species group, were selected at random. New whole talus models were created and the seven articular surfaces isolated from these new models. The percentage difference in the facet surface areas calculated from the new models compared to the original facet surface areas was then calculated.
To allow for intra-specific analyses, centroid size (Gower, 1975; Rohlf & Slice, 1990) was calculated for each talus in order for cubed centroid size (CS3) to be used subsequently as a proxy for body mass. Before proceeding, it is important to establish that talus centroid size is in fact a suitable proxy for body mass. As our sample does not include individuals of known body mass, this could only be done at the inter-specific level. Mean male and mean female body mass for each species were derived from the literature (Holloway, 1980; Smith & Jungers, 1997) (Table 2) and regressed against the species male and female mean cubed centroid sizes. Reduced major axis (RMA) regression was used to model the relationship between ln-transformed body mass and ln-transformed cubed centroid size. Ideally, the regression model should have a high predictive power, indicated by a high R2 value.
Table 2.
Inter-specific scaling properties of individual and combined articular facet surface areas relative to centroid size and body mass in hominoid primates
| Facet surface area vs. cubed centroid size (CS3) | Facet surface area vs. body mass | ||||||
|---|---|---|---|---|---|---|---|
| Facets | Facet type | Scaling exponent (95% CI) | R2 | Reject isometry? | Scaling exponent (95% CI) | R2 | Reject isometry? |
| Trochlea | Male-type | 0.676 (0.639, 0.713) | 0.998 | No | 0.767 (0.643, 0.891) | 0.986 | No |
| Head | Male-type | 0.654 (0.567, 0.740) | 0.991 | No | 0.741 (0.584, 0.897) | 0.977 | No |
| Sustentaculum | Male-type | 0.744 (0.607, 0.880) | 0.982 | No | 0.841 (0.649, 1.034) | 0.973 | No |
| Calcaneal | Female-type | 0.782 (0.693, 0.872) | 0.993 | Yes | 0.886 (0.688, 1.084) | 0.974 | Yes |
| Head articular unit | Male-type | 0.673 (0.559, 0.787) | 0.985 | No | 0.762 (0.563, 0.961) | 0.965 | No |
| Trochlea articular unit | Mixed | 0.657 (0.605, 0.709) | 0.997 | No | 0.746 (0.620, 0.873) | 0.985 | No |
| Subtalar joint functional unit | Mixed | 0.766 (0.663, 0.869) | 0.991 | No | 0.867 (0.676, 1.058) | 0.975 | Yes |
Inter-specific scaling properties between (i) species mean articular surface areas and mean body mass, and between (ii) species mean articular surface areas and mean talus centroid size were estimated using RMA models. Fossil body mass was estimated on the basis of the resulting regression models based on the modern comparative sample. Additionally, intra-specific scaling properties between individual articular surface values and talus centroid size were also estimated using RMA models. All statistical analyses were performed in mathematica version 6.0 (Wolfram Research Inc., 2007).
Results
Error analysis
The error analysis for our method of calculating articular facet surface area generally showed low percentage errors for the trochlea (mean error 3.5%, SD 2.68) and calcaneal (mean error 3.2%, SD 2.22) individual facets. The percentage errors were low for the articular units (trochlea articular unit, mean error 1.2%, SD 0.83; head articular unit, mean error 2.4%, SD 1.18) and functional unit (mean error 4.2%, SD 3.20). However, the head (mean error 6.4%, SD 5.47) and sustentaculum (mean error 6.6%, SD 6.01) facets had slightly higher percentage errors. The reduced reliability of the head and sustentaculum facet isolation may be due to difficulties in determining the exact limits between the edge of the head facet and its juxtaposed calcaneo-navicular ligament facet and sustentaculum facets in some of the specimens. However, while this reduces the strength of modelled relationships, it is unlikely to introduce a systematic bias into the data. This is confirmed by the fact that R2-values for the models involving the head and sustentaculum facets are generally lower than those of other facet models in the intra-specific models, but are comparable to those of the other facet models in the inter-specific models (Table 2).
Talus centroid size as body mass proxy
There is a strong positive inter-specific correlation between mean cubed centroid size (CS3) and mean body mass (R2 = 0.978; Fig. 3). The scaling coefficients for the regression analyses are larger than 1 (1.167). The 95% confidence intervals did not include the isometric scaling coefficient (95% confidence interval, CI: 1.045, 1.289). The very high R2 value suggests that talus centroid size is a suitable proxy for body mass. The positive allometric scaling of centroid size relative to body mass is reflected in the fact that scalars of articular surface areas relative to centroid size (CS3) are smaller throughout than the scalars of the same articular surface areas relative to body mass (Table 2). However, the extent to which scaling patterns derived from inter-specific analyses can be extrapolated to intra-specific analyses remains untested. As a result, we largely restrict our discussion of intra-specific scaling patterns to comparisons between groups and refrain from specifically arguing in favour of isometric or allometric scaling relative to body mass in individual groups.
Fig. 3.
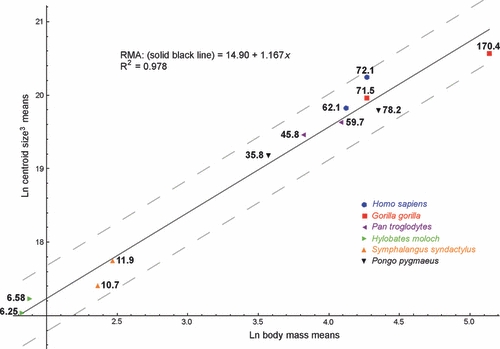
Scatterplot of ln-transformed cubed mean male and cubed mean female centroid size against ln-transformed mean male and mean female body mass (in kg) for six hominoid taxa. Numbers next to the dots represent the mean male (the larger figure in each taxon) and female body mass values (derived from Smith & Jungers, 1997). The solid line shows the regression model for all taxa. The grey dashed lines show the 95% confidence limits for the model.
Individual facet areas
Inter-specific regression of mean trochlea facet surface area against mean species CS3 returned a scaling exponent of 0.676 (Fig. 4, Table 2). Regression against mean species body mass resulted in a slightly higher scaling exponent of 0.767 (Table 2). In both cases, the 95% CI included 0.67, the exponent value expected for isometric scaling (Table 2). There are considerable differences between intra-specific scaling exponents, although 95% CIs are generally wide (Table 3). Isometric scaling relative to centroid size is nevertheless rejected in favour of positive allometry in orang-utans (Table 3).
Fig. 4.
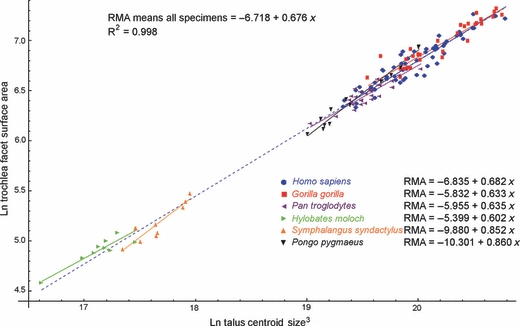
Scatterplot of ln-transformed trochlea facet surface area against ln-transformed cubed astragalus centroid size (CS3). The inter-specific regression model is shown by the dashed blue line. Intra-specific regression models are shown by the solid colour-coded lines.
Table 3.
Intra-specific scaling properties of individual and combined articular facet surface areas relative to centroid size in hominoid primates
| Facet | Facet type | Scaling exponent (95% CI) | R2 | Reject isometric scaling with centroid size? |
|---|---|---|---|---|
| Hylobates moloch | ||||
| Trochlea | Male-type | 0.602 (0.381, 0.822) | 0.832 | No |
| Head | Male-type | 0.682 (0.267, 1.096) | 0.538 | No |
| Sustentaculum | Male-type | 0.794 (0.398, 1.191) | 0.688 | No |
| Calcaneal | Female-type | 0.708 (0.392, 1.023) | 0.752 | No |
| Head articular unit | Male-type | 0.702 (0.445, 0.959) | 0.833 | No |
| Trochlea articular unit | Mixed (mainly male) | 0.584 (0.403, 0.764) | 0.880 | No |
| Subtalar joint functional unit | Mixed | 0.719 (0.414, 1.025) | 0.774 | No |
| Symphalangus syndactylus | ||||
| Trochlea | Male-type | 0.852 (0.549, 1.156) | 0.809 | No |
| Head | Male-type | 0.752 (0.377, 1.128) | 0.626 | No |
| Sustentaculum | Male-type | 0.946 (0.431, 1.460) | 0.555 | No |
| Calcaneal | Female-type | 0.922 (0.601, 1.244) | 0.817 | No |
| Head articular unit | Male-type | 0.631 (0.524, 0.737) | 0.957 | No |
| Trochlea articular unit | Mixed (mainly male) | 0.719 (0.545, 0.893) | 0.912 | No |
| Subtalar joint functional unit | Mixed | 0.844 (0.592, 1.096) | 0.866 | No |
| Pongo pygmaeus | ||||
| Trochlea | Male-type | 0.860 (0.766, 0.954) | 0.973 | Yes |
| Head | Male-type | 0.667 (0.463, 0.871) | 0.788 | No |
| Sustentaculum | Male-type | 0.766 (0.418, 1.114) | 0.531 | No |
| Calcaneal | Female-type | 0.733 (0.599, 0.867) | 0.924 | No |
| Head articular unit | Male-type | 0.567 (0.430, 0.704) | 0.867 | No |
| Trochlea articular unit | Mixed (mainly male) | 0.760 (0.674, 0.847) | 0.970 | Yes |
| Subtalar joint functional unit | Mixed | 0.700 (0.528, 0.873) | 0.862 | No |
| Gorilla gorilla | ||||
| Trochlea | Male-type | 0.633 (0.551, 0.716) | 0.883 | No |
| Head | Male-type | 0.576 (0.489, 0.663) | 0.841 | Yes (negative allometry) |
| Sustentaculum | Male-type | 0.767 (0.622, 0.912) | 0.753 | No |
| Calcaneal | Female-type | 0.811 (0.739, 0.882) | 0.947 | Yes |
| Head articular unit | Male-type | 0.642 (0.554, 0.729) | 0.872 | No |
| Trochlea articular unit | Mixed (mainly male) | 0.659 (0.613, 0.705) | 0.966 | No |
| Subtalar joint functional unit | Mixed | 0.764 (0.685, 0.844) | 0.925 | Yes |
| Pan troglodytes | ||||
| Trochlea | Male-type | 0.635 (0.521, 0.750) | 0.776 | No |
| Head | Male-type | 0.909 (0.713, 1.106) | 0.676 | Yes |
| Sustentaculum | Male-type | 0.908 (0.660, 1.155) | 0.484 | No |
| Calcaneal | Female-type | 0.966 (0.782, 1.150) | 0.747 | Yes |
| Head articular unit | Male-type | 0.761 (0.615, 0.907) | 0.744 | No |
| Trochlea articular unit | Mixed (mainly male) | 0.738 (0.617, 0.858) | 0.815 | No |
| Subtalar joint functional unit | Mixed | 0.840 (0.703, 0.976) | 0.817 | Yes |
| Homo sapiens | ||||
| Trochlea | Male-type | 0.682 (0.621, 0.743) | 0.888 | No |
| Head | Male-type | 0.717 (0.644, 0.791) | 0.855 | No |
| Sustentaculum | Male-type | 0.625 (0.521, 0.729) | 0.615 | No |
| Calcaneal | Female-type | 0.626 (0.560, 0.692) | 0.845 | No |
| Head articular unit | Male-type | 0.670 (0.604, 0.737) | 0.863 | No |
| Trochlea articular unit | Mixed (mainly male) | 0.667 (0.606, 0.728) | 0.883 | No |
| Subtalar joint functional unit | Mixed | 0.596 (0.530, 0.661) | 0.831 | Yes (negative allometry) |
Inter-specific regression of head facet surface area against mean CS3 returned a scaling exponent of 0.654 (Fig. 5A, Table 2). Regression against mean species body mass returned a slightly higher exponent of 0.741 (Table 2). In both cases the 95% CI included isometric scaling (Table 2). Inter-specific regression of sustentaculum facet area against mean CS3 returned a scaling exponent of 0.744 (Fig. 5B, Table 2). Regression against means species body mass returned an exponent of 0.841 (Table 2). In both cases the 95% CI included the possibility of isometric scaling (Table 2). Intra-specifically, head and, in particular, sustentaculum facet regression models lack reliability, as indicated by their low R2 values and wide 95% CI (Table 3). Isometric scaling relative to centroid size was nevertheless rejected for the head facet in favour of negative allometric scaling in gorillas and in favour of positive allometric scaling in chimpanzees (Table 3).
Fig. 5.
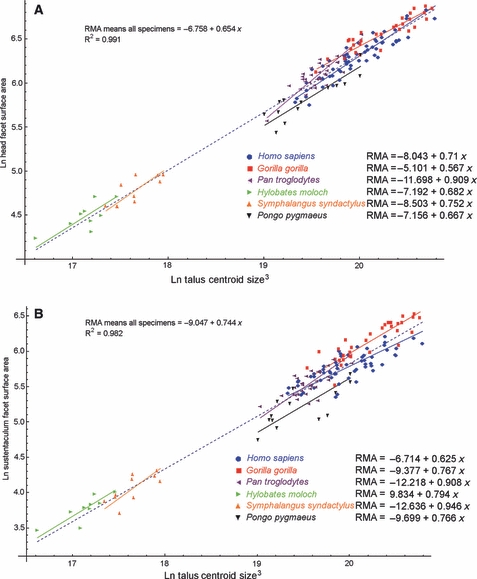
Scatterplots of: (A) ln-transformed head facet surface area against ln-transformed cubed astragalus centroid size (CS3); (B) ln-transformed sustentaculum facet surface area against ln-transformed cubed astragalus centroid size (CS3). The inter-specific regression models are shown by the dashed blue lines. Intra-specific regression models are shown by the solid colour-coded lines.
Inter-specific regression of calcaneal facet surface area against mean CS3 returned a scaling exponent of 0.782 (Fig. 6, Table 2). Regression against mean species body mass returned a scaling exponent of 0.886 (Table 2). In both cases the 95% CI did not include the value of 0.67 indicative of isometric scaling (Table 2). This suggests that the calcaneal facet surface area scales inter-specifically with positive allometry. Intra-specifically, scaling exponents for the calcaneal facet are generally high relative to those of other facets, with the exception of the calcaneal facet in humans (Homo sapiens), where it is relatively low (Table 3). Although 95% CIs are relatively wide throughout, isometric scaling relative to centroid size is rejected in favour of positive allometry in gorillas and chimpanzees (Table 3).
Fig. 6.
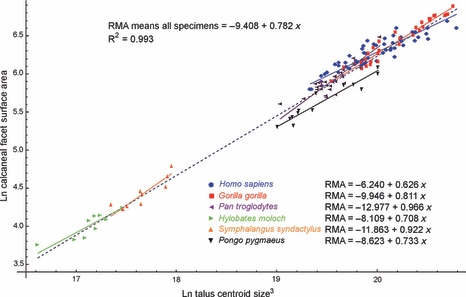
Scatterplot of ln-transformed calcaneal facet surface area against ln-transformed body mass proxy (cubed astragalus centroid size). The inter-specific regression model is shown by the dashed blue line. Intra-specific regression models are shown by the solid colour-coded lines.
Combined facet areas
Head, calcaneo-navicular ligament facet and sustentaculum facets together form a discrete articular unit defined by sharing the same synovial capsule. Trochlea, medial and lateral articular facets form another such unit (Gray, 1989; Lewis, 1989). Inter-specific regression of head articular unit and of trochlea articular unit against mean CS3 returned scaling exponents of 0.673 and 0.657, respectively (Fig. 7, Table 2). Regressions against mean species body mass returned scaling exponents of 0.762 and 0.746, respectively (Table 2). For both articular units, the 95% CIs included the scaling exponent of 0.67 expected for isometric scaling for regressions against CS3 and body mass (Table 2). Intra-specifically, scaling exponents for both units are variable and do not appear to follow any clear pattern, but the 95% CIs generally do not exclude isometric scaling, except for the trochlea articular unit in Pongo pygmaeus, where isometry is rejected in favour of positive allometry (Table 3).
Fig. 7.
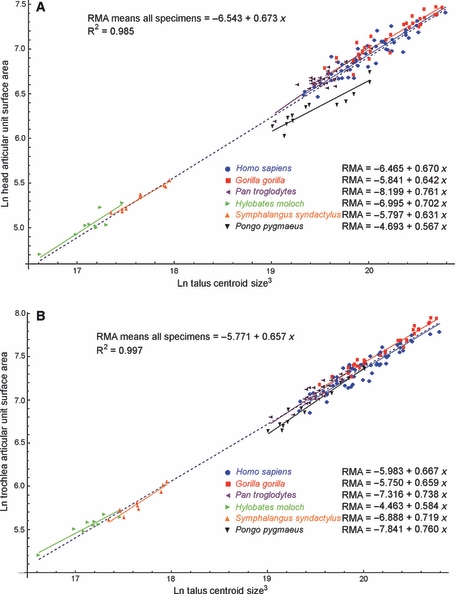
Scatterplots of: (A) ln-transformed surface area of the head articular unit (head, sustentaculum and calcaneo-navicular ligament facets combined); (B) ln-transformed surface area of trochlea articular unit (trochlea, medial and lateral facets combined) against ln-transformed cubed centroid size (CS3). The inter-specific regression models are shown by the dashed blue lines. Intra-specific regression models are shown by the solid colour-coded lines.
The calcaneal (posterior plantar) and sustentaculum facets together constitute the talar facets of the subtalar joint. These facets can therefore be thought of as a functional unit (Fig. 2C) in that their morphology is likely to be co-dependent. Inter-specific regression of combined sustentaculum and calcaneal facets against CS3 returned a scaling exponent of 0.766 (Fig. 8, Table 2). Regression against mean species body mass returned a scaling exponent of 0.867 (Table 2). In the regression against body mass, the 95% CI did not include the scaling value of 0.67 and isometric scaling was rejected in favour of positive allometry. Intra-specifically, scaling exponents for subtalar joint unit articular surface areas against CS3 are mostly high, and with CIs that do not exclude isometric scaling. The exceptions are the gorilla, where isometric scaling was rejected in favour of positive allometry, and the scaling exponent of 0.596 in Homo sapiens, which represents one of the lowest values of any facet or combined facet area and for which isometric scaling was rejected in favour of negative allometry (Table 3).
Fig. 8.
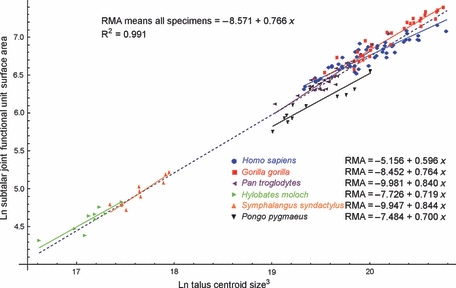
Scatterplot of ln-transformed combined surface areas of calcaneal and sustentaculum facets against ln-transformed cubed centroid size (CS3). The inter-specific regression model is shown by the dashed blue line. Intra-specific regression models are shown by the solid colour-coded lines.
Residual values derived from the inter-specific regression models of articular facet area against body mass for all articular facet and combined articular facet surface areas are listed in Table 4. Modern humans stand out as having the highest positive residual values for all individual and combined articular facet areas, whereas orang-utans have low negative residual values throughout, with the exception of the trochlea facet (Table 4).
Table 4.
Articular facet area and combined articular facet residual values for individual species, derived from the scaling models of facet areas relative to body mass described in Table 2
| Facet | H. moloch | S. syndactylus | P. pygmaeus | G. gorilla | P. troglodytes | H. sapiens |
|---|---|---|---|---|---|---|
| Trochlea | 0.0897 | −0.133 | −0.0541 | −0.1277 | 0.0164 | 0.2086 |
| Head | 0.0897 | −0.0878 | −0.2756 | −0.0574 | 0.1359 | 0.1952 |
| Sustentaculum | 0.1298 | −0.0961 | −0.3354 | 0.0278 | 0.1112 | 0.1628 |
| Calcaneal | 0.0568 | −0.0513 | −0.2674 | −0.1063 | 0.1008 | 0.2674 |
| Head articular unit | 0.1026 | −0.0780 | −0.3592 | −0.0630 | 0.1505 | 0.2471 |
| Trochlea articular unit | 0.0891 | −0.1171 | −0.1620 | −0.0869 | 0.0891 | 0.1803 |
| Subtalar joint functional unit | 0.0857 | −0.0711 | −0.2945 | −0.0526 | 0.1044 | 0.2281 |
Using the regression of centroid size against body mass, the mean fossil specimen body mass estimates were 66.6 kg for the Clarke Howell OMO Homo sapiens specimen, 68.1 and 112.3 kg for the EM 3519 and SP4B Homo neanderthalensis specimens, respectively, 31.4 kg for the AL-288 Australopithecus afarensis specimen, 37.8 kg for OH-8, 63.5 kg for KNM-ER 1464 and 47.9 kg for KNM-ER 1476 (Table 5).
Table 5.
Mean estimates and 95% confidence intervals of body mass in fossil hominins based on regression models for talus centroid size and individual and combined talar articular facets
| Species and fossil specimen numbers | |||||||
|---|---|---|---|---|---|---|---|
| Homo sapiens | Homo neanderthalensis | Australopithecine or early Homo | Australopithecus afarensis | ||||
| Regression model | Clarke Howell OMO | EM 3519 (Tabun C1) | SP4B (Spy 2) | KNM-ER 1464 | KNM-ER 1476 | OH-8 | AL-288 |
| Talus centroid size | 66.57 (168.07, 31.86) | 68.09 (172.35, 32.52) | 112.33 (302.07, 51.26) | 63.51 (159.44, 30.53) | 47.88 (116.16, 23.61) | 37.84 (89.22, 19.06) | 31.41 (72.42, 16.10) |
| Trochlea facet | 72.54 (165.64, 39.97) | 76.24 (175.75, 41.72) | 139.65 (361.75, 70.25) | 74.60 (171.25, 40.95) | 49.32 (104.54, 28.68) | 46.13 (96.53, 27.07) | 37.09 (74.43, 22.44) |
| Head facet | 78.69 (252.84, 36.78) | 69.27 (215.13, 33.11) | 113.25 (401.10, 49.68) | 74.22 (234.81, 35.05) | 26.21 (62.76, 14.84) | 48.79 (137.98, 24.79) | 36.25 (94.66, 19.39) |
| Sustentaculum facet | 82.28 (304.09, 36.21) | 61.59 (208.91, 28.61) | 76.10 (274.84, 33.98) | 75.78 (273.32, 33.87) | 49.9 (159.03, 24.11) | 56.70 (187.69, 26.75) | 38.73 (114.49, 19.61) |
| Calcaneal facet | 96.91 (361.64, 42.02) | 85.26 (306.63, 37.84) | 114.91 (450.35, 48.30) | 78.43 (275.37, 35.35) | 65.68 (219.14, 30.58) | 32.46 (88.42, 17.19) | 41.90 (122.83, 21.18) |
| Trochlea articular unit | 71.10 (169.46, 38.36) | 65.13 (152.49, 35.59) | 136.08 (370.19, 66.83) | 70.57 (167.93, 38.11) | 49.67 (110.05, 28.22) | 44.40 (96.15, 25.64) | 30.53 (61.26, 18.61) |
| Head articular unit | 76.63 (355.80, 31.18) | 68.50 (305.72, 28.53) | 100.16 (511.3, 38.56) | 68.80 (307.48, 28.63) | 36.72 (131.43, 17.40) | 49.14 (194.99, 21.93) | 33.17 (114.51, 16.05) |
| Subtalar joint unit | 91.24 (325.80, 40.44) | 75.95 (257.52, 34.79) | 99.75 (365.23, 43.50) | 77.39 (263.81, 35.33) | 59.73 (188.04, 28.45) | 41.75 (119.58, 21.30) | 40.61 (115.42, 20.83) |
Using the regressions of species mean facet surface areas against body mass, the ranges of mean fossil body mass estimates were 71.1–82.3 kg for the Clarke Howell OMO Homo sapiens specimen, 61.6–82.4 and 100.2–140.7 kg for the EM 3519 and SP4B Homo neanderthalensis specimens, respectively, 30.5–43.6 kg for the AL-288 Australopithecus afarensis specimen, 44.4–56.7 kg for OH-8, 68.8–80.8 kg for KNM-ER 1464 and 49.7–56.0 kg for KNM-ER 1476 (Table 5). Means for body mass estimates were: Homo sapiens, Clarke Howell OMO, 77.5 kg; Homo neanderthalensis, EM 3519, 69.4 kg, SP4B, 130.0 kg; Australopithecus afarensis, AL-288, 36.4 kg, OH-8, 50.4 kg, KNM-ER 1464, 74.0 kg, KNM-ER 1476, 51.9 kg.
Discussion
Centroid size and body mass
Regression of sex-specific mean species centroid sizes against sex-specific mean species body mass resulted in a very good fit (R2 = 0.978) and a mean estimated scaling exponent that is slightly higher than, and statistically significantly different from, 1 (an exponent of 1 indicating isometry). A closer look at the intra-specific relationship between talus size and body mass reveals a pattern whereby the talus would appear to scale isometrically or with slight negative allometry across the sexes in the great apes (Pongo, Pan and Gorilla), whereas in the Hylobatidae (gibbons and siamangs) and modern humans it would appear to scale with clearly positive allometry (Fig. 3). This suggests that in the Hylobatidae and humans either the males have tali that are over-scaled (larger than expected for their body mass) or that females have tali that are under-scaled (smaller than expected for their body mass). Hylobatidae and humans also have in common that their evolutionary history likely saw a reduction in sexual size dimorphism (Plavcan, 2001). In humans, the talus as well as the foot as a whole is known to mature relatively early, with rates of foot growth decreasing rapidly after the age of 12 in girls and 14 in boys (Scheuer & Black, 2000), whereas many skeletal dimensions related to overall stature and post-cranial robusticity grow for substantially longer (Humphrey, 1998). More specifically, epiphyseal fusion in the talus is reported to take place around 9 years of age in girls and 12 years of age in boys (Scheuer & Black, 2000). Foot size as a whole, and talar size in particular, may therefore become under-scaled in females if a reduction in sexual body mass dimorphism within a species is achieved primarily through increased duration of female growth or through increased rate of female growth, if that increase in rate takes place after termination of growth in the foot or talus. In terms of scaling patterns between talus size and body mass in the present sample, this would imply that rather than male Homo sapiens tali being over-scaled, modern humans as a whole should be considered to have larger than expected tali, potentially as a consequence of being bipedal, with the pattern less evident in female Homo sapiens due to evolutionary constraints on relative patterns of maturation. Interestingly, the same observation of apparent strong positive allometric scaling between female and male Homo sapiens was made for the articular head of the femur (Fig. 2 in Ruff, 1988). Future work on intra-specific scaling patterns of early maturing skeletal elements relative to body mass may provide interesting insights into the evolution of sexual size dimorphism and may contribute to existing debates on levels of sexual size dimorphism in extinct taxa (e.g. Reno et al. 2003, 2005; Plavcan et al. 2005). With respect to the use of talus centroid size as a proxy for body mass, we conclude that centroid size, as quantified here, is likely to be a reasonable, if not perfect, proxy for body mass, but that caution is needed when interpreting intra-specific scaling patterns in that scaling patterns between elements of talus morphology and talus centroid size cannot be taken to mirror scaling patterns between the same elements of talus morphology and body mass.
Inter-specific scaling
Inter-specifically, the subtalar joint unit and the calcaneal and sustentaculum facet areas of which the unit is composed, returned the highest scaling exponents when scaled against cubed centroid size and when scaled against body mass (Table 2). The null hypothesis of isometric scaling with body mass was only rejected at the 95% confidence level for the calcaneal facet and the subtalar joint functional unit, of which the calcaneal facet is the main component (Table 2). As the calcaneal facet is concave, or of the female-type, we can reject the hypothesis that only convex, or male-type, articular facets would deviate from isometric scaling. The positive allometry of the calcaneal facet surface area may be the result of differences in locomotor adaptation between the species in the sample and, as such, emphasises that calcaneal facet morphology may be affected by differences in locomotor adaptation. Although female-type articular surfaces are not expected to vary in line with degrees of mobility in hinge-like or ball-and-socket type joints, they may vary in line with levels of mobility in joints where a degree of translation takes place between opposing pairs of articular surface areas, such as in the subtalar joint. In the present sample, the distribution of residual values (Table 4) indicates that the calcaneal facet is particularly over-scaled in modern humans. The increased area of human calcaneal articular surfaces is likely due to the loading pattern that is characteristic of modern human bipedal locomotion (Parr, 2009). Non-human apes maintain their subtalar joints in either everted or inverted configurations throughout the stance phase, which is reflected in a ‘bean’-shaped calcaneal facet, as the central area is rarely loaded and, hence, not developed (Lewis, 1989; Gebo, 1992; Vereecke et al. 2003, 2004, 2005; Wang & Crompton, 2004; Gebo & Schwartz, 2006; Crompton et al. 2008; Parr, 2009). In contrast, humans load the calcaneal articulation as it moves from everted to inverted configurations at the beginning and through the middle of the stance phase (Nigg et al. 1993; Pohl et al. 2007). This loads the central facet area, which consequently is expanded (Wang et al. 1995; Parr, 2009). The morphology of the subtalar joint functional unit, including the relative size of its components, is likely linked to the degree of mobility of the subtalar joint, as the degree of subtalar joint mobility is known to vary in apes and even between different fossil hominids (Lewis, 1989; Gebo, 1992). We can conclude that female-type, concave articular surface areas may also reflect functional differences between species and, as a result, scale non-isometrically with body mass.
The male-type, convex trochlea, head and sustentaculum facets along with the trochlea and head articular units all have surface areas for which isometric scaling cannot be rejected when scaled against either centroid size or body mass. The isometric scaling of the trochlea, head and sustentaculum facets is in line with Alexander's (1980) model of geometric similarity. This, however, was not necessarily expected; as male-type articular surfaces they should reflect inter-specific differences in joint mobility (Godfrey et al. 1991; Hamrick, 1996). In this respect, isometric scaling of these facets may be particularly surprising given the relatively diverse range of locomotion present in the sample, ranging from fully arboreal brachiators (gibbons and siamangs) to fully terrestrial bipeds (humans), and including largely arboreal (orang-utans) and partially arboreal (chimpanzees and gorillas) primates in between.
Several early studies reported that the stresses, measured as force per unit area, experienced by articulations are similar across different types of joints as well as across different species of vertebrates (Alexander, 1980; Simon, 1970; Walker & Hajek, 1972; Walker, 1977). Consequently, Alexander (1980, 1981) implied that articular surface areas should scale with geometric similarity (isometry) relative to body mass, a prediction that was mainly confirmed by later studies (Ruff, 1988; Godfrey et al. 1991; Jungers, 1991; Hamrick, 1996). The main variable in determining articular surface area should then be locomotor adaptation or joint mobility (Rafferty & Ruff, 1994) and some deviations from isometric scaling have also emerged. Most notably, limb articular surface areas were reported to scale with positive allometry in anthropoids (Swartz, 1989), an observation that was later interpreted as reflecting differences in positional behaviour between species that vary along with body mass (Godfrey et al. 1991). Thus, deviations from a model of isometric scaling can be interpreted in terms of differences in locomotor or postural behaviour.
There does seem to be an effect on articular area scaling where locomotor adaptation affects load distribution in an extreme way, such as through the difference between quadrupedal and bipedal locomotion. Hence, both loading regime and mobility may influence relative articular area in both convex and concave facets and the details are likely to be specific to each articular surface area. While this may prevent the formulation of a general rule of articular surface area scaling as has been sought in the past, it also increases the potential for a more detailed interpretation of locomotor adaptation in extinct species.
The distinct over-scaling of all talar articular surface areas in Homo sapiens and the similarly distinct under-scaling of all articular surface areas except for the trochlea facet in Pongo pygmaeus (Table 4) illustrates the effect of locomotor adaptation and associated loads on articular surface morphology. As a result of obligate bipedalism, the lower limbs in modern humans have to sustain higher loads than the hind limbs of quadrupedal or brachiating species. This is in line with earlier findings where femoral head diameters in humans were shown to be over-scaled relative to those of other apes and one or two species of cercopithecoids (Ruff, 1988; Jungers, 1991). It is interesting to note that, in contrast, the articular surface areas of more arboreal taxa (e.g. Pongo) do not appear to be relatively larger, as might be expected in a more mobile and arboreally adapted foot, but, in Pongo, are reduced in surface area. Articular surface areas in the orang-utan, as by far the most arboreal of the great apes, would have been predicted to be larger than expected, reflecting greater mobility, at least in male-type articulations. That this is not the case may be due to the lower levels of loading of the hind limb reported for this taxon (Kimura et al. 1979; Sugardjito, 1982; Cant, 1985; Reynolds, 1985; Thorpe & Crompton, 2006; Crompton et al. 2008), an explanation in line with Ruff's (1987, 1988) interpretation of smaller than expected diaphyseal, but similar to expected femoral head dimensions in the hind limbs of orang-utans. Overall these findings stress the importance of understanding the function of individual articular surface areas before drawing general conclusions about scaling patterns and their biomechanical implications.
Intra-specific scaling
As is the case for inter-specific data, all facet areas scale intra-specifically with talus size. The majority of exponents appear to suggest positive allometric scaling, but with a few exceptions the confidence intervals of the regression models include isometry (Table 3). All but two of the statistically significant deviations from isometric scaling with talus centroid size reject isometry in favour of positive allometry, but no clear pattern emerges from the data. A number of intra-specific scaling models are statistically not particularly well constrained, as indicated by lower R2 values (Table 3), suggesting a large amount of intra-specific variability in articular facet surface areas. High intra-specific variability may be the result of differences in activity levels between individuals of the same species. While it has been shown experimentally that different exercise regimes have no significant effect on the size of articular surface areas in sheep (Lieberman et al. 2001), other studies have also shown that differences in activity levels can influence the overall dimensions of postcranial bones both at an individual (Lieberman et al. 2001; Umemura et al. 2002) as well as at a micro-evolutionary level (Kelly et al. 2006). As we regressed articular surface areas against talus centroid size intra-specifically, differences in overall talus size, and therefore talus centroid size, related to differences in activity level might have contributed to levels of intra-specific variability.
In orang-utans, the trochlea and the trochlea functional unit scale with positive allometry relative to centroid size. In gorillas, the calcaneal facet and the subtalar joint unit scale with positive allometry and the head facet with negative allometry. In chimpanzees, calcaneal and head facets and the subtalar joint unit scale with positive allometry relative to centroid size. Divergence from isometric scaling may be expected where sexual size dimorphism is such that it results in substantial sexual differences in locomotor patterns. However, if size-related differences in locomotor patterns are reflected in increased arboreality in the lighter females, as hypothesised, we would expect isometry to be rejected in favour of negative allometry, as the more mobile females should have relatively larger articular surface areas. This is clearly not the case for the trochlea in orang-utans, or for the calcaneal facet and subtalar joint unit in gorillas. Similarly, the positive allometric scaling seen in the head facet, calcaneal facet and subtalar joint unit in chimpanzees is unlikely to be caused by differences in level or type of arboreality between males and females. Negative allometric scaling in the head facet in gorillas, on the other hand, may reflect such differences, but it seems unlikely that the negative allometric scaling of the subtalar joint functional unit in humans would be due to differences in locomotor patterns.
Apart from sex-specific differences in locomotor patterns, differences in ontogenetic trajectories between the sexes may be responsible for deviations from isometric scaling, and this may be the case in humans, where the subtalar joint unit was found to scale with negative allometry relative to talus centroid size (Table 3). Negative allometry implies either that the larger individuals have articular facet areas that are under-scaled or that the smaller individuals have articular surface areas that are over-scaled. In the case of modern humans, the subtalar joint unit of smaller individuals may simply appear to be larger than expected relative to centroid size because, in smaller individuals, centroid size is smaller than expected relative to body mass (see Fig. 3 and discussion of centroid size and body mass above). It is noteworthy, however, that the same effect is not seen in any of the other articular facet areas of modern human tali. It is possible that the shape and size of the subtalar joint unit in humans is more directly determined by function than is the shape and size of other articular facet areas, and that fully adult function is achieved before the main divergence of growth trajectories between males and females. A strong element of functional determination of subtalar joint unit morphology is also indicated by the positive allometric scaling of the calcaneal articular facet area in inter-specific analyses as discussed above (Table 2).
Body mass estimates of fossil specimens
Using a modern comparative sample representative of a range of locomotor adaptations may be problematic when the aim is to infer body mass in fossil specimens based on elements of postcranial morphology. However, where the locomotor modes once adopted by those fossils are unknown, there is little in the way of alternatives. In such a case it is preferable, at least on theoretical grounds, to rely on comparative models of scaling relationships whose scalars are as close as possible to isometric. In the cases explored here, of talar centroid size and of articular surface areas in the talus, all inter-specific scaling relationships with body mass suggested some degree of positive allometry, although for all but three relationships (centroid size, calcaneal facet, subtalar joint unit), the possibility of isometric scaling was contained within the 95% confidence intervals (Table 2). The resulting estimates of fossil body mass have the wide confidence intervals that tend to be characteristic of such analyses and should be treated with caution (Table 5). Some interesting observations can nevertheless be made. First, limiting consideration to the two models with scalars that are closest to isometric (the trochlea articular unit and the head facet), all our mean estimates are somewhat higher than the mean estimates of previous studies, although most of them are contained within the range of previous estimates where these are available (Table 6). Secondly, the strongest divergence between our estimate and previous estimates concerns the Spy 2 Neanderthal where our mean estimate was 118 kg compared to a previous estimate of 82 kg based on femoral diameters (Kappelman, 1996). Both observations can be explained within the context of our comparative models. As we have discussed above, modern humans have tali that are generally over-scaled relative to those of other apes. This is most likely the result of the increased load that they have to sustain as the result of bipedal locomotion. We can therefore expect that a hominoid comparative model of the talus will tend to overestimate body mass even in a partial biped. This is in line with the observation that, of all the measurements used to infer body mass in AL-288 by McHenry (1992), the talus measurement resulted in the highest estimate of body mass when based on a hominoid model. Also, the combined observations that human talus centroid size is substantially more over-scaled relative to the hominoid model in males than it is in females (Fig. 3) and that talar articular facets in humans scale essentially isometrically with centroid size (except for the subtalar joint functional unit; Table 3), imply that overestimation of body mass should be most pronounced in individuals that followed a modern human type of locomotion and that were male, assuming similar patterns of foot growth and maturation as in modern humans. This likely explains the apparent pattern of overestimation seen in our data, as the Spy 2 Neandertal is widely considered to have been male (whereas the other Neandertal in our sample, Tabun C1, is considered to have been female) (e.g. Trinkaus, 1983; Ruff et al. 1993). When inferring body mass in a fossil individual for whom locomotor adaptation is known with some degree of certainty, the most reliable approach may be to select the model for which the closest living equivalent has the lowest residual value. For modern humans which, within the context of a hominoid model, provide a good modern analogue for the Neandertals, the lowest residual value was found for the model based on the sustentaculum facet (Table 4). Using that model results in mean body mass estimates of 62 and 76 kg, respectively, for Tabun C1 and Spy 2 (Table 5).
Table 6.
Mean estimates and range of mean estimates of body mass in fossil hominins derived from different regression models. The mean and range values for this study are based on the trochlea articular unit and the head facet regression models as these were the models that scaled closest to isometry and can therefore be considered the least affected by differences in locomotor adaptation within the modern comparative sample
| Mean and range of mean (in brackets) estimates of body mass (kg) | |||
|---|---|---|---|
| Species | Specimen | This study (trochlea articular unit and head facet) | Previous studies |
| Homo sapiens | Clarke Howell OMO | 74 (71.1–76.6) | N/A |
| Homo neanderthalensis | EM 3519 (Tabun C1) | 67 (65.1–68.5) | 56* |
| SP4B (Spy 2) | 118 (100.2–136.0) | 82* | |
| Australopithecine or early Homo | KNM-ER 1464 | 70 (68.8–70.6) | 63 (48.7–76.3)** |
| KNM-ER 1476 | 43 (36.7–49.7) | 39 (31.8–45.7)** | |
| OH-8 | 47 (44.4–49.1) | 37 (30.9–44.0)** | |
| Australopithecus afarensis | AL-288 | 33 (30.5–36.3) | 27 (12.3–36.9)** |
Kappelman (1996), based on femoral head diameter.
McHenry (1992), based on RMA regression models for both ‘All Hominoidea’ and ‘Homo sapiens’.
Conclusions
Based on the theoretical predictions made by Alexander (1980) and empirical studies by other authors (Swartz, 1989; Godfrey et al. 1991; Hamrick, 1996; Ruff, 2003), we hypothesised that inter-specific scaling exponents for ‘female’-type (concave) articular facet surface areas in the talus of hominoid primates would scale isometrically with body mass and that ‘male’-type articular facets might scale with positive or negative allometry, reflecting differences in mobility between species with different locomotor strategies. Instead we found that the articular facets for which the 95% CI of the estimated scaling exponent included isometry were the trochlea, head and sustentaculum articular facets (all male-types), while the female-type calcaneal articular facet scaled with positive allometry.
At the intra-specific level, we expected articular surface areas to scale with similar scaling exponents across species and facets, with the exception of male-type articular facet areas in species where a substantial degree of sexual body mass dimorphism may be reflected in differences in locomotor strategies. However, no clear pattern emerged due to the generally high intra-specific variability in articular surface areas that resulted in a lower reliability (lower R2-values) of the linear scaling models and wider confidence intervals of estimated scaling exponents, when compared to the inter-specific models. Interestingly, the subtalar joint unit area in Homo sapiens was found to scale with negative allometry. This may be due to a combination of modern human specific growth trajectories (in particular the timing of the divergence in growth trajectories between males and females) and a particularly strong functional component in determining subtalar joint morphology.
We conclude that there are no clear generalised scaling rules for articular surface areas relative to body mass in the talus of hominoid primates. We suspect that this may also be the case in other taxonomic groups and in other parts of the skeleton, with the possible exception of female-type articular surface areas in simple hinge-like, or ball-and-socket types of articulations. Instead, scaling properties of articular surface areas are likely to be highly context-specific. While this implies difficulties when trying to infer body mass from the size of articular surface areas, it also promises new avenues for inferring detailed patterns of mobility and locomotor function in extinct species.
Acknowledgments
We are grateful to Jonathan Krieger and John Haight for help with mathematica, and for making available and allowing adaptation of their personal programming codes. We thank Norman Macleod for access to the NHM's Konica Minolta scanner and the following curators and their institutions for access to material: Jack Ashby, Marc Carnall and Gillie Newman, Grant Museum of Zoology, UCL; Charles Lockwood, Department of Anthropology, UCL; Malgosia Kemp, Oxford Museum of Natural History; Ray Symmonds, Cambridge Museum of Zoology; Richard Kraft and Mike Schweissing, Zoologische Staatssammlung München; Malcolm Harman, Powell Cotton Museum, Kent; Paula Jenkins, Daphne Hills and Louise Tomsett, Department of Zoology, NHM, London; Robert Kruszynski and Margaret Clegg, Department of Palaeontology, NHM, London. Financial support to William Parr came from NERC (Award no: NER/S/A/2004/12187) with additional funding through a CASE award from the NHM, London, and recently Andrew and Helen Parr. This paper greatly benefited from suggestions made by Dan Lieberman and two anonymous reviewers.
Author contributions
W.C.H.P. conceived of the study, undertook all data collection and analyses, and prepared the manuscript. H.J.C. and C.S. participated in data interpretation and manuscript preparation and oversaw supervision of the research. All authors have approved the final article.
References
- Alexander RM. Forces in animal joints. Engg Med. 1980;9:93–97. [Google Scholar]
- Alexander RM. Analysis of force platform data to obtain joint forces. In: Dowson D, Wright V, editors. An Introduction to the Biomechanics of Joints and Joint Replacements. London: Mechanical Engineering Publishers, Ltd; 1981. pp. 30–35. [Google Scholar]
- Besl PJ, McKay ND. A method for registration of 3-D shapes. IEEE Trans Pattern Anal Mach Intell. 1992;14:239–256. [Google Scholar]
- Cant JGH. Locomotor and postural behavior of orangutan (Pongo pygmaeus) in Borneo and Sumatra. Am J Phys Anthropol. 1985;66:153. [Google Scholar]
- Crompton RH, Vereecke EE, Thorpe SKS. Locomotion and posture from the common hominoid ancestor to fully modern hominins, with special reference to the last common panin/hominin ancestor. J Anat. 2008;212:501–543. doi: 10.1111/j.1469-7580.2008.00870.x. [DOI] [PMC free article] [PubMed] [Google Scholar]
- Dagosto M, Terranova CJ. Estimating the body size of eocene primates: a comparison of results from dental and postcranial variables. Int J Primatol. 1992;13:3. [Google Scholar]
- Feibel CS, Brown FH, McDougall I. Stratigraphic context of fossil hominids from the OMO group deposits – Northern Turkana basin, Kenya and Ethiopia. Am J Phys Anthropol. 1989;78:595–622. doi: 10.1002/ajpa.1330780412. [DOI] [PubMed] [Google Scholar]
- Gebo DL. Plantigrady and foot adaptation in African Apes – implications for hominid origins. Am J Phys Anthropol. 1992;89:29–58. doi: 10.1002/ajpa.1330890105. [DOI] [PubMed] [Google Scholar]
- Gebo DL, Schwartz GT. Foot bones from Omo: implications for hominid evolution. Am J Phys Anthropol. 2006;129:499–511. doi: 10.1002/ajpa.20320. [DOI] [PubMed] [Google Scholar]
- Godfrey L, Sutherland M, Boy D, et al. Scaling of limb joint surface-areas in anthropoid primates and other mammals. J Zool. 1991;223:603–625. [Google Scholar]
- Gower JC. Generalized procrustes analysis. Psychometrika. 1975;40:33–51. [Google Scholar]
- Gray H. Gray's Anatomy. New York: Churchill Livingstone Inc; 1989. [Google Scholar]
- Grün R, Stringer C. Tabun revisited: revised ESR chronology and new ESR and U-series analyses of dental material from Tabun C1. J Hum Evol. 2000;39:601–612. doi: 10.1006/jhev.2000.0443. [DOI] [PubMed] [Google Scholar]
- Hamrick MW. Articular size and curvature as determinants of carpal joint mobility and stability in strepsirhine primates. J Morphol. 1996;230:113–127. doi: 10.1002/(SICI)1097-4687(199611)230:2<113::AID-JMOR1>3.0.CO;2-I. [DOI] [PubMed] [Google Scholar]
- Holloway RL. Within-species brain-body weight variability – A re-examination of the Danish data and other primate species. Am J Phys Anthropol. 1980;53:109–121. doi: 10.1002/ajpa.1330530115. [DOI] [PubMed] [Google Scholar]
- Humphrey LT. Growth patterns in the modern human skeleton. Am J Phys Anthropol. 1998;105:57–72. doi: 10.1002/(SICI)1096-8644(199801)105:1<57::AID-AJPA6>3.0.CO;2-A. [DOI] [PubMed] [Google Scholar]
- INUS Technology. Rapidform 2006. Seoul, Korea: Inus Technology Inc. & RapidForm Inc; 2006. [Google Scholar]
- Jungers WL. Scaling of postcranial joint size in hominoid primates. Hum Evol. 1991;6:391–399. [Google Scholar]
- Jungers WL, Harcourt-Smith WEH, Wunderlich RE, et al. The foot of Homo floresiensis. Nature. 2009;459:81–84. doi: 10.1038/nature07989. [DOI] [PubMed] [Google Scholar]
- Kappelman J. The evolution of body mass and relative brain size in fossil hominids. J Hum Evol. 1996;30:243–276. [Google Scholar]
- Kelly SA, Czech PP, Wight JT, et al. Experimental evolution and phenotypic plasticity of hindlimb bones in high-activity house mice. J Morphol. 2006;267:360–374. doi: 10.1002/jmor.10407. [DOI] [PubMed] [Google Scholar]
- Kimura T, Okada M, Ishida H. Kinesiological characteristics of primate walking: its significance in human walking. In: Morbeck ME, Preuschoft H, Gomberg N, editors. Environment, Behavior, and Morphology: Dynamic Interactions in Primates. New York: Gustav Fischer; 1979. pp. 297–311. [Google Scholar]
- Lewis OJ. Functional Morphology of the Evolving Hand and Foot. Oxford: Clarendon Press; 1989. [Google Scholar]
- Lieberman DE, Devlin MJ, Pearson OM. Articular area responses to mechanical loading: effects of exercise, age, and skeletal location. Am J Phys Anthropol. 2001;116:266–277. doi: 10.1002/ajpa.1123. [DOI] [PubMed] [Google Scholar]
- McDougall I, Brown FH, Fleagle JG. Stratigraphic placement and age of modern humans from Kibish, Ethiopia. Nature. 2005;433:733–736. doi: 10.1038/nature03258. [DOI] [PubMed] [Google Scholar]
- McHenry HM. Body size and proportions in early hominids. Am J Phys Anthropol. 1992;87:407–431. doi: 10.1002/ajpa.1330870404. [DOI] [PubMed] [Google Scholar]
- Minolta. Vivid 910 non-contact 3D digitizer specifications. 2006. http://www.konicaminolta.com/instruments/products/3d/non-contact/vivid910/specifications.html.
- Nigg BM, Cole GK, Nachbauer W. Effects of arch height of the foot on angular motion of the lower extremities in running. J Biomech. 1993;26:909–916. doi: 10.1016/0021-9290(93)90053-h. [DOI] [PubMed] [Google Scholar]
- Parr WCH. Evolutionary and Functional Anatomy of the Hominoid Astragalus – New Approaches Using Laser Scanning Technologies and 3D Analyses. UCL, University of London; 2009. PhD thesis. [Google Scholar]
- Pearson OM, Royer DF, Grine FE, et al. A description of the Omo I postcranial skeleton, including newly discovered fossils. J Hum Evol. 2008;55:421–437. doi: 10.1016/j.jhevol.2008.05.018. [DOI] [PubMed] [Google Scholar]
- Plavcan MJ. Sexual dimorphism in primate evolution. Yearb Phys Anthropol. 2001;44:25–53. doi: 10.1002/ajpa.10011.abs. [DOI] [PubMed] [Google Scholar]
- Plavcan JM, Lockwood CA, Kimbel WH, et al. Sexual dimorphism in Australopithecus afarensis revisited: How strong is the case for a humanlike pattern of dimorphism? J Hum Evol. 2005;48:313–320. doi: 10.1016/j.jhevol.2004.09.006. [DOI] [PubMed] [Google Scholar]
- Pohl MB, Messenger N, Buckley JG. Forefoot, rearfoot and shank coupling: effect of variations in speed and mode of gait. Gait Posture. 2007;25:295–302. doi: 10.1016/j.gaitpost.2006.04.012. [DOI] [PubMed] [Google Scholar]
- Polly PD. Adaptive zones and the pinniped ankle. A three dimensional quantitative analysis of carnivoran tarsal evolution. In: Sargis M, Dagosto EA, editors. Mammalian Evolutionary Morphology: A Tribute to Frederick S. Szalay. New York: Kluwer/Plenum; 2008. pp. 167–196. [Google Scholar]
- Radin EL, Orr RB, Kelman JL, et al. Effect of prolonged walking on concrete on the knees of sheep. J Biomech. 1982;15:487–492. doi: 10.1016/0021-9290(82)90002-1. [DOI] [PubMed] [Google Scholar]
- Rafferty KL, Ruff CB. Articular structure and function in Hylobates, Colobus, and Papio. Am J Phys Anthropol. 1994;94:395–408. doi: 10.1002/ajpa.1330940308. [DOI] [PubMed] [Google Scholar]
- Razdan A, Bae MS. A hybrid approach to feature segmentation of triangle meshes. Comput-Aided Des. 2003;35:783–789. [Google Scholar]
- Reno PL, Meindl RS, McCollum MA, et al. Sexual dimorphism in Australopithecus afarensis was similar to that of modern humans. Proc Natl Acad Sci U S A. 2003;100:9404–9409. doi: 10.1073/pnas.1133180100. [DOI] [PMC free article] [PubMed] [Google Scholar]
- Reno PL, Meindl RS, McCollum MA, et al. The case is unchanged and remains robust: Australopithecus afarensis exhibits only moderate skeletal dimorphism. A reply to Plavcan et al. (2005) J Hum Evol. 2005;49:279–288. doi: 10.1016/j.jhevol.2005.04.008. [DOI] [PubMed] [Google Scholar]
- Reynolds TR. Stresses on the limbs of quadrupedal primates. Am J Phys Anthropol. 1985;67:351–362. doi: 10.1002/ajpa.1330670407. [DOI] [PubMed] [Google Scholar]
- Rohlf FJ, Slice D. Extensions of the Procrustes method for the optimal superimposition of landmarks. Syst Zool. 1990;39:40–59. [Google Scholar]
- Ruff CB. Structural allometry of the femur and tibia in Hominoidea and Macaca. Folia Primatol. 1987;48:9–49. doi: 10.1159/000156283. [DOI] [PubMed] [Google Scholar]
- Ruff CB. Hindlimb articular surface allometry in Hominoidea and Macaca, with comparisons to diaphyseal scaling. J Hum Evol. 1988;17:687–714. [Google Scholar]
- Ruff CB. Long bone articular and diaphyseal structure in old world monkeys and apes. II: Estimation of body mass. Am J Phys Anthropol. 2003;120:16–37. doi: 10.1002/ajpa.10118. [DOI] [PubMed] [Google Scholar]
- Ruff CB, Runestad JA. Primate limb bone structural adaptations. Ann Rev Anthropol. 1992;21:407–433. [Google Scholar]
- Ruff CB, Trinkaus E, Walker A, et al. Postcranial robusticity in Homo. I: Temporal trends and mechanical interpretation. Am J Phys Anthropol. 1993;91:21–53. doi: 10.1002/ajpa.1330910103. [DOI] [PubMed] [Google Scholar]
- Scheuer L, Black S. Developmental Juvenile Osteology. London: Academic Press Ltd; 2000. [Google Scholar]
- Simon MH. Scale effects in animal joints. Arthritis Rheum. 1970;13:244–255. doi: 10.1002/art.1780130305. [DOI] [PubMed] [Google Scholar]
- Smith RJ, Jungers WL. Body mass in comparative primatology. J Hum Evol. 1997;32:523–559. doi: 10.1006/jhev.1996.0122. [DOI] [PubMed] [Google Scholar]
- Stringer C. Human evolution: out of Ethiopia. Nature. 2003;423:692–695. doi: 10.1038/423692a. [DOI] [PubMed] [Google Scholar]
- Sugardjito J. Locomotor behavior of the Sumatran orangutan (Pongo pygmaeus abellii) at Ketambr, Gunung Leuser National Park. Malayan Nat J. 1982;35:57–64. [Google Scholar]
- Swartz SM. The functional-morphology of weight bearing – Limb joint surface area allometry in anthropoid primates. J Zool. 1989;218:441–460. [Google Scholar]
- Thorpe SKS, Crompton RH. Orangutan positional behavior and the nature of arboreal locomotion in Hominoidea. Am J Phys Anthropol. 2006;131:384–401. doi: 10.1002/ajpa.20422. [DOI] [PubMed] [Google Scholar]
- Tocheri MW. Arizona State University; 2007. Three-Dimensional Riddles of the Radial Wrist: Derived Carpal and Carpometacarpal Joint Morphology in the genus Homo and the implications for understanding the evolution of stone-related behaviours in hominins. PhD thesis. [Google Scholar]
- Tocheri MW, Marzke MW, Liu D, et al. Functional capabilities of modern and fossil hominid hands: three-dimensional analysis of trapezia. Am J Phys Anthropol. 2003;122:101–112. doi: 10.1002/ajpa.10235. [DOI] [PubMed] [Google Scholar]
- Tocheri MW, Razdan A, Williams RC, et al. A 3D quantitative comparison of trapezium and trapezoid relative articular and nonarticular surface areas in modern humans and great apes. J Hum Evol. 2005;49:570–586. doi: 10.1016/j.jhevol.2005.06.005. [DOI] [PubMed] [Google Scholar]
- Tocheri MW, Orr CM, Larson SG, et al. The primitive wrist of Homo floresiensis and its implications for hominin evolution. Science. 2007;317:1743–1745. doi: 10.1126/science.1147143. [DOI] [PubMed] [Google Scholar]
- Trinkaus E. The Shanidar Neandertals. New York: Academic Press; 1983. [Google Scholar]
- Umemura Y, Baylink DJ, Wergedal JE, et al. A time course of bone response to jump exercise in C57BL/6J mice. J Bone Miner Metab. 2002;20:209–215. doi: 10.1007/s007740200030. [DOI] [PubMed] [Google Scholar]
- Vereecke E, D'Aout K, De Clercq D, et al. Dynamic plantar pressure distribution during terrestrial locomotion of bonobos (Pan paniscus) Am J Phys Anthropol. 2003;120:373–383. doi: 10.1002/ajpa.10163. [DOI] [PubMed] [Google Scholar]
- Vereecke E, D'Aout K, De Clercq D, et al. The relationship between speed, contact time and peak plantar pressure in terrestrial walking of bonobos. Folia Primatol. 2004;75:266–278. doi: 10.1159/000078938. [DOI] [PubMed] [Google Scholar]
- Vereecke E, D'Aout K, Van Elsacker L, et al. Functional analysis of the gibbon foot during terrestrial bipedal walking: plantar pressure distributions and three-dimensional ground reaction forces. Am J Phys Anthropol. 2005;128:659–669. doi: 10.1002/ajpa.20158. [DOI] [PubMed] [Google Scholar]
- Walker PS. Human Joints and Their Artificial Replacements. Springfield: C. C. Thomas; 1977. [Google Scholar]
- Walker PS, Hajek JV. The load-bearing area in the knee joint. J Biomech. 1972;5:581–589. doi: 10.1016/0021-9290(72)90030-9. [DOI] [PubMed] [Google Scholar]
- Walter RC. Age of Lucy and the 1st family – Single crystal Ar-40/Ar-39 dating of the Denen Dora and lower Kada Hadar members of the Hadar formation, Ethiopia. Geology. 1994;22:6–10. [Google Scholar]
- Wang WJ, Crompton RH. Analysis of the human and ape foot during bipedal standing with implications for the evolution of the foot. J Biomech. 2004;37:1831–1836. doi: 10.1016/j.jbiomech.2004.02.036. [DOI] [PubMed] [Google Scholar]
- Wang CL, Cheng CK, Chen CW, et al. Contact areas and pressure distributions in the subtalar joint. J Biomech. 1995;28:269–279. doi: 10.1016/0021-9290(94)00076-g. [DOI] [PubMed] [Google Scholar]
- Wolfram Research Inc. Mathematica, Version 6.0. Champaign, IL: Wolfram Research Inc; 2007. [Google Scholar]
- Wood BA. Origin and evolution of the genus Homo. Nature. 1992;355:783–790. doi: 10.1038/355783a0. [DOI] [PubMed] [Google Scholar]