

Abstract
Knowledge of the reproducibility of striatal [11C]raclopride (RAC) binding is important for studies that use RAC PET paradigms to estimate changes in striatal dopamine during pharmacological and cognitive challenges. To our knowledge, no baseline test-retest data exist for nontreatment-seeking alcoholics (NTS). We determined the test-retest reproducibility of baseline RAC binding potential (BPND) in twelve male NTS subjects. Subjects were scanned twice with single-bolus RAC PET on separate days. Striatal RAC binding potential (BPND) for left and right dorsal caudate, dorsal putamen, and ventral striatum was estimated using the Multilinear Reference Tissue Method (MRTM) and Logan Graphical Analysis with a reference region (LGA). Test-retest variability (TRV), % change in BPND between scan days, and the intraclass correlation coefficient (ICC) were used as metrics of reproducibility. For MRTM, TRV for striatal RAC binding in NTS subjects was ± 6.5%, and ± 7.1% for LGA. Average striatal ICCs were 0.94 for both methods (p < 0.0001). Striatal BPND values were similar to those reported previously for detoxified alcoholics. The results demonstrate that baseline striatal RAC binding is highly reproducible in NTS subjects, with a low variance similar to that reported for healthy control subjects.
Keywords: D2 receptor, positron emission tomography, dopamine, nicotine, craving, striatum
INTRODUCTION
[11C]Raclopride (RAC) is a D2/D3 antagonist that is routinely used in positron emission tomography studies to estimate striatal D2/D3 receptor availability. This radioligand is sensitive to competition by endogenous striatal dopamine (Dewar et al., 1989; Seeman et al., 1989; Young et al., 1991), and is commonly used in paradigms that assess relative changes in dopamine concentration in response to pharmacological or cognitive paradigms (for review, see Egerton et al., 2009; Laruelle, 2000). Accurate and reproducible measurement of “baseline” D2/D3 availability is therefore crucial for a proper interpretation of such studies (Yoder et al., 2008). Moreover, knowledge of the within-subject variance of a population aids in power analyses and guides study design for paradigms in which the effect size of the dopaminergic challenge may be relatively small. The reliability of baseline striatal RAC measurements with single bolus protocols has been demonstrated for healthy control subjects in several small (Hietala et al., 1999; Volkow et al., 1993) and moderately sized studies (Hirvonen et al., 2003; Schlosser et al., 1998). Although both the methods for determining binding availability and the metrics used to gauge reproducibility vary across studies, estimates typically range between ~ ± 5–10%.
However, it cannot be assumed that populations with psychiatric and/or neurological disorders will exhibit the same stability of RAC binding as healthy controls. Regardless of the method used to assess RAC binding, D2/D3 availability is invariably a function of both number of receptors and the presence of endogenous dopamine. We recently observed that, even in control subjects, variance in ‘resting state’ D2/D3 availability can be accounted for by tracking other variables. (Yoder et al., 2008). For example, apparent differences in baseline cognitive states caused large sample variations in striatal D2/D3 availability – up to almost 20% between baseline conditions. This is an important consideration when there is a distinct possibility that striatal dopamine may frequently change as a consequence of subjective states such as expectation or craving (Brody et al., 2006; Brody et al., 2004; Volkow et al., 2006; Wong et al., 2006; Yoder et al., 2008) Our laboratory is currently studying several dopaminergic challenge paradigms in nontreatment-seeking alcoholics. This subject group presents unique challenge, as the majority of such individuals are chronic smokers (Meyerhoff et al., 2006; Room, 2004). If subjects in nicotine withdrawal crave a cigarette, this could conceivably alter the dopaminergic state (Brody et al., 2006; Brody et al., 2004; Volkow et al., 2006; Wong et al., 2006). Here, we sought to determine the test-retest reproducibility of baseline RAC binding availability in nontreatment-seeking alcoholics in whom nicotine levels were controlled across scans.
MATERIALS & METHODS
Subjects
All procedures were approved by the Indiana University Institutional Review Board. Informed consent for participation for this study was obtained only after confirmation that breath alcohol concentration (BrAC) was 0 mg%. Twelve male nontreatment-seeking alcoholics (NTS) participated. Subjects were right-handed cigarette smokers with a family history of alcoholism, defined as having at least 2 or more primary or secondary relatives identified by the Family History Assessment Module (Rice et al., 1995) that had at least 3 “yes” answers on the Individual Assessment Module. NTS subjects met DSM-IV criteria for alcohol dependence as determined by the Semi-Structured Assessment for the Genetics of Alcoholism (Bucholz et al., 1994; Hesselbrock et al., 1999; NIAAA, 2003). Subjects had neither received treatment for alcohol use disorders (AUD) within the past year, nor were they actively seeking treatment. Demographic and drinking characteristics are presented in Table 1.
Table 1.
Subject demographic and drinking characteristics.
| n | Race | Ethnicity | Age (years) | Education (years) | D/DDay | D/Wk | D/Mon |
|---|---|---|---|---|---|---|---|
| 12 | 3 C | 12 NHL | 39.3 ± 10.0 (23–54) | 12.1 ± 0.79 (11–14) | 10.3 ± 3.11 (5.51–15.7) | 46.9 ± 23.8 (21.0–95.2) | 201 ±102 (90–238) |
| 9 AA |
Top row is mean ± s.d.; bottom row is data range. C: caucasian. AA: African-American. NHL: Not Hispanic or Latino. D/DDay: drinks per drinking day. D/Wk: drinks per week. D/Mon: drinks per month.
Study Procedures
Subjects underwent identical procedures on two separate days. A typical study-day timeline is presented in Figure 1. Briefly, subjects presented to the Indiana Clinical Research Center at approximately 8 a.m. BrAC measurements were taken to ensure BrAC = 0 mg%. An IV catheter was placed in an antecubital vein. Subjects were given a full breakfast. The Clinical Withdrawal Assessment for Alcohol, Revised (CIWA-Ar; Sullivan et al., 1989), Alcohol Urge Questionnaire (AUQ; Bohn et al., 1995), and Cigarette Withdrawal Scale (CWS; Etter, 2005) were given periodically throughout each study day. The AUQ and CWS are both self-report Likert rating scales. The AUQ is 8 items, with a 7-point scale for each item (score range = 7–56). Nicotine craving was measured with the second dimension on the CWS, which specifically captures the individual’s current subjective state of cigarette craving. There are 4 questions on this dimension, each with a 5-point scale; possible scores for cigarette craving range from 4 - 20. Ratings were taken upon arrival for the study (Time 1), and before and after the resting (baseline) scan (Times 2 and 3). The CIWA-Ar was administered by study personnel with a score of < 8 required for study participation.
Figure 1.

General outline of study protocol. Typically, the magnetic resonance image (MRI) was acquired on Day 1. BrAC: breath alcohol concentration. RAC: [11C]raclopride positron emission tomography scan. Ratings were taken upon arrival, and before and after the resting (baseline) RAC scan.
To control for both dosage and timing of last exposure to alcohol, all subjects received an IV alcohol infusion to a target of 60 mg% using the Alcohol Clamp Technique (O'Connor et al., 1998; Ramchandani et al., 1999). During the infusion, subjects were in a reclined position on a hospital bed. Target BrAC was achieved over a “ramp” period of 15 minutes, then “clamped” at target for 30 min.
To avoid this potential confound of nicotine withdrawal or cigarette craving on repeated measurements of baseline D2 receptor availability (Brody et al., 2006; Brody et al., 2004; Volkow et al., 2006; Wong et al., 2006), transdermal nicotine patches were placed on the subjects shortly after arrival. Patch dose was based on self-reported number of cigarettes smoked per day.
Scanning Procedures
A magnetization prepared rapid gradient echo (MP-RAGE) magnetic resonance image (MRI) was acquire on all subjects using a Siemens 3T Trio for anatomic co-registration of PET data (see “Image Processing Procedures”).
Subjects received two baseline [11C]raclopride (RAC) scans in the early afternoon on two separate days. Time of injection was typically between 14:00 and 15:00. BrAC was 0 mg% prior to scanning. RAC synthesis was completed as described previously (Fei et al., 2004). RAC PET scans were acquired on a Siemens EXACT HR+ (3D mode; septa retracted). Prior to each PET scan, a 10-min transmission scan using three internal rod sources was acquired for attenuation correction. RAC PET scans were initiated with the IV infusion of 14.0 ± 1.46 mCi [11C]RAC (mass dose: 0.14 ± 0.07 nmol/kg) over 1.5 min. Dynamic acquisition occurred for 50 min.
Image Processing Procedures
Image processing is similar to that described previously (Yoder et al., 2007; Yoder et al., 2008; Yoder et al., 2009). MRI DICOM and RAC PET images were converted to Neuroimaging Informatics Technology Initiative (NIfTI) format (http://nifti.nimh.nih.gov/) using SPM5 (http://www.fil.ion.ucl.ac.uk/spm/). For each subject, all dynamic PET data were co-registered to an early-time mean image to facilitate motion correction. The early mean PET image was co-registered to the MRI scan using the normalized mutal information algorithm in SPM5, with the transformation matrix from this co-registration subsequently applied to the motion-corrected dynamic PET data. Each subject’s MRI was spatially normalized to Montreal Neurological Institute (MNI) space. The transformation matrix obtained from the spatial normalization step was then applied to the motion-corrected, MRI-registered PET data from each subject.
Region of Interest Analysis
All regions of interest (ROIs) were drawn on an average normalized MRI from all subjects, using MRIcron (http://www.sph.sc.edu/comd/rorden/mricron/). Striatal regions of interest (ROIs) consisted of the left and right ventral striatum (VST), dorsal caudate (DCA), and dorsal putamen (DPU), and were drawn according to anatomic landmarks described previously (Mawlawi et al., 2001). The DCA ROI contains the pre- and post-commissural caudate as described in Martinez (2003); the DPU contains the pre- and post-commissural putamen. For the reference region (tissue that contains little to no D2/D3 receptor density), an ROI was created that contained all cerebellar gray matter except for the vermis. Time-activity curves for each ROI were generated from the dynamic RAC data using the MarsBaR toolbox for SPM5 (http://marsbar.sourceforge.net/). For each striatal ROI, D2/D3 receptor availability was indexed with BPND, the binding potential of [11C]raclopride calculated as bound tracer concentration relative to nondisplaceable tracer concentration (Innis et al., 2007). Estimations of BPND were conducted using the multilinear reference tissue model (MRTM; Ichise et al., 2003) and Logan reference region graphical analysis (LGA, Logan et al., 1996). All Logan plots were linear.
Metrics of Test-Retest Reproducibility of Baseline RAC binding
The relative reproducibility of striatal BPND between Day 1 and Day 2 was examined with three calculations, test-retest variability (TRV), percent change in BPND (ΔBPND), and the intraclass correlation coefficient (one-way random effects model) as implemented in the PASW statistical package (McGraw and Wong, 1996; Shrout and Fleiss, 1979). TRV was calculated as: (Hirvonen et al., 2003; Mawlawi et al., 2001). ΔBP between Day 1 and Day 2 was calculated as: .
Parametric Images for SPM analysis
BPND was estimated at each voxel throughout the brain using the multilinear reference tissue method with a common reference region efflux rate to facilitate robust performance on noisy voxel data (MRTM2) (Ichise et al., 2003). The resulting parametric BPND images were smoothed with an 8mm Gaussian kernel (Costes et al., 2005; Picard et al., 2006; Ziolko et al., 2006). The search area for the voxel-wise paired t-tests was restricted to the striatum, as (1) our sole focus was the striatum, and (2) the striatum has the highest density of D2/D3 receptors in the brain, and is the only brain structure with high enough signal-to-noise ratio to support quantification of D2/D3 receptor availability with RAC. A bilateral striatal binary mask was created on an average image of all subjects’ raw parametric images by excluding any BPND values less than one. Striatal ΔBP images were generated (that is, ΔBP at each voxel within the striatal mask), and one-sample t-tests were used in SPM5 to test the null hypothesis that ΔBP = 0. Specifically, model contrasts were ΔBP > 0 and ΔBP < 0. The statistical threshold was set at p < 0.05, two-tailed (i.e., p < 0.025 for each contrast).
Other Statistical Tests
Independent t-tests were used to test for differences in injected radioactivity and injected mass dose between scan days. To examine the stability of cigarette craving (CWS dimension 2 score), alcohol craving (AUQ), and alcohol withdrawal (CIWA-Ar), repeated-measures ANOVA was used to test for effects of scan day, time point, and day*time point. Paired t-tests were used to determine if striatal BPND scores were significantly different between scan days. Spearman’s correlation coefficient was used to assess whether number of days between scans was associated with the absolute value of ΔBPND (days-between-scan data were non-normally distributed). Pearson’s correlation coefficient was used to (1) determine how similar estimates of BPND for the ROI data were between MRTM and LGA, and (2) compare the relative performance of MRTM and LGA with respect to TRV.
Statistical tests were conducted with Microsoft Excel 2007 and PASW Statistics 17 and 18.
RESULTS
RAC Scan Parameters
Average number of days between scans was 8.83 ± 14.8 (range: 1–45 days). Injected radioactivity of RAC on Day 1 and Day 2 was 13.7 ± 1.82 and 14.2 ± 0.98 mCi, respectively. Corresponding mass doses were 0.15 ± 0.07 and 0.13 ± 0.06 nmol/kg. Injected radioactivity and mass doses were not significantly different between scan days.
Subject Data
The demographic and drinking characteristics of the subjects are shown in Table 1. Although every effort was made to screen out potential polysubstance users at the screening visit, four subjects had positive urine drug screens on one or both scan days. One subject tested positive for opiates on both scan days (self-report was of a few days’ use of painkillers for a neck injury); one tested positive for cocaine on both scan days (subject denied “intentional” use of illicit drugs), one tested positive for cannabis use on both scan days, and another tested positive for cannabis use on the first scan day only (the latter two subjects endorsed infrequent use of marijuana). None of these subjects were apparent outliers in the dataset in any respect, and all four subjects had test-retest variability of striatal RAC binding equal to or below that of the sample average (see below; < 6.5%).
Exact timing of patch placement was not available for two subjects on Day 1. Across the remaining data points (n = 22), the interval between patch placement and resting scan was 5.9 ± 0.6 hours. Ratings for CWS, AUQ, and CIWA-Ar were unavailable for one subject at Day 1, Time 3, and for another subject on Day 2, Time 3. Results from the repeated-measures ANOVAs indicated that all three ratings were stable within subjects (i.e., there were no effects of day, timepoint, or interactions of day*timepoint). Cigarette and alcohol craving scores are presented in Figures 2 and 3. Subjects reported very few acute alcohol withdrawal symptoms (Figure 4). The range of CIWA-Ar scores was 0–3; out of 70 measurements, a score of 2 was given five times; the score of 3 was observed on three occasions.
Figure 2.

Mean ± s.d. cigarette craving ratings from Day 1 (filled circles) and Day 2 (open triangles). The x-axis crosses the y-axis at the value of 4 to denote that 4 is the lowest possible score on the index; for reference, 20 is the highest possible score. Craving ratings did not vary within subjects across either day or time point (see text for details).
Figure 3.

Mean ± s.d. alcohol craving score from the Alcohol Urge Questionnaire (AUQ) from Day 1 (filled circles) and Day 2 (open triangles). The x-axis crosses the y-axis at the value of 7 to denote that 7 is the lowest possible score on the index; for reference, 56 is the highest possible score. Craving ratings did not vary within subjects across either day or time point (see text for details).
Figure 4.

Mean + s.d. CIWA-Ar ratings (for graphical clarity, only positive s.d. is shown) from Day 1 (filled squares) and Day 2 (open diamonds). CIWA-Ar score did not vary within subjects across either day or time point (see text for details). In this protocol, a score of ≥8 would require a subject to be withdrawn from the study to receive immediate medical attention for alcohol withdrawal symptoms.
Test-Retest Reproducibility of Resting RAC Signal
BPND values for both scan days, percent change of BPND between days (%Δ), the test-retest variability (TRV), and intra-class correlation coefficients (ICC) are presented in Table 2 (MRTM) and Table 3 (LGA). For both MRTM and Logan, the average striatal ICC values were very high. The observed striatal RAC BPND values are very similar to BPF values reported previously for detoxified alcoholics in RAC single-bolus protocols with arterial sampling (Volkow et al., 1996; Volkow et al., 2002; Volkow et al., 2007), but slightly higher than BPND reported for detoxified alcoholics in a RAC bolus-infusion paradigm (see Table 3 from Martinez et al., 2005). There was no association between number of days between scans and the absolute value of ΔBP in any ROI (i.e., length of days between scans did not contribute to observed variability).
Table 2.
Test-retest data from resting [11C]raclopride (RAC) scans in 12 nontreatment-seeking alcoholics.
| BPND estimated with MRTM | |||||
|---|---|---|---|---|---|
| Region | BPND Day 1 | BPND Day 2 | % Δ | %TRV | ICC† |
| L DCA | 2.02 ± 0.41 | 2.01 ± 0.46 | −0.46 ± 9.76 | 6.27 ± 6.63 | 0.93 |
| R DCA | 2.08 ± 0.40 | 2.02 ± 0.49 | −3.80 ± 9.67 | 8.54 ± 6.86 | 0.93 |
| L DPU | 2.88 ± 0.33 | 2.89 ± 0.31 | 0.64 ± 6.5 | 5.56 ± 2.77 | 0.85 |
| R DPU | 2.81 ± 0.35 | 2.79 ± 0.34 | −0.48 ± 5.31 | 4.23 ± 3.07 | 0.92 |
| L VST | 2.32 ± 0.36 | 2.26 ± 0.29 | −1.87 ± 10.4 | 8.02 ± 5.93 | 0.79 |
| R VST | 2.29 ± 0.38 | 2.18 ± 0.34‡ | −4.65 ± 5.92 | 6.17 ± 4.84 | 0.89 |
| STRIATUM* | 2.40 ± 0.49 | 2.36 ± 0.51 | −1.77 ± 8.13 | 6.46 ± 5.29 | 0.94 |
All ICC were statistically significant, p < 0.0001, except for L VST (p < 0.001)
BPND values for R VST were significantly different between scan days, p < 0.05
Data are averaged across 6 striatal regions in 12 subjects (n = 72)
See Methods section for details. BPND: RAC binding potential estimated with MRTM. % Δ: percent change in BPND from Day 1. %TRV: test-rest variability. ICC: intraclass correlation coefficient. L: left. R: right. DCA: dorsal caudate. DPU: dorsal putamen. VST: ventral striatum. Data are mean ± s.d.
Table 3.
Test-retest data from resting [11C]raclopride (RAC) scans in 12 nontreatment-seeking alcoholics.
| BPND estimated with LGA | |||||
|---|---|---|---|---|---|
| Region | BPND Day 1 | BPND Day 2 | % Δ | %TRV | ICC† |
| L DCA | 1.95 ± 0.41 | 1.96 ± 0.45 | 0.01 ± 8.69 | 6.06 ± 5.40 | 0.95 |
| R DCA | 2.03 ± 0.40 | 1.94 ± 0.50 | −5.20 ± 11.8 | 10.9 ± 8.52 | 0.89 |
| L DPU | 2.84 ± 0.32 | 2.83 ± 0.31 | −0.25 ± 5.95 | 4.82 ± 3.12 | 0.87 |
| R DPU | 2.75 ± 0.35 | 2.74 ± 0.35 | −0.25 ± 5.31 | 4.43 ± 2.72 | 0.92 |
| L VST | 2.24 ± 0.35 | 2.18 ± 0.29 | −1.73 ± 11.8 | 7.72 ± 7.60 | 0.78 |
| R VST | 2.18 ± 0.37 | 2.07 ± 0.33‡ | −4.50 ± 8.64 | 8.64 ± 4.88 | 0.84 |
| STRIATUM* | 2.33 ± 0.50 | 2.29 ± 0.52 | −1.98 ± 8.98 | 7.10 ± 6.02 | 0.94 |
All ICC were statistically significant, p < 0.0001, except for L VST (p < 0.001)
BPND values for R VST were different at trend-level significance, p = 0.06
Data are averaged across 6 striatal regions in 12 subjects (n = 72)
See Methods section for details. BPND: RAC binding potential estimated with LGA. %Δ: percent change in BPND from Day 1. %TRV: test-rest variability. ICC: intraclass correlation coefficient. L: left. R: right. DCA: dorsal caudate. DPU: dorsal putamen. VST: ventral striatum. Data are mean ± s.d.
Overall, there were no overt differences between MRTM and LGA performance. As expected, estimates of BPND from these methods are highly correlated (Figure 5). MRTM and LGA had very similar values for the test-retest metrics (Tables 2 and 3). Although MRTM and LGA are statistically identical with respect to observed TRV across regions, Figure 6 suggests that relative TRV is not entirely consistent between estimation schemes. However, the fact that MRTM and LGA produce statistically identical TRVs indicates that test-retest metrics should not be a deciding factor in selection of one method over another.
Figure 5.

BPND values from MRTM and LGA are highly correlated. The regression line (solid) almost overlaps with the line of identity (dashed). Pearson’s correlation coefficient and the significance value are denoted within the graph.
Figure 6.

Test-retest variability (TRV) from MRTM plotted against TRV from LGA. The regression line (solid) deviates from the line of identity (dashed), but Pearson’s correlation coefficient is still highly statistically significant (inset).
SPM Analysis
In general, the SPM analysis agreed with the ROI analyses. BPND was slightly lower in the right ventral striatum on Day 2 (Figure 7). The SPM analysis also picked up lower BPND on Day 2 in an area that overlapped the left posterior lateral putamen (data not shown). The majority of this cluster was outside the anatomical boundary of the putamen, and thus the cluster was considered to be an artifact.
Figure 7.
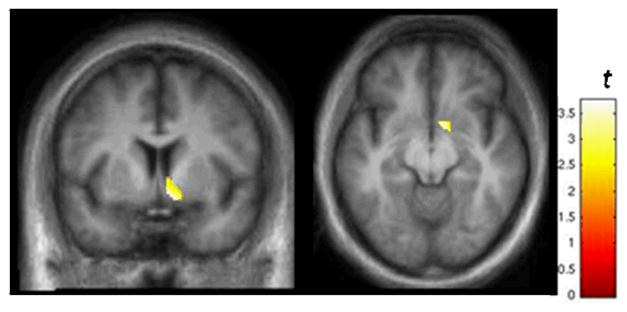
Results from SPM analysis illustrating voxels in the right VST where BPND was lower on Day 2 relative to Day 1. Display threshold: p < 0.025. See text for details. The average % ΔBPND of the voxels in this cluster was −11.7 ± 10.3%. These results are consistent with the data in Table 2.
DISCUSSION
This study is the first to report the test-retest reproducibility of resting (baseline) striatal [11C]raclopride binding availability in nontreatment-seeking alcoholics under conditions designed to control for the potential confound of cigarette craving on endogenous dopamine. The results demonstrate excellent test-retest variability (~ 6.5–7.1%). Overall, the reproducibility in striatal BPND in nontreatment-seeking alcoholics is commensurate with that reported for single-bolus [11C]raclopride studies in healthy control subjects (Hietala et al., 1999; Hirvonen et al., 2003; Schlosser et al., 1998; Volkow et al., 1993).
Controlling for cognitive and physiological factors that may influence “baseline” RAC binding is critical for PET studies in which dopaminergic responses to pharmacological or cognitive challenges are being examined (Egerton et al., 2009; Yoder et al., 2008). In populations such as alcoholics, in whom smoking rates are high, it will be important to stabilize nicotine withdrawal/cigarette craving, which is likely to affect endogenous striatal dopamine (Brody et al., 2006; Brody et al., 2004). In this study, we found that use of nicotine patches was effective in controlling cigarette craving during the course of the study in NTS subjects. Given that (a) the test-retest reproducibility of striatal RAC binding availability in NTS was very similar to that of control subjects, and (b) the NTS striatal BPND values are comparable to those from detoxified alcoholics, transdermal nicotine delivery does not seem to have any adverse affect on obtaining a stable striatal BPND, and thus seems to be a reasonable approach for controlling cigarette craving during dopamine challenge paradigms.
The ROI data revealed two unexpected findings. First, in this NTS sample, the rank order of BPND across striatal regions is unusual. Typically, the DPU has the highest D2/D3 availability in the striatum, followed by the DCA, and finally, the VST. This is true for control samples, and even in detoxified alcoholics (Martinez et al., 2005). In our sample, BPND was higher in the VST than in the DCA. To explore this further, we estimated BPND for pre- and post-commissural caudate (Martinez et al., 2003) to determine if either or both of these subdivisions contributed to the anomaly. The typical rank order of the caudate subdivisions and VST is: preDCA > VST > postCA. The rank order in the NTS sample is of the ROIs here is VST > preDCA > postCA (Table 4). Visual comparisons of the caudate ROIs with each individual’s spatially normalized MRI did not give any indication that a partial volume effect would account for this effect. At this time, it is not known whether this observation is unique to this sample, or whether NTS subjects have lower BPND in the pre-commissural dorsal caudate relative to controls (or even treatment-seeking alcoholic populations). To address this, we are currently conducting a study within a much larger sample of controls and NTS subjects.
Table 4.
BPND values for NTS subjects on Day 1 and Day 2.
| Day 1 | Day 2 | |
|---|---|---|
| VST | 2.30 ± 0.36 | 2.22 ± 0.31 |
| preDCA | 2.11 ± 0.43 | 2.07 ± 0.50 |
| postCA | 1.74 ± 0.30 | 1.74 ± 0.36 |
VST: ventral striatum. PostCA: post-commissural caudate (postCA). PreDCA: pre-commissural dorsal caudate. BPND was estimated with MRTM; values from left and right regions were not significantly different (paired t-test), and were averaged.
The second unexpected effect was that, in the right VST, BPND was relatively lower on Day 2 than on Day 1. This effect was statistically significant for MRTM data, and trend-level for LGA. For both ROI methods, the % ΔBPND was about -4.5%, which is below the average TRV reported here for these subjects. These results were echoed in the SPM analysis. However, it should be noted that the statistical threshold for the SPM analysis was extremely low (p < 0.025, uncorrected). This apparent effect was greatly diminished at p < 0.01, and did not survive the more stringent threshold of p < 0.005 (data not shown). The cause of this putative effect in the right VST is not known at this time. This finding helps illustrate the importance of TRV metrics when interpreting data in which changes in BPND are modest (i.e., below test-retest thresholds).
A limitation of this study was the absence of test-retest values for striatal RAC binding in NTS subjects without nicotine patches, which would have assessed any variability in baseline striatal BPND attributable to nicotine withdrawal. However, the most important assumption in a typical dopaminergic RAC PET challenge paradigm is that the within-subject state of basal dopamine is stable. Thus, instead of directly studying the amount of variance that would occur in NTS subjects undergoing nicotine withdrawal, we elected to proactively control for the potential (and likely highly variable) influence of cigarette craving on endogenous striatal dopamine. An added benefit of this approach is that use of nicotine patches helps ensure subject comfort and study compliance.
There is evidence in both human and animal studies that acute withdrawal from alcohol dependence causes decreases in basal striatal dopamine release (Ebert et al., 2002; Weiss et al., 1996). Although NTS subjects did not report many symptoms associated with alcohol withdrawal, we cannot exclude the possibility that subtle physiological effects of alcohol withdrawal after the low-dose morning alcohol infusion contributed to the observed variance in test-retest reproducibility. Conversely, we also do not know how variable baseline D2/D3 availability would be in NTS subjects had we not explicitly controlled for last time and dose of alcohol. Future studies in NTS subjects will be necessary to understand the effects of alcohol withdrawal on the dopamine system.
Finally, several reports have documented that detoxified alcohol-dependent subjects have relatively lower striatal D2/D3 availability compared to control subjects (Martinez et al., 2005; Volkow et al., 1996; Volkow et al., 2002). Although our BPND values from NTS subjects are similar to data for detoxified alcoholic populations, we cannot make statements about whether the NTS sample shares this deficit. An ongoing parallel study with smoking controls will soon allow us to directly test this hypothesis.
In this study, we controlled for two factors that presumably could cause variability in baseline measurements of [11C]raclopride binding, specifically, nicotine craving/withdrawal and alcohol withdrawal. However, there are many reasons why the types of interventions utilized herein (nicotine patches, low-dose IV alcohol infusion) may not be desirable or even feasible. For example, subject safety is always the first priority. If a RAC scan paradigm is being used to test for dopaminergic effects of a drug, all potential pharmacological interactions between the drug and e.g., nicotine and/or alcohol need to be considered carefully. Some cognitive or motor paradigms may require that subjects be completely nicotine-free (even if this results in nicotine craving/withdrawal). Alternatively, depending on the experimental setting and population being tested, it simply may not be practical to administer alcohol, and/or nicotine patches to smokers. Thus, optimal controls for variability in dopamine tone may not always be possible. However, non-pharmacological methods that may assist in explaining variance in the data should be considered.
In summary, we report excellent test-retest stability of baseline striatal [11C]raclopride binding availability in nontreatment-seeking alcoholics. Test-retest metrics were well within the range of what has been reported for healthy control subjects. Additionally, the BPND values in our NTS sample are similar to previous data in detoxified alcoholics. These data suggest that it is feasible to conduct dopaminergic challenge studies in this population with RAC PET.
Acknowledgments
Supported by ABMRF/The Foundation for Alcohol Research (KKY), NIAAA P60 AA007611 (pilot P:50, KKY), and the Indiana CTSI, Clinical Research Center, UL RR025761. The authors would like to thank Dr. Marc Normandin for implementation of the MRTM and LGA models; Drs. Evan Morris and Normandin for helpful theoretical discussion; Dr. Mario Dzemidzic for assistance in MRI sequence development and quality control, and Dr. Dena Davidson for aid in establishing subject safety protocols. Michele Beal and Courtney Robbins provided support for MRI acquisition, and Barbara Glick-Wilson and Brandon Steele for assisted with radioligand synthesis. Cari Cox and Dennise Garzon provided expertise for the alcohol infusion paradigm and subject recruitment.
References
- Bohn MJ, Krahn DD, Staehler BA. Development and initial validation of a measure of drinking urges in abstinent alcoholics. Alcohol Clin Exp Res. 1995;19(3):600–606. doi: 10.1111/j.1530-0277.1995.tb01554.x. [DOI] [PubMed] [Google Scholar]
- Brody AL, Mandelkern MA, Olmstead RE, Scheibal D, Hahn E, Shiraga S, Zamora-Paja E, Farahi J, Saxena S, London ED, McCracken JT. Gene variants of brain dopamine pathways and smoking-induced dopamine release in the ventral caudate/nucleus accumbens. Arch Gen Psychiatry. 2006;63(7):808–816. doi: 10.1001/archpsyc.63.7.808. [DOI] [PMC free article] [PubMed] [Google Scholar]
- Brody AL, Olmstead RE, London ED, Farahi J, Meyer JH, Grossman P, Lee GS, Huang J, Hahn EL, Mandelkern MA. Smoking-induced ventral striatum dopamine release. Am J Psychiatry. 2004;161(7):1211–1218. doi: 10.1176/appi.ajp.161.7.1211. [DOI] [PubMed] [Google Scholar]
- Bucholz KK, Cadoret R, Cloninger CR, Dinwiddie SH, Hesselbrock VM, Nurnberger JI, Jr, Reich T, Schmidt I, Schuckit MA. A new, semi-structured psychiatric interview for use in genetic linkage studies: a report on the reliability of the SSAGA. J Stud Alcohol. 1994;55(2):149–158. doi: 10.15288/jsa.1994.55.149. [DOI] [PubMed] [Google Scholar]
- Costes N, Merlet I, Ostrowsky K, Faillenot I, Lavenne F, Zimmer L, Ryvlin P, Le Bars D. A 18F-MPPF PET normative database of 5-HT1A receptor binding in men and women over aging. J Nucl Med. 2005;46(12):1980–1989. [PubMed] [Google Scholar]
- Dewar KM, Montreuil B, Grondin L, Reader TA. Dopamine D2 receptors labeled with [3H]raclopride in rat and rabbit brains. Equilibrium binding, kinetics, distribution and selectivity. J Pharmacol Exp Ther. 1989;250(2):696–706. [PubMed] [Google Scholar]
- Ebert D, Klein T, Lohrmann C, van Elst LT, Hesslinger B, Juengling FD. Different striatal dopamine D2 receptor occupancy in alcohol dependent patients with or without physical withdrawal symptoms --a study using IBZM-SPECT. J Neural Transm. 2002;109(9):1215–1219. doi: 10.1007/s00702-002-0749-9. [DOI] [PubMed] [Google Scholar]
- Egerton A, Mehta MA, Montgomery AJ, Lappin JM, Howes OD, Reeves SJ, Cunningham VJ, Grasby PM. The dopaminergic basis of human behaviors: A review of molecular imaging studies. Neurosci Biobehav Rev. 2009;33(7):1109–1132. doi: 10.1016/j.neubiorev.2009.05.005. [DOI] [PMC free article] [PubMed] [Google Scholar]
- Etter JF. A self-administered questionnaire to measure cigarette withdrawal symptoms: the Cigarette Withdrawal Scale. Nicotine Tob Res. 2005;7(1):47–57. doi: 10.1080/14622200412331328501. [DOI] [PubMed] [Google Scholar]
- Fei X, Mock BH, DeGrado TR, Wang JQ, Glick-Wilson BE, Sullivan ML, Hutchins GD, Zheng QH. An improved synthesis of PET dopamine D2 receptors radioligand [11C]raclopride. Synthetic Communications. 2004;34(10):1897–1907. [Google Scholar]
- Hesselbrock M, Easton C, Bucholz KK, Schuckit M, Hesselbrock V. A validity study of the SSAGA--a comparison with the SCAN. Addiction. 1999;94(9):1361–1370. doi: 10.1046/j.1360-0443.1999.94913618.x. [DOI] [PubMed] [Google Scholar]
- Hietala J, Nagren K, Lehikoinen P, Ruotsalainen U, Syvalahti E. Measurement of striatal D2 dopamine receptor density and affinity with [11C]-raclopride in vivo: a test-retest analysis. J Cereb Blood Flow Metab. 1999;19(2):210–217. doi: 10.1097/00004647-199902000-00012. [DOI] [PubMed] [Google Scholar]
- Hirvonen J, Aalto S, Lumme V, Nagren K, Kajander J, Vilkman H, Hagelberg N, Oikonen V, Hietala J. Measurement of striatal and thalamic dopamine D2 receptor binding with 11C-raclopride. Nucl Med Commun. 2003;24(12):1207–1214. doi: 10.1097/00006231-200312000-00002. [DOI] [PubMed] [Google Scholar]
- Ichise M, Liow JS, Lu JQ, Takano A, Model K, Toyama H, Suhara T, Suzuki K, Innis RB, Carson RE. Linearized reference tissue parametric imaging methods: application to [11C]DASB positron emission tomography studies of the serotonin transporter in human brain. J Cereb Blood Flow Metab. 2003;23(9):1096–1112. doi: 10.1097/01.WCB.0000085441.37552.CA. [DOI] [PubMed] [Google Scholar]
- Innis RB, Cunningham VJ, Delforge J, Fujita M, Gjedde A, Gunn RN, Holden J, Houle S, Huang SC, Ichise M, Iida H, Ito H, Kimura Y, Koeppe RA, Knudsen GM, Knuuti J, Lammertsma AA, Laruelle M, Logan J, Maguire RP, Mintun MA, Morris ED, Parsey R, Price JC, Slifstein M, Sossi V, Suhara T, Votaw JR, Wong DF, Carson RE. Consensus nomenclature for in vivo imaging of reversibly binding radioligands. J Cereb Blood Flow Metab. 2007;27(9):1533–1539. doi: 10.1038/sj.jcbfm.9600493. [DOI] [PubMed] [Google Scholar]
- Laruelle M. Imaging synaptic neurotransmission with in vivo binding competition techniques: a critical review. J Cereb Blood Flow Metab. 2000;20(3):423–451. doi: 10.1097/00004647-200003000-00001. [DOI] [PubMed] [Google Scholar]
- Logan J, Fowler JS, Volkow ND, Wang GJ, Ding YS, Alexoff DL. Distribution volume ratios without blood sampling from graphical analysis of PET data. J Cereb Blood Flow Metab. 1996;16(5):834–840. doi: 10.1097/00004647-199609000-00008. [DOI] [PubMed] [Google Scholar]
- Martinez D, Gil R, Slifstein M, Hwang DR, Huang Y, Perez A, Kegeles L, Talbot P, Evans S, Krystal J, Laruelle M, Abi-Dargham A. Alcohol dependence is associated with blunted dopamine transmission in the ventral striatum. Biol Psychiatry. 2005;58(10):779–786. doi: 10.1016/j.biopsych.2005.04.044. [DOI] [PubMed] [Google Scholar]
- Martinez D, Slifstein M, Broft A, Mawlawi O, Hwang DR, Huang Y, Cooper T, Kegeles L, Zarahn E, Abi-Dargham A, Haber SN, Laruelle M. Imaging human mesolimbic dopamine transmission with positron emission tomography. Part II: amphetamine-induced dopamine release in the functional subdivisions of the striatum. J Cereb Blood Flow Metab. 2003;23(3):285–300. doi: 10.1097/01.WCB.0000048520.34839.1A. [DOI] [PubMed] [Google Scholar]
- Mawlawi O, Martinez D, Slifstein M, Broft A, Chatterjee R, Hwang DR, Huang Y, Simpson N, Ngo K, Van Heertum R, Laruelle M. Imaging human mesolimbic dopamine transmission with positron emission tomography: I. Accuracy and precision of D(2) receptor parameter measurements in ventral striatum. J Cereb Blood Flow Metab. 2001;21(9):1034–1057. doi: 10.1097/00004647-200109000-00002. [DOI] [PubMed] [Google Scholar]
- McGraw KO, Wong SP. Forming inferences about some intraclass correlation coefficients. Psychological Methods. 1996;1(1):30–46. [Google Scholar]
- Meyerhoff DJ, Tizabi Y, Staley JK, Durazzo TC, Glass JM, Nixon SJ. Smoking comorbidity in alcoholism: neurobiological and neurocognitive consequences. Alcohol Clin Exp Res. 2006;30(2):253–264. doi: 10.1111/j.1530-0277.2006.00034.x. [DOI] [PubMed] [Google Scholar]
- NIAAA. NIH Publication No 03–3745. 2003. Assessing Alcohol Problems: A Guide for Clinicians and Researchers. [Google Scholar]
- O'Connor S, Morzorati S, Christian J, Li TK. Clamping breath alcohol concentration reduces experimental variance: application to the study of acute tolerance to alcohol and alcohol elimination rate. Alcohol Clin Exp Res. 1998;22(1):202–210. [PubMed] [Google Scholar]
- Picard F, Bruel D, Servent D, Saba W, Fruchart-Gaillard C, Schollhorn-Peyronneau MA, Roumenov D, Brodtkorb E, Zuberi S, Gambardella A, Steinborn B, Hufnagel A, Valette H, Bottlaender M. Alteration of the in vivo nicotinic receptor density in ADNFLE patients: a PET study. Brain. 2006;129(Pt 8):2047–2060. doi: 10.1093/brain/awl156. [DOI] [PubMed] [Google Scholar]
- Ramchandani VA, Bolane J, Li TK, O'Connor S. A physiologically-based pharmacokinetic (PBPK) model for alcohol facilitates rapid BrAC clamping. Alcohol Clin Exp Res. 1999;23(4):617–623. [PubMed] [Google Scholar]
- Rice JP, Reich T, Bucholz KK, Neuman RJ, Fishman R, Rochberg N, Hesselbrock VM, Nurnberger JI, Jr, Schuckit MA, Begleiter H. Comparison of direct interview and family history diagnoses of alcohol dependence. Alcohol Clin Exp Res. 1995;19(4):1018–1023. doi: 10.1111/j.1530-0277.1995.tb00983.x. [DOI] [PubMed] [Google Scholar]
- Room R. Smoking and drinking as complementary behaviours. Biomed Pharmacother. 2004;58(2):111–115. doi: 10.1016/j.biopha.2003.12.003. [DOI] [PubMed] [Google Scholar]
- Schlosser R, Brodie JD, Dewey SL, Alexoff D, Wang GJ, Fowler JS, Volkow N, Logan J, Wolf AP. Long-term stability of neurotransmitter activity investigated with 11C-raclopride PET. Synapse. 1998;28(1):66–70. doi: 10.1002/(SICI)1098-2396(199801)28:1<66::AID-SYN8>3.0.CO;2-A. [DOI] [PubMed] [Google Scholar]
- Seeman P, Guan HC, Niznik HB. Endogenous dopamine lowers the dopamine D2 receptor density as measured by [3H]raclopride: implications for positron emission tomography of the human brain. Synapse. 1989;3(1):96–97. doi: 10.1002/syn.890030113. [DOI] [PubMed] [Google Scholar]
- Shrout PE, Fleiss JL. Intraclass correlations: Uses in assessing reliability. Psychological Bulletin. 1979;86:420–428. doi: 10.1037//0033-2909.86.2.420. [DOI] [PubMed] [Google Scholar]
- Sullivan JT, Sykora K, Schneiderman J, Naranjo CA, Sellers EM. Assessment of alcohol withdrawal: the revised clinical institute withdrawal assessment for alcohol scale (CIWA-Ar) Br J Addict. 1989;84(11):1353–1357. doi: 10.1111/j.1360-0443.1989.tb00737.x. [DOI] [PubMed] [Google Scholar]
- Volkow ND, Fowler JS, Wang GJ, Dewey SL, Schlyer D, MacGregor R, Logan J, Alexoff D, Shea C, Hitzemann R, et al. Reproducibility of repeated measures of carbon-11-raclopride binding in the human brain. J Nucl Med. 1993;34(4):609–613. [PubMed] [Google Scholar]
- Volkow ND, Wang GJ, Fowler JS, Logan J, Hitzemann R, Ding YS, Pappas N, Shea C, Piscani K. Decreases in dopamine receptors but not in dopamine transporters in alcoholics. Alcohol Clin Exp Res. 1996;20(9):1594–1598. doi: 10.1111/j.1530-0277.1996.tb05936.x. [DOI] [PubMed] [Google Scholar]
- Volkow ND, Wang GJ, Maynard L, Fowler JS, Jayne B, Telang F, Logan J, Ding YS, Gatley SJ, Hitzemann R, Wong C, Pappas N. Effects of alcohol detoxification on dopamine D2 receptors in alcoholics: a preliminary study. Psychiatry Res. 2002;116(3):163–172. doi: 10.1016/s0925-4927(02)00087-2. [DOI] [PubMed] [Google Scholar]
- Volkow ND, Wang GJ, Telang F, Fowler JS, Logan J, Childress AR, Jayne M, Ma Y, Wong C. Cocaine cues and dopamine in dorsal striatum: mechanism of craving in cocaine addiction. J Neurosci. 2006;26(24):6583–6588. doi: 10.1523/JNEUROSCI.1544-06.2006. [DOI] [PMC free article] [PubMed] [Google Scholar]
- Volkow ND, Wang GJ, Telang F, Fowler JS, Logan J, Jayne M, Ma Y, Pradhan K, Wong C. Profound decreases in dopamine release in striatum in detoxified alcoholics: possible orbitofrontal involvement. J Neurosci. 2007;27(46):12700–12706. doi: 10.1523/JNEUROSCI.3371-07.2007. [DOI] [PMC free article] [PubMed] [Google Scholar]
- Weiss F, Parsons LH, Schulteis G, Hyytia P, Lorang MT, Bloom FE, Koob GF. Ethanol self-administration restores withdrawal-associated deficiencies in accumbal dopamine and 5-hydroxytryptamine release in dependent rats. J Neurosci. 1996;16(10):3474–3485. doi: 10.1523/JNEUROSCI.16-10-03474.1996. [DOI] [PMC free article] [PubMed] [Google Scholar]
- Wong DF, Kuwabara H, Schretlen DJ, Bonson KR, Zhou Y, Nandi A, Brasic JR, Kimes AS, Maris MA, Kumar A, Contoreggi C, Links J, Ernst M, Rousset O, Zukin S, Grace AA, Lee JS, Rohde C, Jasinski DR, Gjedde A, London ED. Increased occupancy of dopamine receptors in human striatum during cue-elicited cocaine craving. Neuropsychopharmacology. 2006;31(12):2716–2727. doi: 10.1038/sj.npp.1301194. [DOI] [PubMed] [Google Scholar]
- Yoder KK, Constantinescu CC, Kareken DA, Normandin MD, Cheng TE, O'Connor SJ, Morris ED. Heterogeneous effects of alcohol on dopamine release in the striatum: a PET study. Alcohol Clin Exp Res. 2007;31(6):965–973. doi: 10.1111/j.1530-0277.2007.00390.x. [DOI] [PubMed] [Google Scholar]
- Yoder KK, Kareken DA, Morris ED. What were they thinking? Cognitive states may influence [(11)C]raclopride binding potential in the striatum. Neurosci Lett. 2008;430(1):38–42. doi: 10.1016/j.neulet.2007.10.017. [DOI] [PMC free article] [PubMed] [Google Scholar]
- Yoder KK, Morris ED, Constantinescu CC, Cheng TE, Normandin MD, O'Connor SJ, Kareken DA. When what you see isn't what you get: alcohol cues, alcohol administration, prediction error, and human striatal dopamine. Alcohol Clin Exp Res. 2009;33(1):139–149. doi: 10.1111/j.1530-0277.2008.00821.x. [DOI] [PMC free article] [PubMed] [Google Scholar]
- Young LT, Wong DF, Goldman S, Minkin E, Chen C, Matsumura K, Scheffel U, Wagner HN., Jr Effects of endogenous dopamine on kinetics of [3H]N-methylspiperone and [3H]raclopride binding in the rat brain. Synapse. 1991;9(3):188–194. doi: 10.1002/syn.890090305. [DOI] [PubMed] [Google Scholar]
- Ziolko SK, Weissfeld LA, Klunk WE, Mathis CA, Hoge JA, Lopresti BJ, DeKosky ST, Price JC. Evaluation of voxel-based methods for the statistical analysis of PIB PET amyloid imaging studies in Alzheimer's disease. Neuroimage. 2006;33(1):94–102. doi: 10.1016/j.neuroimage.2006.05.063. [DOI] [PubMed] [Google Scholar]