Abstract
Cirrhosis is an important and growing public health problem, affecting millions of Americans and many more people internationally. A pathological hallmark of the progression to cirrhosis is the development of liver fibrosis, so that monitoring the appearance and progression of liver fibrosis can be used to guide therapy. We here report a method to use magnetization-tagged magnetic resonance imaging (MRI) to measure the cardiac-induced motion and deformation in the liver, as a means for noninvasively assessing liver stiffness, which is related to fibrosis. The initial results show statistically significant differences between healthy and cirrhotic subjects in the direct comparisons of the maximum displacement (mm), and the maximum (P1) and minimum (P2) 2D strains, through the cardiac cycle (3.514 ± 0.793, 2.184 ± 0.611; 0.116 ± 0.043, 0.048 ± 0.011; −0.094 ± 0.020, −0.041 ± 0.015; healthy, cirrhosis, respectively; p < 0.005 for all). There are also significant differences in the displacement-normalized P1 and P2 strains (mm−1) (0.030 ± 0.008, 0.017 ± 0.007; −0.024 ± 0.006, −0.013 ± 0.004; healthy, cirrhosis, respectively; p < 0.005 for all). Therefore, this noninvasive imaging-based method is a promising means to assess liver stiffness using clinically available imaging tools.
Keywords: liver stiffness, fibrosis, cirrhosis, Gabor filter, tagged MRI, liver motion
INTRODUCTION
Liver disease, and its progression to cirrhosis with its many potential complications, is a significant public health problem. There is frequently clinically silent progression of the disease until the later development of the potentially serious complications of cirrhosis. A pathological hallmark of the progression to cirrhosis is the development of liver fibrosis; there is increasing evidence of liver fibrosis reversibility in its early stages (1–3). Therefore, assessing the degree of fibrosis is one of the most important factors for the effective treatment and the prevention of later complications of liver disease.
The stage of liver fibrosis is currently assessed with liver biopsy (4–6). However, biopsy is uncomfortable and potentially risky for the patient, and also is subject to sampling and observation errors (7–9). Thus, there has been much interest in the potential of noninvasive imaging methods to assess liver fibrosis (10–11). It is well known that fibrosis leads to increased mechanical stiffness of the liver (12–13). Therefore, liver stiffness can be used to monitor the progression of liver disease, as it reflects the development of fibrosis. Recently, ultrasound-based transient elastography has been introduced for detecting extensive fibrosis and cirrhosis (14–16). However, it is limited to use in only the more superficial parts of the liver, leading to possible sampling error, and rendering it less useful in obese patients (17); it also requires the use of special-purpose apparatus. Magnetic resonance image (MRI)-based studies using MR elastography (MRE) have shown an encouraging degree of correlation between liver stiffness and degree of liver fibrosis (18–21). It observes the propagation through the liver of transverse waves induced by an external vibration source; increased liver stiffness results in faster wave velocities and correspondingly longer wavelengths of the vibration waves in the liver. However, the use of MRE requires special-purpose hardware to generate an externally induced vibration wave in the liver, synchronized with the imaging (22).
In this study, we have used the motion of the heart as an intrinsic motion source to transiently deform the liver. Some prior studies using ultrasound have reported the feasibility of using the cardiac-induced motion of the liver for assessing liver stiffness (23–25). However, these previous efforts have only been relatively qualitative. In order to better quantify the cardiac-induced motion in the liver, we used magnetization-tagged MRI (26–28) to noninvasively create MRI-visible regions of altered magnetization (called “tags”) within the tissue being imaged. These tags can persist for times on the order of the T1 relaxation time of the tissue, and they move with the underlying tissue, resulting in a direct display of the motion in the corresponding images. As the heart contracts and relaxes during the cardiac cycle, the motion of the heart is transmitted across the diaphragm to the adjacent liver, resulting in relatively localized motion and deformation of the liver; this can be clearly seen in the tagged images. For analysis of the tagged images, a Gabor filter bank (29–30) was used to provide quantitative maps of the local motion field and corresponding local strains. Thus, this method provides an image-derived measure directly related to the underlying mechanical stiffness of the liver, without the need for extended indirect analyses.
MATERIALS AND METHODS
Subjects and MRI Protocol
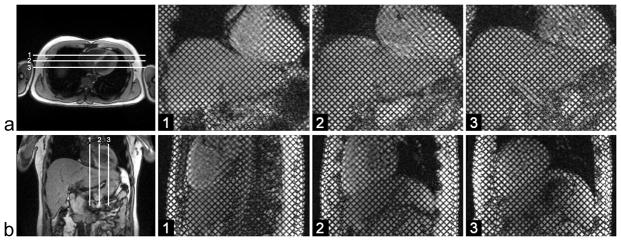
MR imaging was performed on 8 healthy volunteers (31.6 ± 4.4 years old) and 7 patients (61.3 ± 13.3 years old) with MRI evidence of cirrhosis. Subjects were scanned using 3T (Tim Trio; Siemens Medical Solutions, Erlangen, Germany) or 1.5T (Avanto; Siemens Medical Solutions, Erlangen, Germany) MRI systems, with standard phased-array coils. Protocols of the human studies were approved by the Human Investigation Committee at our institution and informed consent was obtained from all volunteers. A conventional cardiac imaging sequence, with SPAMM tagging for two-dimensional grid formation, was performed through the cardiac cycle with electrocardiogram (ECG)-triggering (and tagging) at end diastole and breath-holding by the subjects. Imaging parameters included: TE = 3.9 ms, TR = 8.0 ms, 6 segments per cardiac cycle, temporal resolution = 48.2 ms, flip angle = 10°, receiver bandwidth = 201 Hz/pixel, generalized autocalibrating partially parallel acquisitions (GRAPPA) (31) acceleration factor 2 with 24 reference k-space lines, field of view = 300 mm × 300 mm, matrix = 256 × 174, in-plane resolution = 1.2 mm × 1.7 mm, slice thickness = 6 mm, tag thickness = 1.5 mm, tag spacing = 7 mm, tag orientation = ±45°, total acquisition time per slice ~ 15–20 s. Tagged images were acquired in three coronal and three sagittal planes encompassing both the liver and the heart, as shown in Fig. 1.
FIG. 1.
a: Axial localizer image with the three coronal imaging planes (white lines), and corresponding grid-tagged images at end-diastole. b: Coronal localizer image with the three sagittal imaging planes (white lines), and corresponding grid-tagged images at end-diastole.
Image analysis
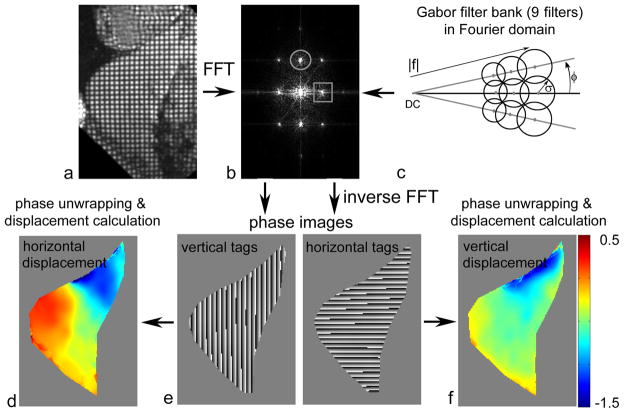
A Gabor filter bank was used to adaptively detect the local tag spacing and orientation in the tagged MR images. This was estimated from the local image response to the application of the filters to the first harmonic peaks of each quasi-periodic family of tags in the Fourier domain (Fig. 2a–c). In the Fourier domain, a Gabor filter, G(u,v), can be considered as derived from two components, such as the even-symmetric filter, ΨR(u,v), and the odd-symmetric filter, ΨI(u,v):
where ω(u,v) is a Gaussian function, and (u0,v0) and (−u0,−v0) are the center frequencies of the shifted components of ω(u,v). Because of the linearity of the Fourier transform, G(u,v) can be derived as a shifted Gaussian function:
FIG. 2.
Tagged MR image in a: spatial domain and b: Fourier domain, showing first harmonic peaks of horizontal (circle) and vertical (square) tag families; c: Gabor filter bank with 9 filters in Fourier domain for choices of the magnitude of center spatial frequency, |f|, orientation, φ, and the extent of the Gaussian function, σ; d: displacement of vertical tags (derived from phase data in e); e: phase images derived from the output of a Gabor filter bank; f: displacement of horizontal tags (derived from phase data in e).
A Gabor filter bank can be created by suitable choices of values of the filter parameters, such as the magnitude of the center frequency, |f|, the orientation, φ, and the extent of the Gaussian function, σ. In this study, we used a total of 9 filters, as shown in Fig. 2c: the initial |f| was determined by measuring the distance from the DC peak to the first harmonic peak in the undeformed image, the step of φ= 10° was empirically chosen to cover typical tag rotations, and the σ was chosen to be dependent on 1/|f| to allow a fixed range of output for filters in the image domain. The final response was calculated by a weighted combination of the local top three responses from multiplying these 9 filters with the first harmonic peaks in the Fourier domain, for the two families of tags in the grid (Fig. 2b). The phase images corresponding to the estimated local positions of the vertical and horizontal tag patterns within the image (Fig. 2e) were then computed by the inverse Fourier transform, and the equivalent local Eulerian displacement maps were calculated from the unwrapped differences of the phase images between consecutive images (32). The phase images were unwrapped to avoid phase and position aliasing (wrapping). Each pixel in a given phase image was then mapped back to its corresponding location in the initial phase image, to calculate the Lagrangian displacement referenced to the initial image (Fig. 2d and 2f). Therefore, in the resulting sequential displacement maps, the shape of the object remained the same as the initial shape, and so segmentation of the liver region (performed manually) was only necessary once, for the initial shape. Since two orthogonally oriented phase images were generated from the filtered grid-tagged image, a full description of the 2D in-plane motion could be obtained from combining the displacement results from the two sets of phase images. The corresponding principal strains, representing the tissue deformation (computed as fractional changes in material length along a given direction in the tissue), were also calculated from the displacement field. Note that the first principal strain (P1) represents the amount of the greatest elongation or stretch of the tissue at a given location, and the second principal strain (P2) represents the amount of the greatest compression or shortening. This method was validated with a numerically generated phantom in our previous study (30).
Data and statistical analyses
In order to account for the complex 3D motion and deformation pattern induced in the liver by the cardiac motion, the 6 imaging planes were searched for extrema (maximum displacement, maximum P1 and minimum P2 strain in liver regions below the heart; maximum P1 and minimum P2 strains in liver regions remote from the heart). For each imaging plane, three regions of interest (ROI), with a size of approximately 18 x 18 mm2 (~ 240 pixels), were chosen in liver regions below the diaphragm where the greatest average absolute value occurred for the displacement and the P1 and P2 strains. For the analysis, the local maximum P1 and minimum P2 liver strains, as well as the maximum displacement, were found over the cardiac cycle from among the results of the six imaging planes. In the same manner, the maximum P1 and minimum P2 baseline strains measured in liver regions remote from the heart were determined. These remote “baseline” strains were then subtracted from the sub-cardiac strains, providing an approximate measure of the strain gradient. Since the amount of motion transmitted to the liver varies, due to variability between subjects in the degree of cardiac motion, these “remote-compensated” strains were then normalized by dividing by the maximum local displacement beneath the heart. Thus, the cardiac-induced peak motion and normalized deformation can be quantitatively compared between different subjects, and the corresponding changes due to increased stiffness can be identified and measured.
Measured values were compared between healthy and cirrhotic groups with Student’s t-test, using a 5% limit of significance. Data are expressed as mean ± standard deviation.
RESULTS
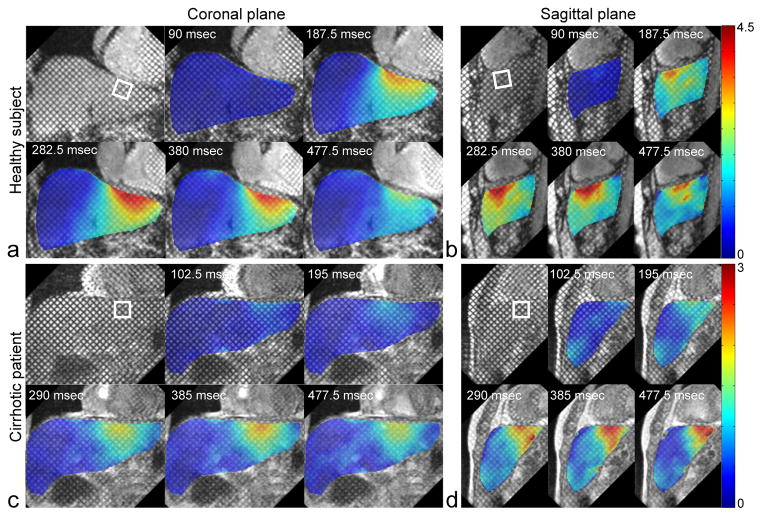
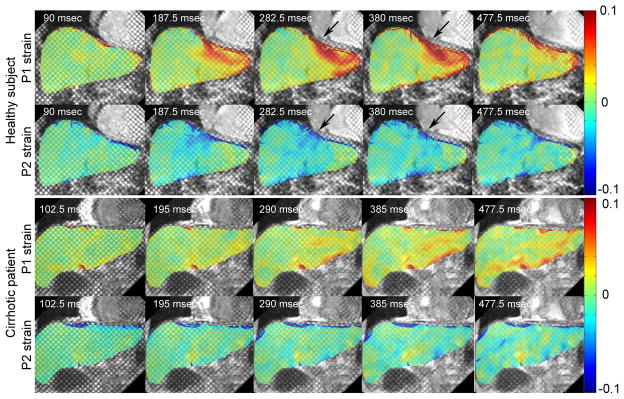
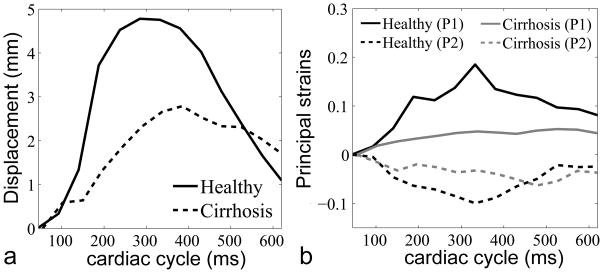
Figure 3 shows grid-tagged MR images of a representative healthy subject and a cirrhotic patient, in representative coronal and sagittal planes, with an absolute displacement color-map derived from analysis of the tagged images superimposed over the liver. In the healthy subject, relatively high concentrations of the motion and deformation are seen to be localized beneath the heart, but this is appreciably less so in the cirrhotic patient. In Fig. 4, the corresponding P1 and P2 strains are shown for the healthy and cirrhotic subjects. In the healthy subject, there are relatively large magnitude P1 and P2 strains below the heart at end-systole, as indicated by black arrows, but this is less so in the cirrhotic patient, reflecting the greater stiffness of the cirrhotic liver and its resistance to stretching and shearing deformations. The plots in Fig. 5 show the corresponding local displacements and local P1 and P2 strains averaged within ROIs selected below the diaphragm, through the cardiac cycle, for the same representative healthy and cirrhotic subjects. As shown in Fig. 5a, the local mean displacement is relatively larger and recovers more rapidly in the healthy subject; the corresponding average strains are also relatively larger in magnitude and recover more quickly in the healthy subject (Fig. 5b).
FIG. 3.
Representative end-systolic grid-tagged MR images with superimposed color-coded (scales in mm) corresponding combined vertical-horizontal displacement maps at representative cardiac phases of a: a healthy subject in coronal plane and b: in sagittal plane, and c: of a cirrhotic patient in coronal plane and d: in sagittal plane. ROIs for Fig. 5 data are indicated by square boxes.
FIG. 4.
P1 and P2 strains (corresponding to Fig. 3 a and c) for a: healthy subject and b: cirrhotic patient, at different cardiac cycle times. Regions of relatively high strain concentration are indicated by the black arrows in healthy subject.
FIG. 5.
a: Corresponding displacement and b: P1 and P2 strains for the healthy and cirrhotic subjects in ROIs through the cardiac cycle.
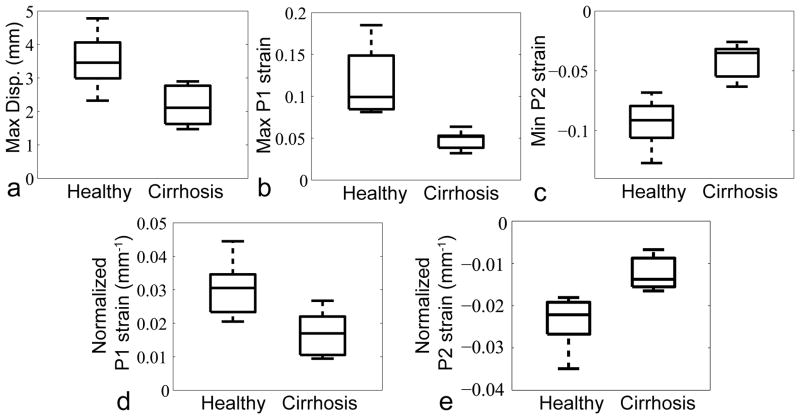
Figure 6 shows boxplots of maximum displacement (mm), maximum P1 strain, minimum P2 strain, and normalized P1 and P2 strains (mm−1) (3.514 ± 0.793, 2.184 ± 0.611; 0.116 ± 0.043, 0.048 ± 0.011; −0.094 ± 0.020, −0.041 ± 0.015; 0.030 ± 0.008, 0.017 ± 0.007; −0.024 ± 0.006, −0.013 ± 0.004; healthy, cirrhosis, respectively; p < 0.005 for all) through the cardiac cycle for all healthy subjects and cirrhosis patients.
FIG. 6.
Boxplots of a: maximum displacement, b: maximum P1 strain, c: minimum P2 strain through the cardiac cycle, d: normalized P1 strain at end-systole and e: normalized P2 strain at end-systole, for all healthy subjects and cirrhosis patients (p < 0.005 for all).
DISCUSSION
This study has demonstrated a new noninvasive method to assess liver stiffness, using tagged MRI to measure cardiac-induced motion and deformation in the liver. While other currently used noninvasive methods (16,18–19) to assess liver stiffness require the use of special-purpose hardware to generate liver motion from an external source, this method uses the motion of the heart as an intrinsic motion source. To capture the cardiac-induced motion in the liver, we performed conventional ECG-triggered tagged MRI at 3T and 1.5T. Since the T1 relaxation time of the tissue is longer at 3T, the tags persist relatively longer during the cardiac cycle at 3T than 1.5T (33–34). Thus, at 1.5T, tags were not seen clearly after mid-diastole in some patients. Therefore, for the analysis, we have focused primarily on the cardiac-contraction-induced (“pull-up”) deformation in the liver during systole. Using peripheral pulse-triggering with a typical delay relative to ECG-triggering, we could see more cardiac-relaxation-induced (“push-down/release”) deformation in the liver during diastole. Comparison of the effects of these two different motion mechanisms in the liver can be further studied in the future.
While the other currently used noninvasive methods for assessing liver stiffness calculate the liver elasticity through evaluation of transverse wave propagation through the liver, this method measures the cardiac-induced motion in the liver. However, variations among subjects in the degree of heart motion as well as the heart/liver anatomical coupling can result in different degrees of the resulting liver deformation. In order to approximately account for these degrees of cardiac motion, a simple displacement normalization scheme was used in this study. However, the displacement measured in the liver was affected by both the amount of cardiac motion and the condition of liver stiffness, so that the actual cardiac motion could be underestimated in the stiffer liver of the patients. Consequently, this simple normalization procedure could lead to overestimating the final motion results. This could explain why we observed less relative differences between healthy and cirrhotic subjects when compared to previously reported MRE results (21). Future work exploring these normalization issues will be necessary to better distinguish between patients with a larger range of degrees of liver fibrosis or to more reliably account for larger ranges of cardiac-induced motion. To further sensitize the results to the stiffness of the liver, we also measured the “remote” strains in the liver further away from the heart and subtracted them from the values beneath the heart. However, since hepatic fibrosis may not be uniformly distributed, this remote baseline correction might not be suitable for patients with earlier, heterogeneous, fibrosis. In this study, since our healthy subjects and patients with known cirrhosis were drawn from two relatively distinct populations, we found statistically significant differences in all values, both with and without the normalization, as shown in Fig. 6.
In this study, we used 6 imaging planes (three coronal and three sagittal planes) to measure samples of the three-dimensional (3D) cardiac-induced motion in the liver. Due to our relatively coarse image location sampling, the motion analysis results could possibly be underestimated by missing the actual region of maximum local deformation in the liver. For further improving and stabilizing the results, 3D tagged MRI could potentially be used to cover the whole liver.
This method could be complementary to other methods used to assess liver fibrosis, such as ultrasound-based elastography or liver biopsy, since it is mainly sensitive to the properties of the left lobe of the liver, while the other methods primarily approach the right lobe of the liver. In addition, it could also be complementary to the other noninvasive methods in that it is sensitive to the mechanical response of the liver to induced motions in the frequency range of around 1Hz (similar to the effective frequency range of conventional clinical liver palpation), while the ultrasound and MRE-based methods apply much higher vibrational frequencies. Thus, this method may provide different information on the viscoelastic properties of the liver.
Although they are based on the study of a small number of healthy and cirrhotic subjects these initial results are very encouraging. We will need to examine a larger number of subjects, with a greater range of degrees of fibrosis, in order to find reliable quantitative clinical criteria for the diagnosis of fibrosis. In particular, detection of earlier stages of fibrosis is more clinically interesting, as fibrosis may be more reversible in its early stages. In order to evaluate the potential of this method for detecting and grading milder degrees of fibrosis, patients with less severe disease and a biopsy-proven fibrosis level will need to be studied in the future. This method may have some potential problems if applied to subjects with large amounts of ascites or pericardial effusions, in whom the cardiac motions may not be well transmitted to the liver. There may also be potential problems in studying patients with cardiac arrhythmias, who may have blurring of the tagged images due to inconsistency in successive heart beats, and patients with systolic heart failure, who may have a significantly reduced amplitude of cardiac motion.
In conclusion, this method for assessing the liver stiffness based on tagged MRI of cardiac-induced liver motion has a potential to replace the liver biopsy in some cases, e.g., for serial examinations to monitor for progression of disease. This method provides a set of image-derived measures that are very directly and intuitively related to the underlying mechanical stiffness of the liver, without the need for extended indirect analyses. As this new MRI liver assessment method does not require any special-purpose hardware, other than ECG gating, it could be readily implemented on any conventional MRI system; as it is rapid to perform (approximately 5 min for all 6 imaging planes), it could be readily incorporated in routine liver MRI examinations. Thus, there is a significant potential for this method to have a beneficial impact on patient care.
Acknowledgments
The authors thank Kellyanne McGorty for her help in acquiring patient data presented in this paper. This research is supported in part by National Institutes of Health grants NIH R01 HL083309 and NIH R21 DK089318.
References
- 1.Dufour JF, DeLellis R, Kaplan MM. Reversibility of hepatic fibrosis in autoimmune hepatitis. Ann Intern Med. 1997;127(11):981–985. doi: 10.7326/0003-4819-127-11-199712010-00006. [DOI] [PubMed] [Google Scholar]
- 2.Friedman SL, Bansal MB. Reversal of hepatic fibrosis -- fact or fantasy? Hepatology. 2006;43(2 Suppl 1):S82–88. doi: 10.1002/hep.20974. [DOI] [PubMed] [Google Scholar]
- 3.Poynard T, McHutchison J, Davis GL, Esteban-Mur R, Goodman Z, Bedossa P, Albrecht J. Impact of interferon alfa-2b and ribavirin on progression of liver fibrosis in patients with chronic hepatitis C. Hepatology. 2000;32(5):1131–1137. doi: 10.1053/jhep.2000.19347. [DOI] [PubMed] [Google Scholar]
- 4.Menghini G. One-second needle biopsy of the liver. Gastroenterology. 1958;35(2):190–199. [PubMed] [Google Scholar]
- 5.Goodman ZD. Grading and staging systems for inflammation and fibrosis in chronic liver diseases. J Hepatol. 2007;47(4):598–607. doi: 10.1016/j.jhep.2007.07.006. [DOI] [PubMed] [Google Scholar]
- 6.Batts KP, Ludwig J. Chronic hepatitis. An update on terminology and reporting. Am J Surg Pathol. 1995;19(12):1409–1417. doi: 10.1097/00000478-199512000-00007. [DOI] [PubMed] [Google Scholar]
- 7.Holund B, Poulsen H, Schlichting P. Reproducibility of liver biopsy diagnosis in relation to the size of the specimen. Scand J Gastroenterol. 1980;15(3):329–335. doi: 10.3109/00365528009181479. [DOI] [PubMed] [Google Scholar]
- 8.Regev A, Berho M, Jeffers LJ, Milikowski C, Molina EG, Pyrsopoulos NT, Feng ZZ, Reddy KR, Schiff ER. Sampling error and intraobserver variation in liver biopsy in patients with chronic HCV infection. Am J Gastroenterol. 2002;97(10):2614–2618. doi: 10.1111/j.1572-0241.2002.06038.x. [DOI] [PubMed] [Google Scholar]
- 9.Bedossa P, Bioulacsage P, Callard P, Chevallier M, Degott C, Deugnier Y, Fabre M, Reynes M, Voigt JJ, Zafrani ES, Poynard T, Babany G. Intraobserver and interobserver variations in liver-biopsy interpretation in patients with chronic hepatitis-C. Hepatology. 1994;20(1):15–20. [PubMed] [Google Scholar]
- 10.Bonekamp S, Kamel I, Solga S, Clark J. Can imaging modalities diagnose and stage hepatic fibrosis and cirrhosis accurately? Journal of Hepatology. 2009;50(1):17–35. doi: 10.1016/j.jhep.2008.10.016. [DOI] [PubMed] [Google Scholar]
- 11.Fontana RJ, Lok ASF. Noninvasive monitoring of patients with chronic hepatitis C. Hepatology. 2002;36(5):S57–S64. doi: 10.1053/jhep.2002.36800. [DOI] [PubMed] [Google Scholar]
- 12.Yeh WC, Li PC, Jeng YM, Hsu HC, Kuo PL, Li ML, Yang PM, Lee PH. Elastic modulus measurements of human liver and correlation with pathology. Ultrasound Med Biol. 2002;28(4):467–474. doi: 10.1016/s0301-5629(02)00489-1. [DOI] [PubMed] [Google Scholar]
- 13.Yamanaka N, Okamoto E, Toyosaka A, Ohashi S, Tanaka N. Consistency of human liver. J Surg Res. 1985;39(3):192–198. doi: 10.1016/0022-4804(85)90142-8. [DOI] [PubMed] [Google Scholar]
- 14.Sandrin L, Fourquet B, Hasquenoph JM, Yon S, Fournier C, Mal F, Christidis C, Ziol M, Poulet B, Kazemi F, Beaugrand M, Palau R. Transient elastography: A new noninvasive method for assessment of hepatic fibrosis. Ultrasound in Medicine and Biology. 2003;29(12):1705–1713. doi: 10.1016/j.ultrasmedbio.2003.07.001. [DOI] [PubMed] [Google Scholar]
- 15.Foucher J, Chanteloup E, Vergniol J, Castera L, Le Bail B, Adhoute X, Bertet J, Couzigou P, de Ledinghen V. Diagnosis of cirrhosis by transient elastography (FibroScan): a prospective study. Gut. 2006;55(3):403–408. doi: 10.1136/gut.2005.069153. [DOI] [PMC free article] [PubMed] [Google Scholar]
- 16.Cobbold JF, Morin S, Taylor-Robinson SD. Transient elastography for the assessment of chronic liver disease: ready for the clinic? World J Gastroenterol. 2007;13(36):4791–4797. doi: 10.3748/wjg.v13.i36.4791. [DOI] [PMC free article] [PubMed] [Google Scholar]
- 17.Foucher J, Castera L, Bernard PH, Adhoute X, Laharie D, Bertet J, Couzigou P, de Ledinghen V. Prevalence and factors associated with failure of liver stiffness measurement using FibroScan in a prospective study of 2114 examinations. Eur J Gastroen Hepat. 2006;18(4):411–412. doi: 10.1097/00042737-200604000-00015. [DOI] [PubMed] [Google Scholar]
- 18.Muthupillai R, Lomas DJ, Rossman PJ, Greenleaf JF, Manduca A, Ehman RL. Magnetic resonance elastography by direct visualization of propagating acoustic strain waves. Science. 1995;269(5232):1854–1857. doi: 10.1126/science.7569924. [DOI] [PubMed] [Google Scholar]
- 19.Huwart L, Sempoux C, Vicaut E, Salameh N, Annet L, Danse E, Peeters F, ter Beek LC, Rahier J, Sinkus R, Horsmans Y, Van Beers BE. Magnetic resonance elastography for the noninvasive staging of liver fibrosis. Gastroenterology. 2008;135(1):32–40. doi: 10.1053/j.gastro.2008.03.076. [DOI] [PubMed] [Google Scholar]
- 20.Rouviere O, Yin M, Dresner MA, Rossman PJ, Burgart LJ, Fidler JL, Ehman RL. MR elastography of the liver: Preliminary results. Radiology. 2006;240(2):440–448. doi: 10.1148/radiol.2402050606. [DOI] [PubMed] [Google Scholar]
- 21.Yin M, Talwalkar JA, Glaser KJ, Manduca A, Grimm RC, Rossman PJ, Fidler JL, Ehman RL. Assessment of hepatic fibrosis with magnetic resonance elastography. Clin Gastroenterol H. 2007;5(10):1207–1213. doi: 10.1016/j.cgh.2007.06.012. [DOI] [PMC free article] [PubMed] [Google Scholar]
- 22.Muthupillai R, Lomas DJ, Rossman PJ, Greenleaf JF, Manduca A, Ehman RL. Magnetic resonance elastography by direct visualization of propagating acoustic strain waves. Science. 1995;269(5232):1854–1857. doi: 10.1126/science.7569924. [DOI] [PubMed] [Google Scholar]
- 23.Tristam M, Barbosa DC, Cosgrove DO, Nassiri DK, Bamber JC, Hill CR. Ultrasonic study of in vivo kinetic characteristics of human tissues. Ultrasound Med Biol. 1986;12(12):927–937. doi: 10.1016/0301-5629(86)90061-x. [DOI] [PubMed] [Google Scholar]
- 24.Yamashita Y, Kubota M. Tissue characterization from ultrasonic imaging of movement and deformation. Ultrasonics symposium; 1990. pp. 1371–1375. [Google Scholar]
- 25.Hotta N, Ayada M, Okumura A, Ishikawa T, Sato K, Oohashi T, Hijikata Y, Murayama S, Ido M, Kakumu S. Noninvasive assessment of liver disease - measurement of hepatic fibrosis using tissue strain imaging. Clin Imag. 2007;31(2):87–92. doi: 10.1016/j.clinimag.2006.11.003. [DOI] [PubMed] [Google Scholar]
- 26.Zerhouni EA, Parish DM, Rogers WJ, Yang A, Shapiro EP. Human heart: tagging with MR imaging-a method for noninvasive assessment of myocardial motion. Radiology. 1988;169(1):59–63. doi: 10.1148/radiology.169.1.3420283. [DOI] [PubMed] [Google Scholar]
- 27.Axel L, Dougherty L. MR imaging of motion with spatial modulation of magnetization. Radiology. 1989;171(3):841–845. doi: 10.1148/radiology.171.3.2717762. [DOI] [PubMed] [Google Scholar]
- 28.Axel L, Dougherty L. Heart wall motion: improved method of spatial modulation of magnetization for MR imaging. Radiology. 1989;172(2):349–350. doi: 10.1148/radiology.172.2.2748813. [DOI] [PubMed] [Google Scholar]
- 29.Gabor D. Theory of communication. Journal of Institution of Electrical Engineers. 1946;93:429–457. [Google Scholar]
- 30.Chung S, Chen T, Axel L. Evaluation of heart wall motion from tagged MRI using Gabor filter bank. Proceedings of the 15th International Society for Magnetic Resonance in Medicine; 2007. p. 3598. [Google Scholar]
- 31.Griswold MA, Jakob PM, Heidemann RM, Nittka M, Jellus V, Wang JM, Kiefer B, Haase A. Generalized Autocalibrating Partially Parallel Acquisitions (GRAPPA) Magnet Reson Med. 2002;47(6):1202–1210. doi: 10.1002/mrm.10171. [DOI] [PubMed] [Google Scholar]
- 32.Osman NF, McVeigh ER, Prince JL. Imaging heart motion using harmonic phase MRI. Ieee T Med Imaging. 2000;19(3):186–202. doi: 10.1109/42.845177. [DOI] [PubMed] [Google Scholar]
- 33.Ryf S, Kozerke S, Spiegel M, Lamerichs R, Boesiger P. Myocardial tagging: comparing imaging at 3.0T and 1.5T. Proceedings of the 10th International Society for Magnetic Resonance in Medicine; 2002. p. 1675. [Google Scholar]
- 34.Valeti VU, Chun W, Potter DD, Araoz PA, McGee KP, Glockner JF, Christian TF. Myocardial tagging and strain analysis at 3 Tesla: Comparison with 1.5 Tesla imaging. J Magn Reson Imaging. 2006;23(4):477–480. doi: 10.1002/jmri.20527. [DOI] [PubMed] [Google Scholar]


