

Abstract
The proper level of estrogen-estrogen receptor (ER) signaling is important for the maintenance of epithelial homeostasis in the breast. In a previous study we demonstrated that ATBF1, which has been suggested as a tumor suppressor in breast cancer, inhibited estrogen-mediated cell proliferation by selectively competing with AIB1 for binding to the ER. However, the expression of ATBF1 mRNA was shown to positively correlate with ER in breast cancer specimens. We, therefore, examined whether estrogen regulates ATBF1. We demonstrated that estrogen up-regulated the transcription of ATBF1, which was mediated by the direct binding of the ER onto the ATBF1 promoter, and that a half-estrogen-responsive element in the ATBF1 promoter was essential for ER direct binding. Furthermore, we found that estrogen at lower levels increased, but at higher levels decreased the expression of ATBF1 protein, which involved the degradation of ATBF1 protein by the estrogen-responsive proteasome system. ATBF1 protein levels fluctuate with estrogen levels. Although lower levels of estrogen increased ATBF1 protein expression, ATBF1 still inhibited cell proliferation caused by lower levels of estrogen. These findings not only reveal an autoregulatory feedback loop between ATBF1 and estrogen-ER signaling but also suggest that ATBF1 plays a role in both the maintenance of breast epithelial homeostasis and breast tumorigenesis caused by elevated estrogen levels.
Keywords: Breast Cancer, Estrogen, Protein Degradation, Transcription Regulation, Tumor Suppressor, ATBF1, Estrogen Receptor
Introduction
Extensive studies have established that estrogen is important for the development of the mammary gland and is positively associated with the initiation and development of breast cancer (1). Estrogen exerts its effect through the activation of estrogen receptors, mainly the α subtype (ERα,2 or ER hereafter), a member of the nuclear receptor superfamily of transcription factors, which in turn regulates the expression of a variety of genes involved in multiple physiopathological processes including proliferation, differentiation, and apoptosis (2). Tight regulation of estrogen-ER signaling is important for the maintenance of epithelial homeostasis in the breast. In normal mammary epithelial cells, the level and function of ER fluctuates during the menstrual cycle in response to cyclical changes in estrogen (3, 4). ER regulates the expression of a variety of genes through the recruitment of coactivators and corepressors, which are often oncoproteins and tumor suppressors, respectively (5). Estrogen, ER, and coregulators are present in limiting amounts in normal cells. In breast cancer, however, their levels and/or structure are often interrupted, which contributes to the initiation and development of breast cancer (5).
The AT-motif binding factor 1 (ATBF1) is a transcription factor composed of 3703 amino acid residues. It was originally identified for its direct binding to and negative regulation of the α-fetoprotein gene in a hepatoma cell line (6). In recent studies we identified ATBF1 as a strong candidate for the 16q22 tumor suppressor gene in human cancers, including prostate and breast cancers (7, 8). In breast cancer the ATBF1 gene is frequently deleted (7). ATBF1 expression is abundant in normal mammary gland but is dramatically reduced in most breast cancer samples tested (7). Two of 32 breast cancer samples (6%) tested showed mutations in the ATBF1 gene (7). Breast cancers with higher levels of ATBF1 mRNA expression are less metastatic to the lymph node and have smaller tumor volumes and better patient survival (9). In addition to breast and prostate cancers, ATBF1 was also reported to be involved in the development of other types of cancers including gastric, cervical, and hepatocellular carcinomas (10–12). Our examination of the amino acid sequence of ATBF1 revealed multiple putative nuclear receptor boxes, including one consensus LXXLL motif and 31 of its variants LXXXL in the ATBF1 protein (13). These nuclear receptor boxes are often found in the coactivators and corepressors of nuclear receptors for the binding to nuclear receptors. We demonstrated that ATBF1 inhibits estrogen-mediated cell proliferation and gene regulation in ER-positive breast cancer cells by selectively competing for binding to the ER with the ER coactivator amplified in breast cancer 1 (AIB1) (13). AIB1 is the only SRC family member that is amplified and overexpressed in human breast cancer and is essential for breast oncogenesis (14–16). Our findings suggest a negative relationship between ATBF1 and estrogen-ER signaling. In another independent study, however, the mRNA level of ATBF1 was found to be significantly higher in ER-positive breast cancers (9), suggesting an uncommon regulatory relationship between ATBF1 and estrogen-ER signaling.
In this study we examined whether estrogen regulates ATBF1. We found that estrogen-ER signaling regulates ATBF1 by inducing its transcription while causing its protein degradation. Together with our earlier study (13), these results establish an autoregulatory feedback loop between ATBF1 and estrogen-ER signaling.
EXPERIMENTAL PROCEDURES
Constructs, Cell Lines, and Reagents
For details, see supplemental Materials and Methods.
RNA interference (RNAi)
RNAi against ATBF1 and ER genes was performed as previously described (13). Four ATBF1-specific siRNAs targeting different regions of the ATBF1 gene and the negative control siRNA against the luciferase gene, which does not match any human genomic sequences, were also described previously (13). A siRNA pool containing three to five ER-specific siRNAs was purchased from Santa Cruz Biotechnology for RNAi against the ER gene.
Gene Expression Analysis
Gene expression was quantified by real time PCR as described in our previous studies (17, 18). Primer sequences for all the genes are listed in supplemental Table S1.
Promoter-Luciferase Reporter Assay
Promoter-luciferase reporter assay was performed as previously described (13, 19).
Chromatin Immunoprecipitation (ChIP) Assay
ChIP assay was performed using a ChIP assay kit (Millipore) as described previously (13). Precipitated DNA was analyzed by regular and real-time PCR with ATBF1 promoter-specific primers F1/R1, F2/R2, and F3/R3. Human Myc and β-actin genes were used as positive and negative controls for ER binding, respectively (20). Primer sequences for promoters of ATBF1, Myc, and human β-actin genes are listed in supplemental Table S2.
Oligonucleotide Pulldown and Western Blot Analysis
Oligonucleotide pulldown and Western blot analysis were performed as described in a previous study (21). Biotin-modified oligonucleotides for EB9, EB9m, F1R1, F2R2, F3R3, F4R4, Dm1, Dm2, Dm3, Dm4, Dm5, and Dm6 were obtained by PCR with 5′-biotin-modified primers. Primer sequences for oligonucleotides F1R1, F2R2, and F3R3 were the same as those for F1/R1, F2/R2, and F3/R3 in ChIP assays as described above, and those for oligonucleotide F4R4 are listed in supplemental Table S2. The oligonucleotide EB9m, from EB9 but with mutations in its estrogen-responsive element (ERE), was obtained by the recombinant PCR mutagenesis method. Primer sequences for EB9, EB9m, Dm1, Dm2, Dm3, Dm4, Dm5, and Dm6 are listed in supplemental Table S3. Biotin-modified oligonucleotides oEB9, oEB9m, oEB9m′, Dm7, Dm7m, Dm7m′, and Dm8 were synthesized and annealed. Their sequences are listed in supplemental Table S3. Oligonucleotides from deletion mutants 1–8 (Dm1 to Dm8) were deletion mutants of the oligonucleotide F3R3. Oligonucleotides oEB9m and Dm7m were the same as oEB9 and Dm7, respectively, except that their EREs were mutated. Oligonucleotides oEB9m′ and Dm7m′ were mutants of oEB9 and Dm7, respectively, in which nucleotides GC were mutated into A or T, but the EREs were retained.
Oligonucleotide Pulldown Assay with in Vitro-translated and Purified Recombinant ER
In vitro-translated ER protein was produced in the presence of [35S]methionine (GE Healthcare) using the TNT® Quick-coupled Transcription/Translation System (Promega) according to the user's manual. Purified recombinant ER protein with a C-terminal FLAG tag was purchased from OriGene Technologies. Ten μl of in vitro translated or two μg of purified recombinant ER protein were used in each oligonucleotide pulldown assay as described above.
Cycloheximide Chase Assay
MCF7 cells grown in hormone-free media for 3 days were seeded into 12-well plates at a density of 1 × 10⁵ cells/well. The next day cells were treated with 1 μm E2 or alcohol (solvent control). Eight hours after E2 treatment, cells were treated with 50 μg/ml of cycloheximide (a protein synthesis inhibitor) at different time points (0, 2, 4, and 6 h). Total proteins were collected, separated in SDS-PAGE gels, and subjected to Western blot analysis for ATBF1 and β-actin. Band intensities were measured using the Image J program (rsb.info.nih.gov). ATBF1 protein levels were normalized against respective β-actin protein levels for different time points of cycloheximide treatment.
Cell Proliferation Assay
Cell proliferation assay was performed as previously described (13, 19).
Statistical Analysis
Student's t test or Fisher's exact test were used to determine statistical differences. p values of 0.05 or smaller were considered statistically significant.
RESULTS
Knockdown of ER Down-regulates the Expression of ATBF1 at Both mRNA and Protein Levels
To further understand the regulatory relationship between ATBF1 and estrogen-ER signaling, we knocked down the expression of ER in MCF7 cells grown in normal media by an ER-specific siRNA pool and analyzed the expression of ATBF1 and ER by real-time PCR and Western blotting. MCF7 is a wildly used ER-positive breast cancer cell line, and it also expresses higher levels of ATBF1 mRNA and protein (13). As a candidate tumor suppressor gene, higher levels of ATBF1 in MCF7 cells may be important for certain unknown events (22). Although ER mRNA expression was knocked down by 90%, its protein expression was reduced by 81%. Meanwhile, knockdown of ER reduced ATBF1 mRNA by 50% and ATBF1 protein by 25% (Fig. 1, A and B). We also knocked down ATBF1 expression in MCF7 cells and examined expression changes of ER at both mRNA and protein levels (Fig. 1, C and D). Although ATBF1 mRNA expression was knocked down by 79% and ATBF1 protein by 74%, few changes were observed on the expression level of either ER mRNA or protein (Fig. 1, C and D). These results suggest that estrogen-ER signaling can up-regulate the expression of ATBF1 mRNA and protein in ER-positive breast cancer cells.
FIGURE 1.

Knockdown of ER down-regulates the expression of ATBF1 at both mRNA and protein levels in MCF7 breast cancer cells. Real time PCR was used to analyze mRNA expression (A and C) and Western blotting for protein expression (B and D). *, p < 0.05; **, p < 0.005; n.s., not significant. siLuc, siER, and siATBF1 are siRNAs against the luciferase, ER, and ATBF1 genes, respectively. For panels B and D, band intensities were determined by using the Image J program, and the ratio of the target protein to β-actin was calculated and provided under each panel.
Estrogen Up-regulates the Transcription of ATBF1
To further examine the function of estrogen-ER signaling in the regulation of ATBF1, we analyzed the expression of ATBF1 mRNA in MCF7 cells treated with E2 for different times or at different concentrations. The EFP (estrogen-responsive finger protein) gene, a well established estrogen-responsive gene, was used as the positive control. We found that ATBF1 mRNA was up-regulated by E2 treatment in a time- and dose-dependent manner (Fig. 2, A and B). We also treated MCF7 cells grown in either normal or hormone-free medium with the selective estrogen receptor modulator tamoxifen and tested whether tamoxifen inhibited ATBF1 expression. With c-Myc as the positive control, we found that tamoxifen had no effect on the expression of ATBF1 mRNA and protein in these cells (data not shown), although ATBF1 mRNA was up-regulated by estrogen. We next constructed an ATBF1 promoter-luciferase reporter plasmid, pATBF1-Luc1, that contained 3551 bp of genomic DNA of the ATBF1 gene, including a part of its exon 1 and upstream sequence (Fig. 2C), and evaluated the effect of estrogen on the activity of the ATBF1 promoter in different cell lines. In ER-positive MCF7 and T-47D cell lines, E2 treatment significantly increased ATBF1 promoter activities as determined by luciferase assays (Fig. 2D). In ER-negative MDA-MB-231 and 22Rv1 cell lines, reexpression of ER increased ATBF1 promoter activities to certain extent without E2 treatment, but a combination of ER expression and E2 treatment dramatically increased the activity (Fig. 2E). Without ER expression, E2 did not induce any promoter activities in either MDA-MB-231 or 22Rv1 cells (Fig. 2E), indicating the necessity of ER in the estrogen-induced ATBF1 promoter activity. These results further support the up-regulation of ATBF1 transcription by estrogen-ER signaling.
FIGURE 2.

Estrogen up-regulates the transcription of ATBF1. A and B, estrogen-induced time (A)- and dose-dependent (B)-expression of ATBF1 mRNA in MCF7 cells treated with E2 as indicated was determined by real time PCR. EFP, a well established estrogen-responsive gene, served as the positive control. *, p < 0.05; **, p < 0.01; ***, p < 0.005. In panel B, upper asterisks are for ATBF1, and lower asterisks are for EFP. C, a schematic of the 3.55-Kb ATBF1 promoter DNA and three fragments used in promoter-luciferase reporter constructs is shown. The transcription initiation site (+1) is based on ATBF1 mRNA with the GenBankTM accession number NM_006885. The start and end sites of the promoter DNAs in the three constructs are indicated by vertical lines relative to the 3.55-kb promoter DNA. The arrow at the right and the arrow head at the left indicate the locations of the half-ERE site from this study and the ER binding site defined by genome-wide ChIP-Seq analysis respectively. D and E, shown are luciferase activities of the pATBF1-Luc1 reporter in ER-positive breast cancer cell lines MCF7 and T-47D (D) and ER-negative cancer cell lines MDA-MB-231 and 22Rv1 (E). Cells were cultured in hormone-free media for 3 days before plasmid transfection. E2 treatment was 1 μm for 24 h. The expression construct of ER (pCMV-ER) was co-transfected into ER-negative cell lines. Asterisks indicate statistical differences in luciferase activities between ER-cotransfected and control cells, and number signs indicate differences between E2-treated and control cells. *, p < 0.005; **, p < 0.001; ##, p < 0.001; n.s., not significant. F, transcriptional activities of the three different ATBF1 promoter-luciferase reporter constructs pATBF1-Luc1, pATBF1-Luc2, and pATBF1-Luc3 in MCF7 cells with or without E2 treatment. Asterisks indicate statistical differences in luciferase activities between different constructs under the same condition of E2 treatment, and number signs indicate differences between E2 and alcohol treatments for the same construct. One * or #, p < 0.01; two * or #, p < 0.005; three * or #, p < 0.001.
To narrow the region of the ATBF1 promoter that is regulated by estrogen, we constructed two additional ATBF1 promoter-luciferase reporter plasmids, pATBF1-Luc2 and pATBF1-Luc3, in which the ATBF1 promoter in pATBF1-Luc1 was truncated to different sizes at the 5′-end (Fig. 2C). The activities of the three ATBF1 promoter reporters were analyzed in MCF7 cells treated with E2 or alcohol. All three ATBF1 promoter reporters showed significant promoter activities regardless of E2 treatment (Fig. 2F). However, E2 treatment significantly increased the promoter activities, suggesting that all three reporter constructs contain the potential ERE in the ATBF1 promoter, which may be responsible for the up-regulation of ATBF1 by estrogen. With or without E2 treatment, the activities of pATBF1-Luc2 were not significantly different from those of pATBF1-Luc1 but were significantly higher than those of pATBF1-Luc3 (Fig. 2F). These results suggest that the pATBF1-Luc2 construct contains the active promoter of ATBF1, which is also estrogen-responsive, and the potential ERE resides in the constructs of pATBF1-Luc2 and pATBF1-Luc3.
Estrogen Induces the Binding of the ER onto the ATBF1 Promoter
Time- and dose-dependent induction of ATBF1 mRNA by E2 (Fig. 2, A and B) suggests that ATBF1 is a target gene of ER (23, 24). As the first step in testing this possibility, we performed ChIP assays to determine whether estrogen induces the binding of the ER onto the promoter of ATBF1. Based on the results of ATBF1 promoter activities (Fig. 2, C–F), we designed three pairs of PCR primers that amplify the ATBF1 promoter DNA: F1/R1, F2/R2, and F3/R3 (Fig. 3A). MCF7 cells grown in regular media were lysed to prepare the chromatin DNA (Fig. 3B) and then subjected to ChIP with anti-ER antibody. Both regular and real time PCR analyses showed that although the ATBF1 promoter DNA was detected in the precipitated DNA by all three pairs of primers, the DNA amplified by F3/R3 was the most abundant followed by F2/R2, suggesting that estrogen up-regulates the transcription of ATBF1 by inducing the binding of the ER onto the ATBF1 promoter, and the potential ER binding site resides in or near the fragment amplified by primers F3 and R3 (Fig. 3, A, C, and D). Sequence analysis did reveal a half-ERE (5′-TGACCT-3′), which can be bound by ER (23, 25), in the fragment amplified by F3 and R3 (Fig. 3A).
FIGURE 3.

E2-induced binding of the ER onto the ATBF1 promoter, as determined by ChIP assays. A, shown is a schematic of the ATBF1 promoter from −1589 to +597 and relative locations of four pairs of PCR primers, F1/R1, F2/R2, F3/R3, and F4/R4, and their PCR product sizes used in the ChIP and/or oligonucleotide pulldown assays. The arrow at the right and the arrowhead at the left indicate positions of the half-ERE and the ER binding site defined by genome-wide ChIP-Seq analysis respectively. B, the size range of the chromatin DNA used in ChIP assays as analyzed by agarose gel electrophoresis is shown. M, DNA marker; Ch, chromatin DNA. C, detection of the ATBF1 promoter in the chromatin DNA precipitated by the antibody against ER (aER) in MCF7 cells cultured in normal media. IgG served as the negative control for ChIP. The c-Myc and β-actin genes served as positive and negative controls, respectively, for ChIP, and H2O served as the negative control for PCR. D, detection of the same DNA from panel C by real time PCR is shown. Input reading was defined as 1 for each pair of primers, and the readings for against ER (aER), IgG, and H2O were normalized accordingly. *, p < 0.05; **, p < 0.005; ***, p < 0.001 when compared with their respective IgG controls. E and F, estrogen causes the recruitment of ER onto the ATBF1 promoter. MCF7 cells treated with 1 μm E2 for 0, 45, and 135 min were subjected to ChIP, and the precipitated DNA was analyzed by regular PCR (E) and real time PCR (F). Experimental conditions are identical to those in panels C and D, except that cells were cultured in hormone-free media for 3 days before E2 treatment. n.s., not significant; *, p < 0.05; **, p < 0.005; ***, p < 0.001 when compared with their respective IgG controls at the same time points.
ER cycles onto and off promoters of its target genes in response to E2. Its promoter occupancy peaks at 45 and 135 min post-E2 treatment (24). To determine whether the binding of the ER onto the ATBF1 promoter fits the model for ER target genes, we examined the binding at different time points after E2 treatment. MCF7 cells were cultured in hormone-free media for 3 days, and E2 treatment at 1 μm was applied for different time points. Similar to the ER target gene c-Myc, ER occupancy on the ATBF1 promoter was hardly detectable without E2 treatment but was dramatically increased by E2 treatment for both 45 and 135 min (Fig. 3, E and F).
There are several genome-wide ChIP-Seq studies for ER binding sites in MCF7 cells treated with E2 (26, 27). To determine whether ATBF1 was identified as an ER target gene in these studies, we scanned their datasets with the active ATBF1 promoter contained in the pATBF1-Luc2 construct (Fig. 2). A high confidence ER binding site, which was between ER binding regions identified by F1/R1 and F2/R2 and very close to the F2/R2 region, was consistently identified by these studies (Figs. 2C and 3A). Taken together, these data suggest that estrogen induces the binding of the ER onto the promoter of ATBF1 and that ATBF1 is an ER target gene.
The Half-ERE in the ATBF1 Promoter Is Essential for ER Binding
In regulating the transcription of its target genes, ER either directly binds onto gene promoters or indirectly binds through an as yet not fully characterized mechanism involving other transcription factors (23). Direct promoter binding usually involves an ERE with a typical consensus sequence of 5′-AGGTCAnnnTGACCT-3′ or a half-ERE positioned next to GC-rich regions in their promoters (28), whereas indirect binding does not involve the ERE (29). The ATBF1 promoter has a half-ERE (5′-TGACCT-3′) at ∼750 bp upstream to its translation start site (Fig. 3A), which is surrounded by GC-rich regions.
To test whether the half-ERE is involved in ER binding onto the ATBF1 promoter, we performed a series of oligonucleotide pulldown experiments. We first used cell lysate from MCF7 cells cultured in normal media as the source of endogenous active ER. Biotinylated DNA fragments produced from primer pairs of F1/R1, F2/R2, and F3/R3 were first analyzed. The EB9 oligonucleotide, which spans a 254-bp promoter of ER target gene EBAG9 and contains an ERE (23), efficiently pulled down ER (Fig. 4A) and was used as the positive control for longer oligonucleotides F1R1, F2R2, and F3R3. The oEB9 oligonucleotide, which is a shorter version of EB9 (30 bp long) and still contains the ERE, also efficiently pulled down ER (Fig. 4B) and was used as the positive control for shorter oligonucleotides. Mutation of the ERE in both EB9 and oEB9 abolished their binding to ER, so EB9m and oEB9m were used as negative controls (Fig. 4, A and B). Binding specificity was confirmed by competition experiments using non-biotin-modified EB9 or oEB9 as the competitor (Fig. 4, A and B, panels at right). Compared with established positive and negative controls, the F3R3 oligonucleotide but not F1R1 or F2R2 efficiently pulled down ER, and the unbiotinylated F3R3 blocked the pulldown of ER (Fig. 4C). Oligonucleotide F4R4, which contains the high confidence ER binding site defined by genome-wide ChIP-Seq studies, could not pull down ER (Fig. 4D). The half-ERE is only present in the F3R3 oligonucleotide, not in F1R1, F2R2, or F4R4 (Fig. 3A), suggesting the half-ERE in the F3R3 oligonucleotide mediates the pulldown. Eight different deletion mutants covering different regions of the F3R3 oligonucleotide were prepared and analyzed in pulldown assays, and all the mutants containing the half-ERE, including Dm1, Dm3, Dm5, and Dm7 with sizes of 120, 80, 60, and 30-bp, respectively, efficiently pulled down ER (Fig. 4, E–G). None of the deletion mutants without the half-ERE, including Dm2, Dm4, Dm6, or Dm8, pulled down ER under the same conditions (Fig. 4, E–G). When the half-ERE in Dm7 was mutated, ER could no longer be pulled down (Fig. 4H). These results indicate that the half-ERE is essential for ER binding onto the ATBF1 promoter.
FIGURE 4.

The half-ERE in the ATBF1 promoter is essential for ER binding as detected by the oligonucleotide pulldown assay. A and B, establishment of positive and negative controls for the oligonucleotide pulldown assay is shown. Cell lysates from MCF7 cells cultured in normal media were incubated with control biotin-modified oligonucleotides EB9, EB9m, oEB9, and oEB9m in the pulldown assay. Competition experiments using increasing amounts of non-biotin-modified oligonucleotides for EB9 and oEB9 were also performed. Western blotting was performed to detect ER in the precipitated oligo-protein complexes. C, shown is pulldown of ER by the F3R3 oligonucleotide but not by F1R1 or F2R2. Conditions for pulldown and competition experiments were identical to those in panels A and B. EB9 and EB9m served as positive and negative controls, respectively. D, ER could not be pulled down by the F4R4 oligonucleotide that spans the ER binding site defined by genome-wide ChIP-Seq analysis in the ATBF1 promoter. F3R3 and EB9m were used as positive and negative controls respectively. E, shown is a schematic of different deletion mutants (Dm) of the F3R3 oligonucleotide in the ATBF1 promoter. Names of oligonucleotides are at the left, and their sizes are at the right. The location of the half-ERE (ERE1/2) is boxed by a gray line. Solid black lines identify deletion mutants that are still bound by ER. F and G, shown are representative pulldown results for the identification of the minimal ER-bound oligonucleotide in the ATBF1 promoter using the same conditions as in panel C. H, shown is a mutation of the half-ERE (Dm7m) abolishes the binding of the ER onto the ATBF1 promoter.
ER Directly Binds onto the Half-ERE on the ATBF1 Promoter
To determine whether the binding of the ER onto the half-ERE in the ATBF1 promoter is direct or mediated by other transcription factors, we first performed oligonucleotide pulldown experiments using in vitro translated ER protein in the presence and absence of E2. With oEB9 and oEB9m as positive and negative controls (Fig. 5A), we found that Dm7 was able to pull down in vitro translated ER, and the presence of E2 might enhance the effect (Fig. 5B). Mutation of the half-ERE in the Dm7 abolished the pulldown of ER (Fig. 5B).
FIGURE 5.
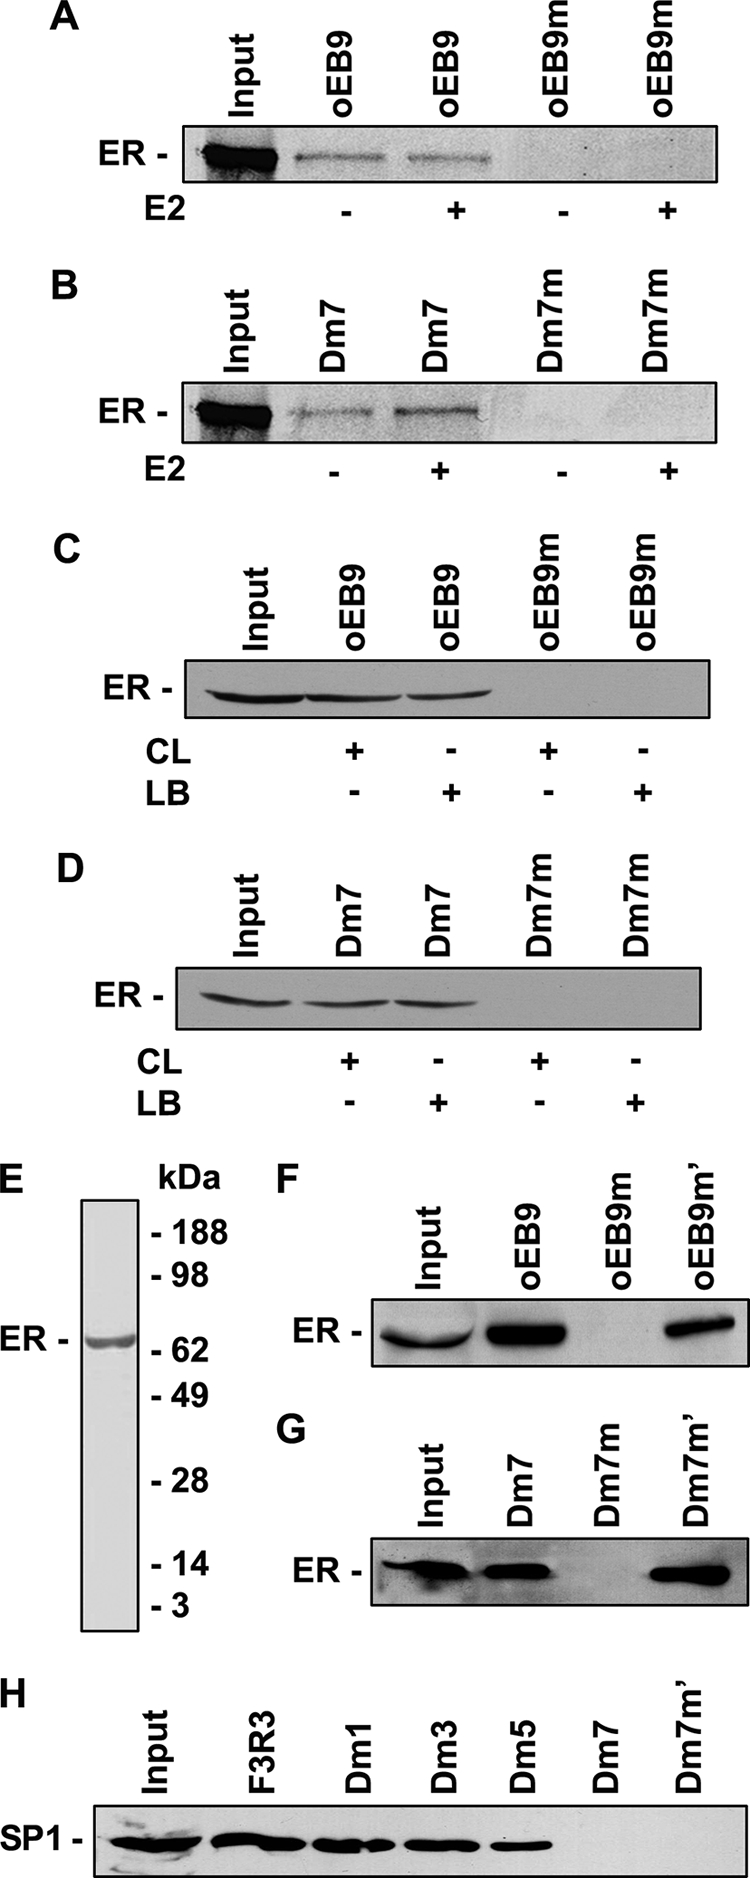
ER directly binds onto the half-ERE site in the ATBF1 promoter as detected by oligo pulldown assays. A and B, in vitro translated 35S-labeled ER protein binds onto the wild type oEB9 and half-ERE site in Dm7 but not their mutants. C and D, the purified recombinant ER protein can bind onto the wild type oEB9 and half-ERE site in Dm7 but not their mutants regardless of the presence of other transcription factors. CL, cell lysates from MCF7 cells, which were used as the source of other transcription factors. LB, lysis buffer. Western blotting was performed with anti-FLAG antibody to detect and distinguish the recombinant FLAG-tagged ER protein from the endogenous ER protein in MCF7 cell lysates. E, the purity of the purified recombinant ER protein, as determined by SDS-PAGE and Coomassie Blue staining provided by the manufacturer is shown. F and G, mutation of nucleotides G and C into A or T in oEB9 and Dm7 abolishes the binding of the ER onto the ERE in oEB9 (F) and the half-ERE in Dm7 (G). H, SP1 transcription factor is dispensable for the binding of the ER onto the half-ERE in Dm7, although it could be involved in ER binding onto oligonucleotides F3R3, Dm1, Dm3, and Dm5.
To rule out the possibility that transcription factors in the TNT® Quick-coupled Transcription/Translation System, which was used to produce in vitro-translated ER protein, may assist the binding of in vitro translated ER onto the half-ERE in the ATBF1 promoter, we then performed oligonucleotide pulldown experiments using recombinant ER protein purified from human HEK293 cells, which had a FLAG tag at its C terminus. MCF7 cell lysate was used as a control with additional transcription factors and the lysis buffer as the negative control. With oEB9 and oEB9m as positive and negative controls in which the ERE could be directly bound by E2 in the absence of other transcription factors (Fig. 5C), we found that Dm7 could pull down purified recombinant ER protein when incubated with either the MCF7 cell lysate or the lysis buffer (Fig. 5D). When the half-ERE in Dm7 was mutated, purified recombinant ER protein could no longer be pulled down (Fig. 5D). The purity of the recombinant ER protein was determined by SDS-PAGE and Coomassie Blue staining (Fig. 5E).
Because indirect binding of the ER onto gene promoters involves the binding of other transcription factors such as SP1 (23), we next examined whether mutation of all the GC nucleotides in Dm7 could abolish the ER binding. With mutants oEB9m′ and oEB9m as positive and negative controls, respectively (Fig. 5F), we found that the mutant Dm7m′ could still pull down ER (Fig. 5G). We furthermore demonstrated that the SP1 transcription factor was not needed for the binding of the ER onto the half-ERE in Dm7 despite that it was involved in ER binding onto oligonucleotides F3R3, Dm1, Dm3, and Dm5 (Fig. 5H). Taken together, these results suggest that ER can directly bind onto the ATBF1 promoter at the half-ERE site.
Estrogen Causes the Degradation of ATBF1 Protein
Although the knockdown of ER reduced the expression of ATBF1 at both mRNA and protein levels (Fig. 1), the reduction at the mRNA level was 50% but only 26% at the protein level (Fig. 1, A and B). In addition, although the mRNA level of ATBF1 was positively associated with ER and better patient survival in breast cancer, its protein expression did not correlate with mRNA expression (9). These findings suggest that ATBF1 may be regulated differently at mRNA and protein levels in breast cancer. We, therefore, further investigated the effect of estrogen-ER signaling on ATBF1 protein expression. ATBF1 protein was measured by Western blotting in MCF7 cells treated with different concentrations or different times of the same concentration of E2. We found that E2 treatment increased ATBF1 protein levels within 2 h but decreased ATBF1 protein expression after 2 h, with about 65 and 31% of ATBF1 protein remaining at 4 and 8 h post-treatment, respectively (Fig. 6A). In the dose-dependent analysis, ATBF1 protein expression appeared to be increased by 0.01 and 1 nm of E2 treatment for 24 h (Fig. 6B), but increased concentrations of E2 (1 nm to 1 μm) significantly decreased the level of ATBF1 protein to about 48% or less (Fig. 6B). These results indicate that, whereas ATBF1 protein expression could be increased by lower concentrations or shorter times of E2 treatment, higher concentrations or longer times of E2 treatment down-regulated ATBF1 protein.
FIGURE 6.

Estrogen causes the degradation of ATBF1 protein. A and B, detection of ATBF1 protein by Western blotting in MCF7 cells treated with E2 at 1 μm for different times (A) or at different concentrations for 24 h (B) is shown. C, detection of ATBF1 protein by Western blotting in 22Rv1 cells transfected with HA-tagged ATBF1 and/or ER and treated with 1 μm E2 for 24 h is shown. D, detection of ATBF1 protein in 22Rv1 cells cotransfected with ATBF1 and ER expression plasmids and then treated with E2 at different concentrations for 24 h is shown. E and F, E2 treatment shortens the half-life of ATBF1 protein in MCF7 cells, as determined by cycloheximide chase assay and Western blotting (E). Band intensities for ATBF1 and β-actin were quantified by using the Image J program, and the ratios of ATBF1 to β-actin were calculated and provided under each panel. F, band intensities for both E2 and alcohol groups of panel E in triplicate were plotted and statistically analyzed over times of treatment, with the readings at the time point of 0 defined as 1 and others normalized accordingly. *, p < 0.05 when comparing E2 and alcohol groups at the same time point.
To confirm the down-regulation of ATBF1 protein expression by estrogen-ER signaling, we transfected the ATBF1 expression plasmid along with ER expression plasmid or vector control into ER and ATBF1 double-negative 22Rv1 cells, which do not express ER (30) and have a frameshift mutation that truncates the majority of ATBF1 protein (8). Transfected cells were then treated with E2 or alcohol. When ER was coexpressed, E2 treatment dramatically reduced ATBF1 protein levels (Fig. 6C, left panel). Without ER expression, however, E2 had no detectable effect on ATBF1 protein levels (Fig. 6C, right panel). Unlike in MCF7 cells, where endogenous ATBF1 mRNA can translate into ATBF1 protein, transfected ATBF1 protein expression in 22Rv1 cells was constantly decreased by increased concentrations of E2 treatment (Fig. 6D), suggesting that estrogen-mediated ATBF1 transcriptional up-regulation is responsible for the increase of ATBF1 protein levels in MCF7 cells by lower concentrations or shorter times of E2 treatment.
To evaluate whether the down-regulation of ATBF1 protein by estrogen-ER signaling is due to protein degradation or other mechanisms, we measured the level of endogenous ATBF1 protein in MCF7 cells treated with cycloheximide for different times. Without E2 treatment, the ATBF1 protein level decreased with cycloheximide treatment, suggesting that ATBF1 protein undergoes degradation (Fig. 6, E and F). When E2 treatment was applied, the decrease in the ATBF1 protein level was significantly faster compared with cells without E2 treatment (Fig. 6, E and F). These results suggest that endogenous ATBF1 protein is unstable and that estrogen-ER signaling facilitates the degradation of ATBF1 protein.
Proteasome Inhibitors Stabilize ATBF1 Protein
Ubiquitin-mediated proteolysis plays an important role in the control of many proteins in estrogen-ER signaling (31). Therefore, we tested whether the ubiquitin proteasome pathway is involved in the estrogen-mediated degradation of ATBF1 protein. We treated MCF7 cells, which were cultured in hormone-free media for 3 days and subsequently treated with 1 μm E2 for 24 h, with different inhibitors of the proteasome pathway. We found that ATBF1 protein was hardly detectable in the control group, but each of the proteasome inhibitors tested, including MG132, MG115, PS341, and epoxomicin, increased ATBF1 protein levels (Fig. 7A). Among these proteasome inhibitors, MG132 had the strongest effect, so we examined the effect of different concentrations of MG132 (4 h) on ATBF1 protein in MCF7 cells treated with E2. A dose-dependent increase in the ATBF1 protein level was observed (Fig. 7B). At 20 μm, MG132 also demonstrated a time-dependent increase in ATBF1 protein levels (Fig. 7C). In 22Rv1 cells transfected with ATBF1 and ER and treated with E2, proteasome inhibitors also interrupted the degradation of ATBF1 protein (data not shown). Taken together, these results suggest that the estrogen-mediated degradation of ATBF1 protein involves the ubiquitin proteasome pathway.
FIGURE 7.

The proteasome system is responsible for the estrogen-mediated protein degradation of ATBF1. A, shown are ATBF1 protein levels in MCF7 cells treated with different proteasome inhibitors including MG132, MG115, PS-341, and epoxomicin (Epox). All treatments were for 4 h (h). B, dose-dependent inhibition of ATBF1 protein degradation in MCF7 cells by different concentrations of MG132 for 4 h is shown. C, time-dependent inhibition of ATBF1 protein degradation in MCF7 cells by 20 μm MG132 for different times is shown. Prior to treatment with proteasome inhibitors, MCF7 cells were treated with 1 μm E2 for 24 h. D, an autoregulatory feedback loop between ATBF1 and estrogen-ER signaling is shown. Rectangle and oval ATBF1 represents ATBF1 mRNA and protein, respectively. The question mark represents the E3 ubiquitin ligase that is responsible for ATBF1 protein degradation, which remains to be identified.
ATBF1 Inhibits Cell Proliferation Caused by Lower Levels of Estrogen
Certain molecules possess dual roles in regulating cell behaviors upon different signaling stimuli (32, 33). We demonstrated that ATBF1 inhibited cell proliferation stimulated by 1 μm E2 (13), and consistently 1 μm E2 could significantly decrease ATBF1 protein levels (Fig. 6B). In this study, however, we further found that estrogen at lower levels could increase ATBF1 protein expression. It is possible that ATBF1 has a different role at lower levels of E2. Therefore, we performed cell proliferation assays to test whether ATBF1 still inhibited cell proliferation stimulated by lower levels of E2. We found that knockdown in MCF7 cells and overexpression in T-47D cells of ATBF1 significantly promoted and inhibited, respectively, cell proliferation stimulated by lower levels of E2 (10−3 and 10−5) (Fig. 8). These results suggest that ATBF1 inhibits cell proliferation stimulated by lower levels of E2 even though lower levels of estrogen could increase ATBF1 protein expression.
FIGURE 8.

ATBF1 inhibits cell proliferation caused by lower levels of estrogen. ER-positive breast cancer cell lines MCF7 (A) and T-47D (B) were treated with 10−3 or 10−5 μm E2. In MCF7 cells where ATBF1 is expressed, ATBF1 was knocked down by RNAi (A), whereas in T-47D cells, where ATBF1 express is hardly detectable, ATBF1 expression plasmid was transfected (B). Knockdown of ATBF1 in MCF7 cells enhanced cell proliferation by 95 and 54% E2 treatments of 10−3 and 10−5 μm respectively, whereas it had no significant effect in cells without E2 treatment (A). Overexpression of ATBF1 in T-47D cells had no significant effect in the absence of E2 but significantly inhibited cell proliferation by 36 and 43% in the presence of 10−3 and 10−5 μm E2 respectively (B). C, knockdown in MCF7 cells and overexpression in T-47D cells of ATBF1 were confirmed by Western blotting. n.s., not significant; *, p < 0.05; **, p < 0.005; ***, p < 0.001. SiLuc, siRNA against the luciferase gene (negative control); siATBF1, ATBF1 siRNA.
Among 32 Tumor Suppressor Genes Examined, None Is Regulated by Estrogen-ER Signaling Like ATBF1
As a potential tumor suppressor in breast cancer, ATBF1 appears to have an unusual regulatory relationship with estrogen-ER signaling, because on one hand ATBF1 inhibits estrogen-ER signaling (13), whereas on the other hand estrogen up-regulates ATBF1 mRNA but induces protein degradation of ATBF1 (Figs. 1–6). To evaluate whether other tumor suppressors in breast cancer have a similar pattern of regulatory relationship with estrogen-ER signaling as ATBF1, we extracted expression data from multiple microarray analyses collected in the Gene Expression Metasignatures (GEMS) data base (34) and analyzed the expression of 32 established breast cancer suppressor genes that were selected based on published data (references not shown). These genes included α-catenin, BRCA1, BRCA2, DBC2, CDH1, FEZ1, FKHR, ING1, KLF5, LKB1, NF1, p15, p16, p18, p19, p21, p27, p53, p57, PDCD4, PTEN, Rb, SASH1, SMAD4, SOX7, ST7, ST18, TSC1, TSC2, VHL, WISP3, and WT1. Except for FKHR, SOX7, and BRCA1, none of the remaining 29 genes were up-regulated by estrogen-ER signaling at the transcriptional level (supplemental Table S4). Although FKHR or SOX7 are not represented in the probe sets of the latest version of GMES, BRCA1 mRNA expression was significantly up-regulated by estrogen-ER signaling at both summarized earlier (3–4 h) and later (24 h) GEMS datasets (supplemental Table S4). We then conducted real time PCR to confirm the array data. In MCF7 cells treated with E2 for 4 and 24 h, whereas many of the 32 genes were significantly down-regulated by E2, none was significantly up-regulated, including FKHR, SOX7, or BRCA1 (supplemental Fig. S1). Except for BRCA1, our results were consistent with the array data. We then extracted the detailed expression data for BRCA1 in each microarray analyses and found that among five early and seven late GMES datasets available, only one earlier (one of five) and three later (three of seven) datasets showed significant up-regulation of BRCA1 mRNA by E2 treatment (supplemental Table S5), suggesting that the regulation of BRCA1 by estrogen-ER signaling is different from that of ATBF1. To further rule out the possibility, we cotransfected BRCA1 and ER expression plasmids into 22Rv1 cells, treated them with E2, and found that BRCA1 protein levels were not affected by estrogen-ER signaling (supplemental Fig. S2). Taken together, these results further suggest an unusual regulatory relationship between ATBF1 and estrogen-ER signaling.
DISCUSSION
Estrogen up-regulates the transcription of ATBF1 via the direct binding of the ER onto a half-ERE in the ATBF1 promoter. Although our previous study revealed a suppressive function of ATBF1 in estrogen-ER signaling (13), our continued examination of the regulatory relationship between ATBF1 and estrogen-ER signaling in this study indicates that estrogen up-regulates the transcription of ATBF1 in ER-positive breast cancer cells, which is somewhat unexpected. This conclusion is based on multiple lines of evidence, including time- and dose-dependent induction of ATBF1 mRNA by estrogen (Fig. 2), down-regulation of ATBF1 mRNA by the knockdown of ER expression (Fig. 1), and induction of activities of the ATBF1 promoter by estrogen in multiple cell lines (Fig. 2). Similar to typical ER target genes, the up-regulation of ATBF1 mRNA by estrogen is mediated by the direct binding of the ER onto its promoter. A consensus half-ERE in the ATBF1 promoter, located ∼750 bp upstream to the translation start site, is essential for the binding of the ER onto the ATBF1 promoter, as revealed by the ChIP and oligonucleotide pulldown experiments (Figs. 3 and 4).
Higher levels of estrogen cause the degradation of ATBF1 protein by the proteasome system. Consistent with transcriptional up-regulation by estrogen in ER-positive breast cancer cells, the level of ATBF1 protein was increased by lower concentrations or shorter times of estrogen treatment. Unexpectedly, higher concentrations or longer times of estrogen treatments decreased the level of ATBF1 protein (Fig. 6, A and B). Our further analyses indicate that the proteasome pathway is activated by estrogen to mediate the degradation of ATBF1 protein, as estrogen-ER signaling also induced the degradation of ectopically expressed ATBF1 protein (Fig. 6, C and D), the degradation was independent of protein synthesis (Fig. 6, D–F), and proteasome inhibitors protected ATBF1 protein from degradation (Fig. 7, A–C). The ubiquitin-mediated proteasome pathway is the most common mechanism for protein degradation, and E3 ubiquitin ligases play an essential role in this pathway. It has been established that estrogen activates the proteasome pathway, and some estrogen-responsive E3 ubiquitin ligases have been identified, including SKP2, Cul-4A, E6-AP, EFP, BCA2, MDM2, and RNF11 (35, 36). At present, we have identified EFP as an E3 ubiquitin ligase that is involved in estrogen-induced ATBF1 protein degradation.3
ATBF1 appears to have an autoregulatory feedback loop with estrogen-ER signaling. A previous study has demonstrated that ATBF1 inhibits estrogen-mediated gene transcription and cell proliferation in ER-positive breast cancer cells, and the inhibition is mediated by a physical interaction between ATBF1 and ER that prevents the interaction between ER and its coactivator AIB1 (13). Taken together with the findings described above that less active estrogen-ER signaling induces ATBF1 protein levels but more active estrogen-ER signaling causes the decrease of ATBF1 protein levels, there appears to be an autoregulatory feedback loop between ATBF1 and estrogen-ER signaling (Fig. 7D). Although estrogen-ER signaling provides the positive signal for cell proliferation, ATBF1 could impose a constraining role to prevent overactive estrogen-ER signaling. Estrogen-ER signaling in turn balances the constraining effect of ATBF1 by transcriptional and posttranslational regulation. Estrogen-ER signaling up-regulates a number of genes that in turn enhance the function of the ER, including AIB1, HER-2/neu, and IGF1R (37–39). To the best of our knowledge, ATBF1 appears to be the first gene that has an autoregulatory negative feedback loop with estrogen-ER signaling,.
In normal ER-positive breast epithelial cells, estrogen may induce ATBF1 to restrain its function in stimulating cell proliferation. In normal breast, estrogen is not only the major steroid hormone inducing proliferation of epithelial cells in the adult non-pregnant, non-lactating breast (40, 41), it is also essential for the formation, maintenance, and homeostasis of luminal epithelial cells (42). Whereas estrogen functions by binding to its receptor ER, ER-positive mammary epithelial cells are not proliferative even though they are often adjacent to proliferative epithelial cells in the breast (41, 43–45). Consistently, estrogen inhibits the proliferation of ER-positive nontumorigenic mammary epithelial cells in culture (46). It has been proposed that, upon estrogen stimulation, ER-positive breast epithelial cells produce growth signals that stimulate the proliferation of surrounding ER-negative cells, which in turn differentiate into ER-positive luminal cells (41). However, estrogen also plays an oncogenic role in the development of breast cancer (47), being essential for the proliferation of breast cancer cells (48). ATBF1, on the other hand, is expressed at higher levels in the nucleus of luminal epithelial cells in normal human breast.4 Furthermore, ATBF1 mRNA expression positively correlates with ER expression in breast cancer cells (9). Functionally, ATBF1 inhibits cell proliferation including the estrogen-stimulated cell proliferation in breast epithelial cells (8, 13). In women, the level of serum estrogen ranges from 30–60 pmol/liter (49), which is between the lowest two concentrations of E2 that increased ATBF1 protein levels in this study (10 and 100 pmol/liter; Fig. 6B). Therefore, it is possible that in ER-positive luminal epithelial cells of normal breast physiological levels of estrogen induce and maintain a higher level of ATBF1 protein expression, which in turn restrains the function of ER in stimulating cell proliferation. Currently we are testing whether ATBF1 and ER co-localize in luminal epithelial cells of the mammary gland and whether deletion of the Atbf1 gene in mouse mammary tissues leads to increased cell proliferation in ER-positive cells.
Degradation of ATBF1 protein by estrogen-ER signaling may contribute to estrogen-mediated increase in cell proliferation. During the menstrual cycle, the estrogen level could increase by 50-fold in the follicular phase before it comes back to a regular level in the luteal phase (50), ER is expressed more often in the follicular than in the luteal phase (51), and the rate of cell proliferation is more active in the luteal phase than in the follicular phase (52). Similarly, during pregnancy, when estrogen levels are elevated, ATBF1 protein could be degraded to release the function of estrogen-ER signaling in stimulating cell proliferation and producing more luminal cells for lactation. It is, thus, possible that increased estrogen levels cause protein degradation of ATBF1, which in turn contributes to the estrogen-mediated increase in cell proliferation under physiological conditions.
Abnormally higher levels of estrogen may break the regulatory feedback loop between ATBF1 and estrogen-ER signaling, causing excessive protein degradation of ATBF1 and, thus, contributing to breast cancer development mediated by elevated estrogen levels or other mechanisms. During the development of breast cancer, increased estrogen levels clearly play an oncogenic role (47, 48, 53). On the other hand, ATBF1 appears to play a tumor-suppressive role, as ATBF1 is frequently mutated in prostate cancer, frequently deleted and down-regulated in breast cancer, suppresses the expression of oncoproteins α-fetoprotein and MUC5AC, cooperates with p53 to activate the CDKN1A (p21) tumor suppressor to arrest the cell cycle, interacts with PIAS3 to enhance the suppression of STAT3 signaling, and inhibits estrogen-ER signaling-mediated cell proliferation (7–9, 13, 54–59). Therefore, abnormally elevated estrogen levels could cause excessive protein degradation of ATBF1, releasing ER for cell proliferation and carcinogenesis, which could cooperate with deletion or other mechanisms mediating the inactivation of ATBF1 to induce the development and/or progression of breast cancer. Indeed, although ATBF1 protein is highly expressed in normal breast epithelial cells, ATBF1 protein is often reduced in the nucleus of breast cancer cells, although the nuclear decrease is often caused by translocation of ATBF1 protein into the cytoplasm.4 At present, we are testing whether knock-out of Atbf1 causes breast cancer in mice.
In summary, we studied the regulatory relationship between ATBF1 and estrogen-ER signaling and found that estrogen induced the transcription of ATBF1 but caused ATBF1 protein degradation. Combined with our earlier finding that ATBF1 inhibits functional estrogen-ER signaling by physically binding to ER (13), we propose an autoregulatory feedback loop between ATBF1 and estrogen-ER signaling. Although the expression of ATBF1 mRNA and protein is not affected in MCF7 cells with shorter tamoxifen treatment, we found that ATBF1 protein was dramatically decreased in MCF7 cells that have become resistant to tamoxifen after longer exposure (the MCF7/LCC2 population established by Brünner et al. (60). Interestingly, expression of ATBF1 in these tamoxifen-resistant cells could sensitize their response to tamoxifen, suggesting that ATBF1 could play a role in tamoxifen response of breast cancer cells.3 All our findings suggest that ATBF1 is involved not only in the homeostasis of normal breast epithelial cells but also in breast cancer development caused by excessive estrogen signaling and other factors. Estrogen-ER signaling is important for the development of the mammary gland and is positively associated with the initiation and development of breast cancer (1). Therapeutic strategies by targeting estrogen-ER signaling have been used to treat all stages of ER-positive breast cancer and have also proven successful in the prevention of breast cancer in high-risk women. The autoregulatory feedback loop between ATBF1 and estrogen-ER signaling may shed new light on molecular mechanisms involved in breast development and tumorigenesis and on developing breast cancer therapeutic strategies by targeting estrogen-ER signaling. We are currently investigating the physiopathological role of the autoregulatory feedback loop between ATBF1 and estrogen-ER signaling in mammary gland development and tumorigenesis through three independent approaches, including mammary-specific knock-out of Atbf1 in mice, ovariectomy to prevent gonadal estrogen production in Atbf1-null mammary glands, and simultaneous knock-out of both Atbf1 and ER in mice. The role of ATBF1 in tamoxifen response of breast cancer cells also warrants further investigation.
This work was supported, in whole or in part, by National Institutes of Health Grant CA85560 (to J.-T. D.). This work was also supported by Department of Defense Grant W81XWH-08-1-0328 and Georgia Cancer Coalition Award GCC130042 (both to X.-Y. D.).

The on-line version of this article (available at http://www.jbc.org) contains supplemental Tables S1–S5 and Fig. 1.
X.-Y. Dong and J.-T. Dong, unpublished data.
X. Fu, Q. Fan, L. Fu, and J.-T. Dong, unpublished data.
- ERα
- estrogen receptor α subtype
- ATBF1
- AT-motif binding factor 1
- ERE
- estrogen-responsive element
- Dm
- deletion mutant
- EFP
- estrogen-responsive finger protein
- GEMS
- Gene Expression Metasignatures
- E2
- estradiol
- SRC
- steroid receptor coactivator.
REFERENCES
- 1. Bocchinfuso W. P., Korach K. S. (1997) J. Mammary Gland Biol. Neoplasia 2, 323–334 [DOI] [PubMed] [Google Scholar]
- 2. Frietze S., Lupien M., Silver P. A., Brown M. (2008) Cancer Res. 68, 301–306 [DOI] [PubMed] [Google Scholar]
- 3. Lemieux P., Fuqua S. (1996) J. Steroid Biochem. Mol. Biol. 56, 87–91 [DOI] [PubMed] [Google Scholar]
- 4. Ferguson A. T., Davidson N. E. (1997) Crit. Rev. Oncog. 8, 29–46 [DOI] [PubMed] [Google Scholar]
- 5. Cottone E., Orso F., Biglia N., Sismondi P., De Bortoli M. (2001) Int. J. Biol. Markers 16, 151–166 [DOI] [PubMed] [Google Scholar]
- 6. Morinaga T., Yasuda H., Hashimoto T., Higashio K., Tamaoki T. (1991) Mol. Cell. Biol. 11, 6041–6049 [DOI] [PMC free article] [PubMed] [Google Scholar]
- 7. Sun X., Zhou Y., Otto K. B., Wang M., Chen C., Zhou W., Subramanian K., Vertino P. M., Dong J. T. (2007) J. Cancer Res. Clin. Oncol. 133, 103–105 [DOI] [PMC free article] [PubMed] [Google Scholar]
- 8. Sun X., Frierson H. F., Chen C., Li C., Ran Q., Otto K. B., Cantarel B. L., Cantarel B. M., Vessella R. L., Gao A. C., Petros J., Miura Y., Simons J. W., Dong J. T. (2005) Nat. Genet. 37, 407–412 [DOI] [PubMed] [Google Scholar]
- 9. Zhang Z., Yamashita H., Toyama T., Sugiura H., Ando Y., Mita K., Hamaguchi M., Kawaguchi M., Miura Y., Iwase H. (2005) Clin. Cancer Res. 11, 193–198 [PubMed] [Google Scholar]
- 10. Kim C. J., Song J. H., Cho Y. G., Cao Z., Lee Y. S., Nam S. W., Lee J. Y., Park W. S. (2008) Histopathology 52, 552–559 [DOI] [PubMed] [Google Scholar]
- 11. Cho Y. G., Song J. H., Kim C. J., Lee Y. S., Kim S. Y., Nam S. W., Lee J. Y., Park W. S. (2007) Clin. Cancer Res. 13, 4355–4359 [DOI] [PubMed] [Google Scholar]
- 12. Li H., Huang C. J., Choo K. B. (2002) Gynecol. Oncol. 84, 216–221 [DOI] [PubMed] [Google Scholar]
- 13. Dong X. Y., Sun X., Guo P., Li Q., Sasahara M., Ishii Y., Dong J. T. (2010) J. Biol. Chem. 285, 32801–32809 [DOI] [PMC free article] [PubMed] [Google Scholar]
- 14. Anzick S. L., Kononen J., Walker R. L., Azorsa D. O., Tanner M. M., Guan X. Y., Sauter G., Kallioniemi O. P., Trent J. M., Meltzer P. S. (1997) Science 277, 965–968 [DOI] [PubMed] [Google Scholar]
- 15. Fereshteh M. P., Tilli M. T., Kim S. E., Xu J., O'Malley B. W., Wellstein A., Furth P. A., Riegel A. T. (2008) Cancer Res. 68, 3697–3706 [DOI] [PMC free article] [PubMed] [Google Scholar]
- 16. Torres-Arzayus M. I., Font de Mora J., Yuan J., Vazquez F., Bronson R., Rue M., Sellers W. R., Brown M. (2004) Cancer Cell 6, 263–274 [DOI] [PubMed] [Google Scholar]
- 17. Dong X. Y., Rodriguez C., Guo P., Sun X., Talbot J. T., Zhou W., Petros J., Li Q., Vessella R. L., Kibel A. S., Stevens V. L., Calle E. E., Dong J. T. (2008) Hum. Mol. Genet. 17, 1031–1042 [DOI] [PMC free article] [PubMed] [Google Scholar]
- 18. Dong X. Y., Chen C., Sun X., Guo P., Vessella R. L., Wang R. X., Chung L. W., Zhou W., Dong J. T. (2006) Cancer Res. 66, 6998–7006 [DOI] [PubMed] [Google Scholar]
- 19. Guo P., Dong X. Y., Zhao K., Sun X., Li Q., Dong J. T. (2009) J. Biol. Chem. 284, 28243–28252 [DOI] [PMC free article] [PubMed] [Google Scholar]
- 20. Shang Y., Myers M., Brown M. (2002) Mol. Cell 9, 601–610 [DOI] [PubMed] [Google Scholar]
- 21. Guo P., Zhao K. W., Dong X. Y., Sun X., Dong J. T. (2009) J. Biol. Chem. 284, 18184–18193 [DOI] [PMC free article] [PubMed] [Google Scholar]
- 22. Berns A. (2010) Nature 468, 519–520 [DOI] [PubMed] [Google Scholar]
- 23. Zhang H., Yi X., Sun X., Yin N., Shi B., Wu H., Wang D., Wu G., Shang Y. (2004) Genes Dev. 18, 1753–1765 [DOI] [PMC free article] [PubMed] [Google Scholar]
- 24. Shang Y., Hu X., DiRenzo J., Lazar M. A., Brown M. (2000) Cell 103, 843–852 [DOI] [PubMed] [Google Scholar]
- 25. Kimura N., Takamatsu N., Yaoita Y., Osamura R. Y., Kimura N. (2008) J. Mol. Endocrinol. 40, 75–91 [DOI] [PubMed] [Google Scholar]
- 26. Welboren W. J., van Driel M. A., Janssen-Megens E. M., van Heeringen S. J., Sweep F. C., Span P. N., Stunnenberg H. G. (2009) EMBO J. 28, 1418–1428 [DOI] [PMC free article] [PubMed] [Google Scholar]
- 27. Carroll J. S., Meyer C. A., Song J., Li W., Geistlinger T. R., Eeckhoute J., Brodsky A. S., Keeton E. K., Fertuck K. C., Hall G. F., Wang Q., Bekiranov S., Sementchenko V., Fox E. A., Silver P. A., Gingeras T. R., Liu X. S., Brown M. (2006) Nat. Genet. 38, 1289–1297 [DOI] [PubMed] [Google Scholar]
- 28. Inoue S., Orimo A., Hosoi T., Kondo S., Toyoshima H., Kondo T., Ikegami A., Ouchi Y., Orimo H., Muramatsu M. (1993) Proc. Natl. Acad. Sci. U.S.A. 90, 11117–11121 [DOI] [PMC free article] [PubMed] [Google Scholar]
- 29. Dubik D., Shiu R. P. (1992) Oncogene 7, 1587–1594 [PubMed] [Google Scholar]
- 30. Hartel A., Didier A., Pfaffl M. W., Meyer H. H. (2003) J. Steroid Biochem. Mol. Biol. 84, 231–238 [DOI] [PubMed] [Google Scholar]
- 31. Perissi V., Aggarwal A., Glass C. K., Rose D. W., Rosenfeld M. G. (2004) Cell 116, 511–526 [DOI] [PubMed] [Google Scholar]
- 32. Guo P., Dong X. Y., Zhang X., Zhao K. W., Sun X., Li Q., Dong J. T. (2009) J. Biol. Chem. 284, 6071–6078 [DOI] [PMC free article] [PubMed] [Google Scholar]
- 33. Jamerson M. H., Johnson M. D., Dickson R. B. (2000) Oncogene 19, 1065–1071 [DOI] [PubMed] [Google Scholar]
- 34. Ochsner S. A., Steffen D. L., Hilsenbeck S. G., Chen E. S., Watkins C., McKenna N. J. (2009) Cancer Res. 69, 23–26 [DOI] [PMC free article] [PubMed] [Google Scholar]
- 35. Burger A., Amemiya Y., Kitching R., Seth A. K. (2006) Neoplasia 8, 689–695 [DOI] [PMC free article] [PubMed] [Google Scholar]
- 36. Urano T., Saito T., Tsukui T., Fujita M., Hosoi T., Muramatsu M., Ouchi Y., Inoue S. (2002) Nature 417, 871–875 [DOI] [PubMed] [Google Scholar]
- 37. Lahusen T., Henke R. T., Kagan B. L., Wellstein A., Riegel A. T. (2009) Breast Cancer Res. Treat. 116, 225–237 [DOI] [PMC free article] [PubMed] [Google Scholar]
- 38. Arpino G., Wiechmann L., Osborne C. K., Schiff R. (2008) Endocr. Rev. 29, 217–233 [DOI] [PMC free article] [PubMed] [Google Scholar]
- 39. Fagan D. H., Yee D. (2008) J. Mammary Gland Biol. Neoplasia 13, 423–429 [DOI] [PubMed] [Google Scholar]
- 40. Clarke R. B. (2006) Maturitas 54, 327–334 [DOI] [PubMed] [Google Scholar]
- 41. Anderson E., Clarke R. B., Howell A. (1998) J. Mammary Gland Biol. Neoplasia 3, 23–35 [DOI] [PubMed] [Google Scholar]
- 42. Matsuda M., Imaoka T., Vomachka A. J., Gudelsky G. A., Hou Z., Mistry M., Bailey J. P., Nieport K. M., Walther D. J., Bader M., Horseman N. D. (2004) Dev. Cell 6, 193–203 [DOI] [PubMed] [Google Scholar]
- 43. Anderson E., Clarke R. B. (2004) J. Mammary Gland Biol. Neoplasia 9, 3–13 [DOI] [PubMed] [Google Scholar]
- 44. Polyak K. (2007) J. Clin. Invest. 117, 3155–3163 [DOI] [PMC free article] [PubMed] [Google Scholar]
- 45. Russo J., Ao X., Grill C., Russo I. H. (1999) Breast Cancer Res. Treat. 53, 217–227 [DOI] [PubMed] [Google Scholar]
- 46. Zajchowski D. A., Sager R., Webster L. (1993) Cancer Res. 53, 5004–5011 [PubMed] [Google Scholar]
- 47. Russo J., Russo I. H. (2006) J. Steroid Biochem. Mol. Biol. 102, 89–96 [DOI] [PMC free article] [PubMed] [Google Scholar]
- 48. Yager J. D., Davidson N. E. (2006) N. Engl. J. Med. 354, 270–282 [DOI] [PubMed] [Google Scholar]
- 49. Key T. J., Appleby P. N., Reeves G. K., Roddam A., Dorgan J. F., Longcope C., Stanczyk F. Z., Stephenson H. E., Jr., Falk R. T., Miller R., Schatzkin A., Allen D. S., Fentiman I. S., Key T. J., Wang D. Y., Dowsett M., Thomas H. V., Hankinson S. E., Toniolo P., Akhmedkhanov A., Koenig K., Shore R. E., Zeleniuch-Jacquotte A., Berrino F., Muti P., Micheli A., Krogh V., Sieri S., Pala V., Venturelli E., Secreto G., Barrett-Connor E., Laughlin G. A., Kabuto M., Akiba S., Stevens R. G., Neriishi K., Land C. E., Cauley J. A., Kuller L. H., Cummings S. R., Helzlsouer K. J., Alberg A. J., Bush T. L., Comstock G. W., Gordon G. B., Miller S. R., Longcope C. (2003) J. Natl. Cancer Inst. 95, 1218–1226 [DOI] [PubMed] [Google Scholar]
- 50. Farage M. A., Neill S., MacLean A. B. (2009) Obstet. Gynecol. Surv. 64, 58–72 [DOI] [PubMed] [Google Scholar]
- 51. Söderqvist G., von Schoultz B., Tani E., Skoog L. (1993) Am. J. Obstet. Gynecol. 168, 874–879 [DOI] [PubMed] [Google Scholar]
- 52. Söderqvist G., Isaksson E., von Schoultz B., Carlström K., Tani E., Skoog L. (1997) Am. J. Obstet. Gynecol. 176, 123–128 [DOI] [PubMed] [Google Scholar]
- 53. Clemons M., Goss P. (2001) N. Engl. J. Med. 344, 276–285 [DOI] [PubMed] [Google Scholar]
- 54. Xu J., Sauvageot J., Ewing C. M., Sun J., Liu W., Isaacs S. D., Wiley K. E., Diaz L., Zheng S. L., Walsh P. C., Isaacs W. B. (2006) Prostate 66, 1082–1085 [DOI] [PubMed] [Google Scholar]
- 55. Mori Y., Kataoka H., Miura Y., Kawaguchi M., Kubota E., Ogasawara N., Oshima T., Tanida S., Sasaki M., Ohara H., Mizoshita T., Tatematsu M., Asai K., Joh T. (2007) Int. J. Cancer 121, 241–247 [DOI] [PubMed] [Google Scholar]
- 56. Kaspar P., Dvoráková M., Králová J., Pajer P., Kozmik Z., Dvorák M. (1999) J. Biol. Chem. 274, 14422–14428 [DOI] [PubMed] [Google Scholar]
- 57. Cleton-Jansen A. M., van Eijk R., Lombaerts M., Schmidt M. K., Van't Veer L. J., Philippo K., Zimmerman R. M., Peterse J. L., Smit V. T., van Wezel T., Cornelisse C. J. (2008) BMC Cancer 8, 105. [DOI] [PMC free article] [PubMed] [Google Scholar]
- 58. Kai K., Zhang Z., Yamashita H., Yamamoto Y., Miura Y., Iwase H. (2008) BMC Cancer 8, 262. [DOI] [PMC free article] [PubMed] [Google Scholar]
- 59. Nojiri S., Joh T., Miura Y., Sakata N., Nomura T., Nakao H., Sobue S., Ohara H., Asai K., Ito M. (2004) Biochem. Biophys. Res. Commun. 314, 97–103 [DOI] [PubMed] [Google Scholar]
- 60. Brünner N., Frandsen T. L., Holst-Hansen C., Bei M., Thompson E. W., Wakeling A. E., Lippman M. E., Clarke R. (1993) Cancer Res. 53, 3229–3232 [PubMed] [Google Scholar]