Abstract
Multiscale modeling has emerged as a powerful approach to interpret and capitalize on the biological complexity underlying blood vessel growth. We present a multiscale model of angiogenesis that heralds the start of a large scale initiative to integrate related biological models. The goal of the integrative project is to better understand underlying biological mechanisms from the molecular level up through the organ systems level, and test new therapeutic strategies. Model methodology includes ordinary and partial differential equations, stochastic models, complex logical rules, and agent-based architectures. Current modules represent blood flow, oxygen transport, growth factor distribution and signaling, cell sensing, cell movement and cell proliferation. Challenges of integration lie in connecting modules that are diversely designed, seamlessly coordinating feedback, and representing spatial and time scales from ligand-receptor interactions and intracellular signaling, to cell-level movement and cell-matrix interactions, to vessel branching and capillary network formation, to tissue level characteristics, to organ system response. We briefly introduce the individual modules, discuss our approach to integration, present initial results from the coordination of modules, and propose solutions to some critical issues facing angiogenesis multiscale modeling and integration.
1. Introduction
1.1. Mechanisms of Angiogenesis
The top ten fatal diseases in the developed world, along with the physiological effects of exercise and wound healing, involve a shared process: angiogenesis, the growth of capillaries from preexisting vessels. Because of angiogenesis’s prevalence and importance in disease progression and health maintenance, angiogenesis has been studied extensively experimentally, and more recently, computationally. In the last few years, multiscale modeling has emerged as a useful approach to interpret and capitalize on the biological complexity underlying blood vessel growth. To advance computational approaches, we present a way to integrate and coordinate multiscale biological modules of angiogenesis.
Designing the structure for model connectivity is a key part of successful integration. We approach angiogenesis as a complex, connected system of events occurring in sequence and in parallel, on multiple levels, triggered by a main stimulus, e.g., hypoxia.
In response to hypoxia, the transcription factor hypoxia-inducible factor 1 (HIF1) activates hundreds of genes [1]. These genes include vascular endothelial growth factor, VEGF. VEGF proteins stimulate chemotaxis and proliferation in endothelial cells during capillary sprouting. The balance of proangiogenic factors, e.g., VEGF, with antiangiogenic factors, e.g., endostatin, thrombospondin-1 and angiostatin, controls the extent of microvascular growth. At the onset of angiogenesis and throughout the process, cell activation, cell migration and cell proliferation are dependent on local growth factor concentrations and gradients.
Angiogenic sprouting also involves cell-matrix interactions. Matrix metalloproteinases, MMPs, are key molecules that allow an activated cell to proteolyze its surrounding extracellular matrix (ECM), form a moving sprout tip, and release ECM-bound factors as it migrates. The local microenvironment determines the fate of the growing sprout: it can anastomose and attach to adjacent vessels; it can retract; it can split and/or it can branch. As sprouts form and connect, they form a new capillary network. The new network can become capable of carrying blood and bringing oxygen to hypoxic regions.
To put the complexity of this process into perspective, Table 1 highlights a few numbers associated with the molecular level processes of angiogenesis.
Table 1.
Selected molecular compounds included in the model and involved in the angiogenic process. The number of experimentally characterized species of these compounds is given.
| Main Compounds Modeled | Number of Characterized Species | |
|---|---|---|
| Hypoxia | HIF | 3 |
| Prolyl hydroxylases | 3 | |
| Growth Factor Signaling | VEGF-A protein isoforms | 7 |
| VEGF receptors | 5 | |
| Matrix Degradation | MMPs | 26 |
| Tissue inhibitors of MMPs (TIMPs) | 4 |
At the molecular level, various degrees and durations of hypoxia yield different activity of HIF degradation enzymes (prolyl hydroxylases), HIF synthesis and reactive oxygen species, and hence oxygen sensitivity. At the single and multiple cell level, other ligand-receptor combinations such as notch and delta-like 4 ligand change tip cell density and capillary branching [2]. Furthermore, due to growth factor gradients, the position of a cell on a capillary sprout determines what growth factor concentrations it sees, its activation and protein expression, and its locomotive properties [3]. Parenchymal cells, precursor cells and stromal cells, as well as the extracellular matrix, constitute the nascent sprout microenvironment that influences cell signaling, growth factor production, endothelial cell (EC) movement, vessel stability and capillary permeability [4]. Finally, tissue composition and heterogeneity ultimately determine network structure, and paracrine signaling from different organs and organ systems, blood flow, inflammatory response, and lymphatics all can alter angiogenesis [4].
Not only is multiscale modeling a useful tool in determining how these factors interact, deciphering new experimental findings in angiogenesis and proposing new experiments, one could argue it is absolutely an essential tool to understand a process of such biological complexity.
In our laboratory, we have developed molecular-based models of HIF1α [5, 6], VEGF [7, 8], MMPs [9, 10], FGF2 [11], all key parts of angiogenesis. Below we introduce an approach to integrating models of angiogenesis, describe techniques used to represent the separate modules corresponding to processes in angiogenesis, discuss the challenges encountered in the process of multiscale integration, and propose solutions to address upcoming challenges.
1.2. Modeling Approaches
The large number of detailed existing angiogenesis models presents an opportunity to both develop increasingly sophisticated computational approaches to understanding biology, and to connect existing work together, taking the best pieces of developed models.
2. Modeling & Integration Methods
Integrating multiscale angiogenesis models presents a way to maintain and capitalize on biomedical knowledge in a quantitative form. It is a complex endeavor. Models were built to answer different biological questions and generate hypotheses that may have been very specific. As such, the models often use different algorithms, employ diverse languages, and focus on specific angiogenic factors, cell types or molecular species. They can be on different time and spatial scales.
Requirements then for integration are many. The most general form of integration must allow data exchange between models, feedback, asynchronous and synchronous running of models, and variable temporal and spatial scales. Furthermore, the integration must be designed so that the desired integrated or global biological phenomenon is best represented, while still maintaining the integrity of individual models.
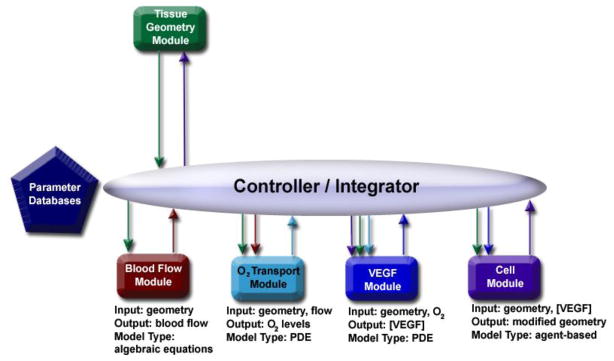
With these criteria in mind, we began the development of a multiscale integrated model, with a goal of building a prototype from five existing models (called modules to distinguish them from the integrated model): a tissue geometry module, a blood flow module, an O2 transport module, a VEGF module, and a cell module (Figure 1).
Figure 1.
Schematic for the integration of five modules. Blood flow and the O2 transport module are at the tissue level, while the VEGF module and the cell module are focused on the cellular level. Time scales range from seconds (O2 and blood flow modules) to hours (VEGF and cell modules) to days (cell module).
To introduce the design of the integration in the context of the biology, as well as the capabilities of individual modules, we briefly describe each module, and follow-up by defining the controller.
2.1 Geometry, Blood Flow & Oxygen Transport Modules
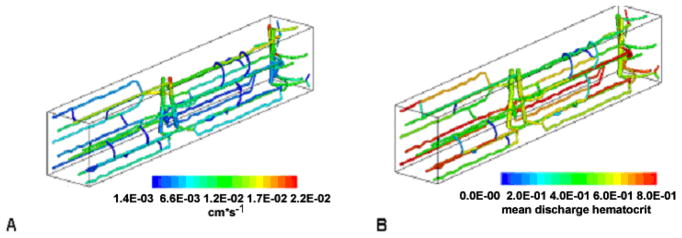
A blood flow model was previously built and validated for a given geometry of microvascular network in 3D tissue, specifically applied to skeletal muscle (for a review, see [12]). The model predicts the amount of blood flow and hematocrit through capillaries in the network, by solving a set of nonlinear algebraic equations for pressure at the network nodes (bifurcations) and blood flow rate and hematocrit in the vascular segments (Figure 2). From blood flow, the relative oxygen distribution through the network is then predicted by convection-diffusion-reaction partial differential equations governing oxygen transport.
Figure 2.
Velocity (A) and hematocrit (B) distributions for a representative 100 μm by 100 μm by 800 μm capillary network in rat skeletal muscle. The figure is adapted from [13], where the equation-based models representing blood flow and oxygen transport are discussed.
2.2 VEGF Module
The 3D model of the rat skeletal muscle introduced above was used in development of a model predicting VEGF distributions and VEGF receptor (VEGFR) occupancy in 3D tissue during exercise [14]. In the model, VEGF secretion is a function of myocyte oxygen pressure and an experimentally observed oxygen-HIF-VEGF relationship. Within the muscle, the capillaries are nonuniformly spaced, and this leads to nonuniform oxygen distribution and VEGFR expression within the tissue (Figure 3). VEGFR activation and VEGF binding is also predicted in the 3D model from a series of developed molecular-based chemical kinetic models [15].
Figure 3.
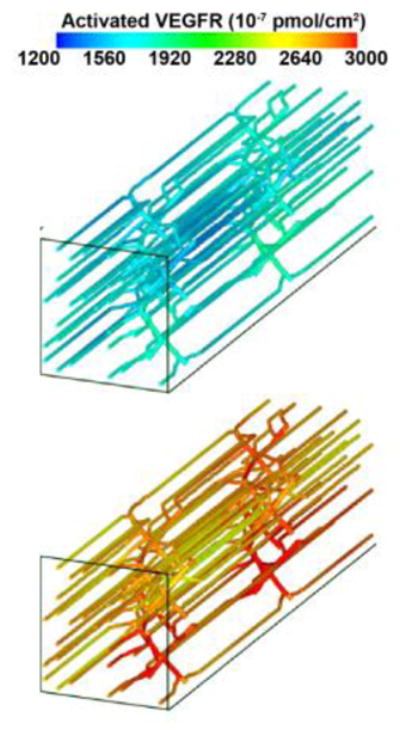
(right). Distribution of VEGF receptor activation along microvessels in skeletal muscle, during moderate exercise (top panel) and moderate exercise with low inspired oxygen (bottom panel).
2.3 Cell Module
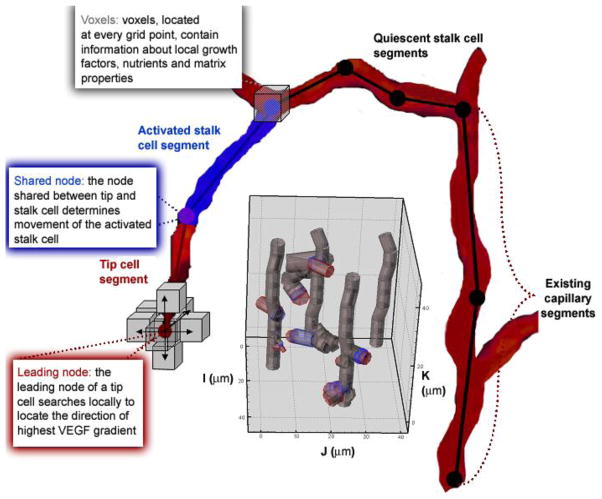
Interaction of VEGF, MMPs, and the extracellular matrix at the molecular level trigger events at the cell level. These events include tip cell activation, endothelial cell migration, chemotaxis and haptotaxis and cell proliferation. We developed a computational model to mimic cellular sprouting at the onset of angiogenesis using agent-based methodology, governed by rules (Figure 4).
Figure 4.
Schematic of the 3D cell module. Capillaries are represented by endothelial cells. An example of a growing network with four capillaries is shown in the gray inset. Cells are divided into segments. Each segment is represented by two nodes. Currently, cell segments are modeled as cylinders specified by a length and radius (gray inset); an activated segment’s length and radius can change during a model run. The local environment surrounding a cell is defined in each voxel of the grid. In the present model, voxels contain values for the local VEGF concentration. All cell segments have the capability of sensing what is located in voxels surrounding each of its nodes. For every timestep of the current model, this sensing is restricted to the leading node of the tip cell (red) and the adjacent node (purple).
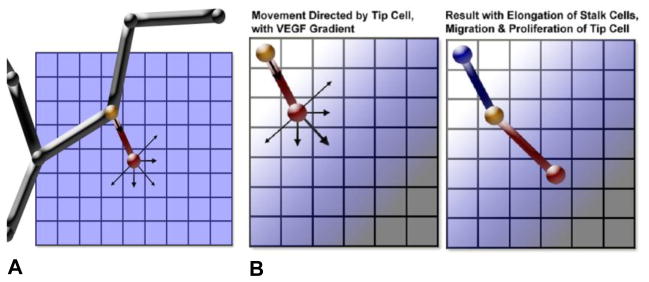
Examples of logical rules that guide cell activity in the model include migration rates as a function of local VEGF levels; or Boolean behavior for whether cellular elongation is allowed or not. Two examples of rules, in a restricted 2D case, are shown in Figure 5. The module rules based on experimental work compiled from extensive literature research, and applied to conditions that might occur in a 2D or 3D in vitro setting. Individual cell behavior (activation, elongation, migration, and proliferation) combine to produce a novel capillary network, emerging out of combinatorially complex interactions of single cells. A particular benefit of the rule or event-based modeling is the ability to easily produce in silico knockouts on multiple biological levels. Here we describe an example, an in silico molecular level knockout of the Dll4 ligand.
Figure 5.
Illustrations of cell movement represented by rules in the cell module. The tip cell is represented by a red node and segment; the node shared between the tip and stalk cells is yellow; and the blue node and segment is the adjacent stalk cell segment. Black segments and nodes represent quiescent vessels. Arrows represent direction of movement for nodes. (A) Schematic of a capillary with an activated tip cell. (B) Movement and the resulting cell segment positions when there is a VEGF gradient, showing the effects of allowed elongation and tip cell proliferation.
2.3.1. Dll4 Knockouts
Delta-like ligand 4 (Dll4) is a transmembrane ligand for Notch receptors. It is a critical ligand for vascular development; haploinsufficiency of the Dll4 gene is embryonically lethal in many mouse strains [16]. Dll4 is primarily expressed in endothelial cells, and it is correlated to the local concentration of VEGF [17], as well as to VEGF receptor concentrations; a blockade of VEGF leads to a decrease of Dll4 [18], while Notch-Delta signaling downregulates VEGFR2 [19]. A Dll4 deficiency causes an increase in sprout formation but vessels appear nonproductive, with less capability of carrying blood or reducing hypoxia in surrounding tissue [18]. Overexpression of Dll4 diminishes the growth of new sprout tips.
The cell module predicts the effects of VEGF protein concentrations and Dll4 haploinsufficiency on endothelial cells and capillary growth. In the module, cell-level behavior alone contributes to differences in capillary network formation, and the vascular networks resulting from the model appear similar in vascular density, branching and tortuosity to networks found in Dll4 experiments (Figure 6).
Figure 6.
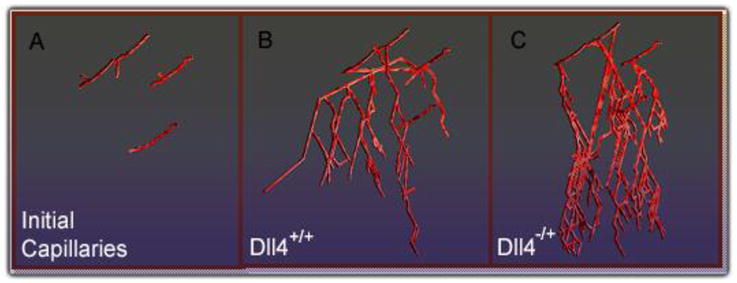
Snapshot of the model output directly after angiogenic stimulation (A) and for simulated hypoxia in Dll4+/+ conditions, after 160 hrs (B) and in Dll4−/+ conditions, after 160 hrs (C).
2.4 The Controller: Running Models, Data Handling& Feedback
The controller provides a platform to seamlessly integrate the modules mentioned above and simulate angiogenesis at multiple temporal and spatial scales. These modules can be, and currently are, rewritten as different Application Programming Interface (API) libraries and provide language binding for a variety of languages (such as C, C++, FORTRAN, JAVA, MATLAB). By this means, libraries can be called from different languages and shared by the community as well.
Integration revolves around the interaction of the controller and the modules, and between the controller and parameter databases or parameter text files. Parameters include biochemical parameters (such as kinetic rate constants) and physical parameters (such as vascular geometry). The parameters, currently inputted via text files, are being compiled into a database format. In this way, parameter sensitivity analysis can be performed to generate experimental hypotheses. Modules are compiled into the library files. Parameters dependent on a biological microenvironment are maintained outside of the library files, so that the modules are general, and function independent of their application to a specific tissue or cell. The controller reads the parameters from the database or text files, and invokes the modules. Each module takes input from the controller and outputs its results to the controller, which then passes the relevant data on to subsequent modules. The forward and feedback interactions between different modules are regulated through the controller.
3. Initial Output
3.1 Emerging New Vasculature Network
Results from the cell module are based on input from a sample of four initial capillaries, grown for 200 hours post stimulation by an angiogenic source, in this case elevated levels of VEGF (Figure 6). The growth of the vessels is unrestricted, and the initial space occupied by the four capillaries is a 130 μm by 130 μm cross-section, in the xy-plane. In Figure 6, the view is approximately from the top, looking down the z-plane. The concentration of VEGF is highest at the bottom of the section and lowest at the top, and we assume the VEGF levels are above the minimum required for endothelial cell activation. Activated endothelial cells are allowed anywhere on the initial capillaries, but growth is restricted to two dimensions, within a voxel movement in the z-direction. This first test of the model uses VEGF concentration and geometric input, and is coded in a manner to be easily integrated, and to write and read parameters appropriately from files.
VEGF levels corresponding to conditions in skeletal muscle for mild to moderate hypoxia (e.g., during mild to moderate exercise), are being tested in the model to provide initial conditions for the cell module. A section of simulated skeletal muscle vasculature (a 200 μm by 200 μm by 800 μm section) is the input network. While requiring more computational memory and speed than the first tested capillary network input, we use this larger size of skeletal muscle tissue, since the corresponding vascular geometry has previously been tested as input separately into the blood flow, oxygen, and VEGF modules. In these renditions, there is no feedback. The different cell and molecular-level conditions that can be explored in the integrated model are listed in Table 2.
Table 2.
Different conditions being represented and tested in skeletal muscle vasculature using the integration model.
| Dll4+/+ | Low hypoxia | Elongation Allowed | Proliferation Allowed | Migration Allowed |
| Dll4−/+ | Moderate hypoxia | Elongation Restricted | Proliferation Restricted | Migration Restricted |
Output includes new vessel network geometry, with new VEGF distribution, vessel length changes and a unique branching structure. Simulating conditions of exercise in skeletal muscle with low or moderate levels of tissue hypoxia involves changes in all parts of the angiogenic process; and we can assess the effects on local VEGF distribution surrounding tip and stalk cells, VEGFR binding, and cell proliferation and branching, as a function of local VEGF. An eventual application of this research is to test in silico molecular therapeutic intervention, and predict cellular changes and degree of angiogenic growth.
4. Discussion
4.1 Main Challenges & Current Approaches
4.1.1 Differences in Model Structure and Units
There are several approaches to tackling the issue of integrating multiscale modules written in diverse languages with different code architecture and data structures. One way to approach the “language barrier” is by compiling all of the modules into a JAVA-readable Dynamic Link Library (DLL) file format, in a Windows Operating system (or in a Shared Object Library, SO, file in a Linux platform). By this means, the controller, written in JAVA, can easily link with modules written in different languages, allowing the parameters to be passed readily between the controller and each module. The modules then are essentially black-box modular, executable files. Changes can be made to code in a single self-contained DLL or SO file shared by many modules.
This is not the most general form though. The issue arises that some of the models may need to be individually recompiled based on new equations, new parameters or a new threshold of parameters, e.g., a change in desired time-intervals. Recompiling in their original language can be a necessity for accurate results. Because of this, we are currently compiling each module in its original language, and having the controller call different compilers.
Dealing with differences in data structures comes through careful synchronization of input and output parameters from each of the modules. For us, this required some initial modification for each module in the body of the code, for writing and reading files, and for passing parameters. An example is that the cell module is defined by cellular agents comprised of nodes and segments – the location of the initial nodes and segments are derived from the geometry module which describes the initial vascular network as a series of voxel coordinates and a given radius. If endothelial cells or capillaries were defined as an amorphous shape or in 2D in one module but in 3D in another, redesign of the original code would likely be necessary. Alternately, in a more sophisticated controller, extrapolation between coordinate systems, types of data structures, and dimensions could be a feature.
4.1.3. Parameter Sensitivity, Parameter Optimization and Model Adaptation
Dealing with large number of parameters, some, if not most, unknown experimentally, comes with the process of multiscale, integrative modeling. One of the ways in which we are dealing with the large number of parameters in the modules and integrated model is by developing a database that can store parameters for different model runs. The database can be searched, and called dynamically by the controller to access input parameters for different modules as they are executed, or modules themselves can read and write directly to the database. Furthermore, part of the database will maintain experimental data, so the model results (e.g., total vessel growth over time in conditions of moderate hypoxia) can be compared immediately and directly to experimental findings. The necessary initial conditions can also be readily set to match those in experiments, by a query of the experimental protocol from the stored database.
Sophisticated, accurate, efficient means of analyzing parameter sensitivity are starting to be applied in biological models, and will likely become a requirement for progress in the field, as well as a means to help correlate model parameters with experiments. We are exploring means to do large scale parameter sensitivity rapidly, both for individual modules separately and for the combined model. Optimization will be based on the degree of experimental validation we are able to achieve for the integrated model.
Learning algorithms, too, limited in their application to the field of angiogenesis, will likely emerge as a means to keep programs updated and evolving as new data become available – furthermore, such algorithms could be employed to better portray biological adaptation to disease states and angiogenic development.
4.1.4. Software Location and Future Adaptation
Currently the described software is being developed on servers at Johns Hopkins University (Biomedical Engineering and Computer Science Departments). We will continue to develop individual modules and the multiscale integration platform. It is our goal to involve the larger community of researchers in systems biology, and provide a tool that will intelligently integrate models from laboratories around the world.
5. Conclusions
A large-scale initiative to combine existing and new modules of angiogenesis offers a way to maintain and cultivate knowledge of angiogenesis in a quantitative and dynamic format from the molecular to the cellular level and on to the tissue, organ and organism levels. By combining modules that represent each process in angiogenesis, from blood flow to oxygen transport to growth factor signaling to cell activation, movement and proliferation, we will begin to produce a comprehensive mechanistic simulation of capillary growth that can be used as a platform to test and generate experimental hypotheses. As new tools develop for the systematic validation, integration, visualization and adaptation of these models, multiscale modeling will become a key component of rigorous experimental design and therapeutic advances.
Acknowledgments
We thank Feilim Mac Gahbann, Emmanouil Karagiannis, James Ji, Carmen Kut and Michael Yang for their contributions to this research, and Mikhail Basilyan for his work on software development. We also thank laboratory members Marianne Stefanini, Kejing Chen, David Noren, Jacob Koskimaki and Florence Wu for discussions.
Footnotes
This work is supported by NIH Grants RO1 HL79653 and R33 HL087351, and NIH 1F32HL085016-01 (A.Q.).
Contributor Information
AMINA A. QUTUB, Department of Biomedical Engineering, Johns Hopkins University, School of Medicine, 613 Traylor Bldg., 720 Rutland Ave, Baltimore, MD 21205 U.S.A
GANG LIU, Department of Biomedical Engineering, Johns Hopkins University, School of Medicine, 425 Traylor Bldg., 720 Rutland Ave, Baltimore, MD 21205 U.S.A.
PRAKASH VEMPATI, Department of Biomedical Engineering, Johns Hopkins University, School of Medicine, 613 Traylor Bldg., 720 Rutland Ave, Baltimore, MD 21205 U.S.A.
ALEKSANDER S. POPEL, Department of Biomedical Engineering, Johns Hopkins University, School of Medicine, 611 Traylor Bldg., 720 Rutland Ave, Baltimore, MD 21205 U.S.A
References
- 1.Semenza GL. Physiology (Bethesda) 2004;19:176–82. doi: 10.1152/physiol.00001.2004. [DOI] [PubMed] [Google Scholar]
- 2.Thurston G, Noguera-Troise I, Yancopoulos GD. Nat Rev Cancer. 2007;7:327–31. doi: 10.1038/nrc2130. [DOI] [PubMed] [Google Scholar]
- 3.Siekmann AF, Covassin L, Lawson ND. Bioessays. 2008;30:303–13. doi: 10.1002/bies.20736. [DOI] [PubMed] [Google Scholar]
- 4.Adams RH, Alitalo K. Nat Rev Mol Cell Biol. 2007;8:464–78. doi: 10.1038/nrm2183. [DOI] [PubMed] [Google Scholar]
- 5.Qutub AA, Popel AS. J Cell Sci. 2006;119:3467–80. doi: 10.1242/jcs.03087. [DOI] [PMC free article] [PubMed] [Google Scholar]
- 6.Qutub A, Popel A. Mol Cell Biol. 2008 doi: 10.1128/MCB.00060-08. in press. [DOI] [PMC free article] [PubMed] [Google Scholar]
- 7.Stefanini MO, Wu F, Mac Gabhann F, Popel AS. 2008 submitted. [Google Scholar]
- 8.Gabhann FM, Popel AS. Microcirculation. 2008;1 [Google Scholar]
- 9.Vempati P, Karagiannis E, Popel A. J Biol Chem. 2007 doi: 10.1074/jbc.M611500200. in revision. [DOI] [PubMed] [Google Scholar]
- 10.Karagiannis ED, Popel AS. J Theor Biol. 2006;238:124–45. doi: 10.1016/j.jtbi.2005.05.020. [DOI] [PubMed] [Google Scholar]
- 11.Filion RJ, Popel AS. Ann Biomed Eng. 2004;32:645–63. doi: 10.1023/b:abme.0000030231.88326.78. [DOI] [PubMed] [Google Scholar]
- 12.Goldman D. Microcirculation. 2008 doi: 10.1080/10739680801938289. in press. [DOI] [PMC free article] [PubMed] [Google Scholar]
- 13.Ji JW, Tsoukias NM, Goldman D, Popel AS. J Theor Biol. 2006;241:94–108. doi: 10.1016/j.jtbi.2005.11.019. [DOI] [PubMed] [Google Scholar]
- 14.Mac Gabhann F, Ji JW, Popel AS. J Appl Physiol. 2007;102:722–34. doi: 10.1152/japplphysiol.00800.2006. [DOI] [PubMed] [Google Scholar]
- 15.Mac Gabhann F, Popel AS. Am J Physiol Heart Circ Physiol. 2004;286:H153–64. doi: 10.1152/ajpheart.00254.2003. [DOI] [PubMed] [Google Scholar]
- 16.Gale NW, Dominguez MG, Noguera I, Pan L, Hughes V, Valenzuela DM, Murphy AJ, Adams NC, Lin HC, Holash J, Thurston G, Yancopoulos GD. Proc Natl Acad Sci U S A. 2004;101:15949–54. doi: 10.1073/pnas.0407290101. [DOI] [PMC free article] [PubMed] [Google Scholar]
- 17.Lobov IB, Renard RA, Papadopoulos N, Gale NW, Thurston G, Yancopoulos GD, Wiegand SJ. Proc Natl Acad Sci U S A. 2007 doi: 10.1073/pnas.0611206104. [DOI] [PMC free article] [PubMed] [Google Scholar]
- 18.Noguera-Troise I, Daly C, Papadopoulos NJ, Coetzee S, Boland P, Gale NW, Lin HC, Yancopoulos GD, Thurston G. Nature. 2006;444:1032–7. doi: 10.1038/nature05355. [DOI] [PubMed] [Google Scholar]
- 19.Sainson RC, Aoto J, Nakatsu MN, Holderfield M, Conn E, Koller E, Hughes CC. Faseb J. 2005;19:1027–9. doi: 10.1096/fj.04-3172fje. [DOI] [PubMed] [Google Scholar]


