

Abstract
Conformational diseases result from the failure of a specific protein to fold into its correct functional state. The misfolded proteins can lead to the toxic aggregation of proteins. Protein misfolding in conformational diseases often displays a threshold behavior characterized by a sudden shift between nontoxic to toxic levels of misfolded proteins. In some conformational diseases, evidence suggests that misfolded proteins interact with bystander proteins (unfolded and native folded proteins), eliciting a misfolded phenotype. These bystander isomers would follow their normal physiological pathways in absence of misfolded proteins. In this article, we present a general mechanism of bystander and misfolded protein interaction which we have used to investigate how the threshold behavior in protein misfolding is triggered in conformational diseases. Using a continuous flow reactor model of the endoplasmic reticulum, we found that slight changes in the bystander protein residence time in the endoplasmic reticulum or the ratio of basal misfolded to bystander protein inflow rates can trigger the threshold behavior in protein misfolding. Our analysis reveals three mechanisms to rescue bystander proteins in conformational diseases. The results of our model can now help direct experiments to understand the threshold behavior and develop therapeutic strategies targeting the modulation of conformational diseases.
Introduction
Conformational diseases originate from the failure of specific proteins to adopt or maintain their native conformational state (1). Misfolded proteins are implicated in the reduction of native protein levels and the formation of aggregates in a variety of conformational diseases, such as β-amyloid toxicity, Charcot-Marie-Tooth, diabetes, presenile dementia, and α1-antitrypsin deficiency with liver disease (2). Proteins misfold due to cellular stress as well as inherited or stochastic mutations (3). Evidence suggests that misfolded proteins can interact with bystander isomers to elicit a misfolded phenotype (4). A bystander protein is one that, in the absence of misfolded proteins, will be routed to its normal physiological pathway. The bystander protein pool is composed of the unfolded isomers and native (folded) proteins. In the presence of misfolded proteins, bystander proteins misfold, resulting in decreased native protein levels and increased levels of protein aggregation (4). This phenomenon has recently been characterized in the autosomal dominant Mutant INS-gene Induced Diabetes of Youth (5–7).
The formation of misfolded proteins in conformational diseases often displays a threshold behavior that is characterized by a sudden shift in the concentration of proteins from low misfolded concentration (nontoxic) to high misfolded concentration (toxic) levels. For example, an increase in mutant type I collagen expression, above a critical threshold, results in an aortic rupture due to a breakdown in collagen formation (8). Vascular toxicity appears to occur in a dose-dependent manner with β-amyloids, which are a misfolded form of amyloid precursor protein and the main component of aggregates found in patients with Alzheimer's disease (9). Both of these examples, and several others, are the result of dominant negative mutations that give rise to increased misfolded protein levels. Misfolded isomers exert a dominant-negative effect (toxic gain-of-function) possibly through an interaction with a protein-binding partner expressed in cells (2). A key to controlling conformational diseases, therefore, is to understand the underlying mechanisms responsible for threshold behavior under conditions of increased protein misfolding.
The threshold behavior in conformational diseases can arise from a sigmoidal dose-response curve or the appearance of bistability within a certain range of parameters. In dynamical and complex systems, bistability is characterized by two steady states and a third unstable steady state (10,11). Experimental evidence suggests that this threshold phenomenon is associated with bistability; misfolded isomer or aggregate protein concentration can exhibit bistability with changes in temperature (12), pressure (13), and pH (14). There is also evidence of guanidinium chloride concentration-dependent bistability in the transition between unfolded and folded transthyretin protein states (15). To date, there are few mathematical models which can describe the threshold of protein misfolding or aggregation in conformational diseases as a bistable system (16–19). Generalizations of the Smoluchowski's theory of coagulation have been applied to investigate protein polymerization and aggregation (20). However, these models do not explain the threshold for protein misfolding or aggregation in a mechanistic manner (21).
The lack of mechanistic models in the literature is not unexpected, because experimental determination of protein misfolding or aggregation pathways is technically demanding (22). A major difficultly lies in obtaining accurate characterization of the diverse, short-lived intermediate misfolded and aggregate isomers that may occur during formation of both polymorphous and highly structured aggregates (i.e., fibrils). An alternative to focusing on the mechanism of misfolding or aggregation itself is to investigate the progression of cellular dysfunction from the perspective of bystander protein production. The bystander protein pool can be detected experimentally through nonreducing Tris-Tricine-urea-SDS-PAGE if the misfolded protein is the result of disulfide mispairing (23–25). Loss-of-function diseases are characterized by a reduction in native protein levels, which could be caused by protein misfolding. Understanding the mechanisms that deplete bystander protein levels will be important in the search for therapeutic interventions aimed at controlling conformational diseases.
In this article, we present a general model describing the bystander protein disappearance (loss-of-function) through direct or indirect interaction with misfolded protein to explore threshold behavior in conformational diseases. Our model also describes the production of misfolded isomers, which makes it applicable to investigate toxic gain-of-function in conformational diseases. We find that a mathematical formulation of our model can exhibit the threshold behavior typically found in some conformational diseases. The threshold behavior is explained by the appearance of bistability in our mathematical model. Furthermore, we find that bistability is a function of two parameters: the bystander isomer residence time in the endoplasmic reticulum lumen, and the ratio of the basal inflow rates of misfolded to bystander protein. We also derive the necessary conditions for the manifestation of the threshold behavior based on this ratio and the order of the reaction with respect to the misfolded and bystander isomers. After analyzing our model, we propose three mechanisms to rescue bystander protein in conformational diseases. Our results provide mechanistic insight into the threshold behavior in conformational diseases and open potential therapeutic avenues to regulate conformational diseases.
Model
A model of bystander protein disappearance in the presence of misfolded protein
We model the process of protein production and folding in the endoplasmic reticulum (ER) lumen as occurring within a continuous flow reactor (see Fig. 1). In our model, there is a continuous flow of the recently synthesized conformational isomers, the bystander N and misfolded M proteins, which is the direct result of basal protein synthesis and depletion (26,27). Under normal conditions, bystander and misfolded proteins inflow with the constant basal rates [N0]/tN and [M0]/tM, respectively. [N0] and [M0] represent, respectively, the basal concentrations of bystander and misfolded protein. The value ti is the ER residence time of isomer i. Bystander unfolded isomers are depleted through the ER-assisted folding pathway, whereas the bystander folded protein is exported from the ER (28). On the other hand, misfolded proteins are depleted from the ER, either through ER-assisted degradation (3) or protein translocation (29). We assume that the rate of these outflow processes is of first-order kinetics. Therefore, the system of differential equations governing the bystander N and misfolded M isomer concentration in the ER lumen is
| (1) |
| (2) |
where R([N],[M]) is the reaction rate between bystander and misfolded proteins. Note that we are denoting concentration with square brackets.
Figure 1.

Schematic diagram of a continuous flow reactor model of the endoplasmic reticulum lumen (ER). In this model, the bystander protein pool, composed of unfolded and folded isomers, has an inflow rate of [N0]/tN, where [N0] is the basal bystander protein concentration and tN is the bystander ER residence time. The misfolded protein has an inflow rate equal to [M0]/tM, where [M0] is the basal misfolded protein concentration and tM is the misfolded ER residence time. Bystander and misfolded proteins interact with reaction rate R([N],[M]), which is a function of the bystander and misfolded protein concentrations. The outflow rate of bystander and misfolded proteins follows first-order kinetics. The outflow of isomers is driven by the ER-assisted folding (ERAF), ER-assisted degradation (ERAD), protein export, and translocation pathways.
In the next subsection, we discuss the determination of the reaction rate R([N],[M]) between the bystander and misfolded proteins.
A general mechanism of bystander and misfolded protein interaction in conformational diseases
The irreversible aggregation typical of conformational diseases is highly sensitive to protein conformation. The misfolded protein pool (M) encompasses nonnative denatured and misfolded isomers. This pool is aggregation-prone due to the exposure of hydrophobic groups and disulfide bonds, which can result in strong, and irreversible protein-protein contacts (30,31). Therefore, there is compelling biochemical evidence suggesting that the misfolded isoforms are responsible for the onset of certain conformational diseases (32).
Protein aggregation is initiated by the reversible aggregation of misfolded isomers, M, followed by structural rearrangements. These rearrangements lead to the formation of an intermediate committed to the aggregation pathway (32,33). Protein aggregation proceeds as more misfolded isomers are committed to the aggregation pathway (34). There are two sources of misfolded isomers. Misfolded isomers M are formed by the spontaneous and first-order conversion of bystander isomers, N (32,35). This conversion is sporadic and represents a minor source of misfolded protein formation in conformational diseases. The main source of misfolded isoform M is the conversion of bystander protein N into a misfolded isoform M through process catalyzed by M (32,36). This process can be represented by a phenomenological reaction rate of the form
| (3) |
In the above equations, the exponents n and m specify the order of the reaction with respect to the bystander and misfolded proteins, respectively. The parameter k is a rate constant of order (n+m). Note that and . Note that the reactor (Eqs. 1-2) and rate (Eq. 3) are a general case of the cubic autocatalysis reactor (10).
The (n+m)th order of our phenomenological rate Eq. 3 does not imply that we are proposing a single, multimolecular, elementary step. There are multiple combinations of bimolecular steps that, when combined, give an overall reaction rate with this (n+m)th order form. For example, we can consider the scenario in which aggregation of misfolded isomers M follows an association-limited aggregation mechanism (33). The conversion of bystander N into misfolded isomer M involves a two-step mechanism involving an aggregate intermediate A:
| (4) |
| (5) |
In this mechanism, two misfolded isomers form a dimer, which then plays the catalytic role to convert the bystander into a misfolded isomer. If the reverse reaction constant of the dimerization is higher than the forward reaction constants, k−1 ≫ k1 and k−1 ≫ k2, then the dimerization step Eq. 4 is rate-limiting for the formation of the smallest aggregate (37,38), and the overall rate of disappearance of the bystander isomer N will be Eq. 3 with n =1 and m = 2.
Bystander isomer concentration at steady state
We can understand the reaction dynamics by studying the steady states. At the steady state, Eqs. 1 and 2 are
| (6) |
| (7) |
By adding Eqs. 6 and 7, the ER reactor model has the steady-state relationship of
| (8) |
We now can derive an expression for the bystander isomer concentration at steady state. Using the steady-state relationship Eq. 8 and phenomenological reaction rate Eq. 3, we can uncouple Eqs. 6 and 7. This yields an expression for the bystander isomer concentration at the steady state of the form
| (9) |
Before we can analyze our model, we derive a suitable dimensionless form of Eq. 9. The nondimensionalization allows us to reduce the number of parameters in our model and give an absolute measure of the model parameters independent of units of measurement. By using Segel (39) concepts of scaling, we scale the bystander isomer concentration [N] with a parameter that provides an estimate of its maximum value. We choose the dimensionless variable:
| (10) |
Substituting Eq. 10 into Eq. 9 and rearranging, we obtain the dimensionless equation for the bystander isomer concentration at steady state,
| (11) |
with the nondimensional parameters defined as
| (12) |
In Eq. 11, τu is the bystander isomer dimensionless residence time in the ER, τr is the ratio of the misfolded to bystander isomers residence times, and θ is the ratio of the misfolded to bystander isomer initial concentrations.
There are limits to the values of our variable and some of our parameters. The bystander isomer u lies in the range of
| (13) |
Under normal physiological conditions, the ratio of misfolded to bystander isomer initial concentrations θ lie in the range of
| (14) |
because misfolded isomers are usually in lower concentrations than the bystander proteins. On the other hand, the ER residence time of misfolded isomers is larger than the ER residence time of bystander isomers (tM ≫ tN) (28); this implies that τr lies in the range of
| (15) |
There are no bounds on τu.
Note that the misfolding reaction will be completed when the bystander and misfolded isomers have reached steady state. Therefore, we can define the extent of the reaction, x, as
| (16) |
At the beginning of the reaction, x = 0. At the end of the reaction, the bystander protein can be depleted to a low steady-state concentration or the production of misfolded isomer can reach a high steady-state concentration. This makes our model applicable to investigate loss-of-function disease due to bystander protein depletion or toxic gain-of-function due to misfolded protein production. Substituting Eq. 16 into Eq. 11 yields an expression for the rate of the extent of the reaction at steady state
| (17) |
The above expression has two dimensionless rates: the reactor flow rate in the ER, yf(x), and the reaction rate, yr(x). Our analysis will benefit from the division of the model into these two rates, as will be evident in the next section.
Results
The model can exhibit bistability
In our mathematical model, the extent of the reaction can attain a value which balances the flow rate, yf(x), with the reaction rate, yr(x). When this happens, the bystander isomer and misfolded isomer concentrations are at steady state. From Eq. 17, the steady states are given by the solutions of the equation
| (18) |
This is a (n+m)th-order polynomial, meaning x can have up to (n+m) steady states. We are only interested in the physically realistic solutions in the range x = [0,1].
A convenient way to investigate the total number of steady states is to find the intersections of yf(x) and yr(x) in the flow diagram for different values of τu, τr, θ, n, and m. The flow rate yf(x) is a straight line with slope determined by τu. The reaction rate yr(x) is a higher-order polynomial, which can potentially have (n+m) roots between x = [0,1]. Surprisingly, yr(x)has a simple concave downwards form between with a maximum at
(see Appendix A). For a fixed value of τu, the flow rate yf(x) will remain fixed in the flow diagram. Depending on the values of τr, θ, n, and m, the system can exhibit more than one steady state.
An easy way of changing the number of steady states is to vary the ratio of the misfolded to bystander isomer initial concentrations (θ), while keeping τr, n, and m constant. Increasing θ increases the maximum value of yr(x) without affecting yf(x). The manner in which the steady states change with θ is illustrated in Fig. 2, showing three steady states at intermediate values of θ. The actual values of the steady states are not important here. What is important, however, is the existence of one, three, or again, one steady-state solution as θ increases from θ1 to θ3, where θ1 < θ2 < θ3. By inspection, x2 is linearly unstable, because ∂y(x)/∂x > 0 at x = x2, while x1 and x3 are stable steady states, because at these points ∂y(x)/∂x < 0 (Fig. 2 B). The model, therefore, exhibits bistability which creates the threshold behavior found in some conformational diseases. A similar pattern in the change of steady states can be observed for fixed τr, θ, n, and m, and varying the flow rate of the bystander isomer (τu) (Fig. 3).
Figure 2.

Steady states for the extent of the reaction from Eq. 17 as a function of θ. The steady states are given by the intersections of yf(x) and yr(x). (A) Flow diagram illustrates the origins of bistability, which creates a threshold behavior in the model. (B) Geometrical picture of the rate of the reaction y(x). From the graph, we can determine all the steady states and their stability. The model exhibits one, three, or again, one steady-state solution as θ increases from θ1 to θ3, where θ1 < θ2 < θ3. (Open circle) Unstable steady state; (solid circles) stable steady states for θ = θ2. Note that the model exhibits bistability for θ2. (Insets) Lower steady-state point. Parameter values are n = 2, m = 4, τr = 4, τu = 0.1, θ1 = 0.05, θ2 = 0.5, and θ3 = 0.75.
Figure 3.

Steady states of the model from Eq. 17 for changes in the bystander isomer residence time in the ER (τu). (A) Steady states as the intersections of yf(x) and yr(x). The flow diagram illustrates that bistability can arise by increasing τu. The bistability explains the threshold behavior in our model. For a fixed yr(x), the model is bistable when . (B) Stationary steady-state locus in the bifurcation diagram as a function of the bystander residence time τu. The bifurcation curve shows stable steady states (solid lines) and unstable steady states (dashed line). The lower stable steady-state branch is characterized by the fast flow of bystander isomers in the ER. The higher stable steady-state branch is characterized by a high bystander isomer depletion and high misfolded isomer production. Parameter values are n = 1, m = 2, τr = 6, , , and θ = 0.1.
The model can exhibit physically unrealistic steady states if parameters are not appropriately bounded. We need to set up limits for the critical point
where yr(x) achieves a maximum. Given that the extent of the reaction x is bounded by 0 and 1, the critical point may lie in the range
| (19) |
We find that the condition given by Eq. 19 is valid when
| (20) |
Note that θ/τr is equivalent to the ratio of basal misfolded isomer to bystander isomer inflow rates into the ER, which we define as
| (21) |
The parameter λ plays an important role in the model, which can be appreciated in Fig. 2. The variation of θ is effectively a variation of λ as the value of τr remains constant. We also further investigate the influence of λ on the threshold behavior in the sections below.
Influence of τu and λ on the threshold behavior
Now we investigate how the model jumps from one to three steady states when the functions yf(x) and yr(x) become tangential in the flow diagram (Fig. 2 A). The expressions for the tangency of yf(x) and yr(x) allow us to determine the parameters contributing to the threshold behavior.
In chemical reaction models, the tangency of curves in flow diagrams and the appearance of more than one steady state is relatively common. For tangency, our model requires simultaneously that
| (22) |
In terms of τu, these equations become
| (23) |
| (24) |
Dividing the above equations and rearranging gives a quadratic expression for the tangency points,
| (25) |
where
| (26) |
By examining Eqs. 25 and 26, we find that multiple intersections and tangencies are only possible if
| (27) |
By using the above expressions, we can investigate the influence of the τu on the bistability, which creates the threshold behavior in our model. Substituting Eq. 25 into Eq. 23, we determine the critical bystander isomer dimensionless residence time points for tangency in the flow diagram:
| (28) |
In the flow diagram (Fig. 3 A), for a fixed yr, the family of flow rates yf between the low flow rate and high flow rate exhibits three steady states: two stable steady states and one unstable steady state. Therefore, the model is bistable for . The reaction has a single steady state for or .
The bifurcation diagram x versus τu (Fig. 3 B) has an S-shaped curve. At short bystander residence time with , the reaction has only one steady state characterized by low bystander isomer depletion and low misfolded isomer production. As the bystander residence time increases, but remains bounded by , the bystander isomer depletion increases slightly along a low bystander isomer depletion steady-state branch. We call this the fast-flow branch because it is characterized by the fast flow of bystander isomers in the ER lumen, which decreases the probability of misfolded isomers to react with the bystander isomers. At a long bystander residence time , the reaction moves to a new steady-state branch characterized by a high bystander isomer depletion and a high production of misfolded isomer. We name this the outbreak-branch because the conformational disease is manifested on this branch.
Note that for the fast flow and outbreak branches coexist. In the absence of perturbation, the system will remain in one steady-state branch. For example, a sustained and progressive increase in the bystander residence time τu will cause a discontinuous change in the steady state from the fast flow branch to the outbreak branch at . In this case, becomes the threshold behavior point, where a sudden shift occurs between low levels of bystander isomer depletion to high levels of bystander depletion. If τu is decreased progressively from a long bystander residence time , the system will remain on the outbreak branch, even as τu is reduced below the threshold behavior point through the region where the two steady-state branches coexist. The system will exhibit a discontinuous change in the steady state from the outbreak branch to the fast flow branch at . We call this critical point the bystander-isomer-rescue point because the bystander-isomer-concentration level increases from this point as decreases. The existence of two different critical points (to change between steady-state branches) as we progressively vary a parameter shows that our model exhibits hysteresis.
Interestingly, the model also exhibits hysteresis for progressive variations of the ratio of basal misfolded isomer to bystander isomer inflow rates λ into the ER. Although we cannot determine analytically a closed-form solution for the critical λ± points, we know that the variation of λ produces a discontinuity in the number of the steady states from one to three, and back to one as we progressively increase λ (Fig. 2). Moreover, the λ–x bifurcation diagram has a S-shape curve similar to the τu–x bifurcation diagram shown in Fig. 3 B, with both a threshold behavior point and the bystander isomer rescue point.
Now we are in the position of investigating the effects of both τu and λ on the appearance of the threshold behavior. There is a domain in the λ–τu parameter plane where the three physically realistic steady states of the model Eq. 11 exist and the threshold behavior will appear. This is shown in Fig. 4. The analytical expression for the boundary curves is given parametrically and implicitly by substituting Eq. 25 into Eq. 28. The two roots move closer together as λ increases. They intersect at the cusp point C, where . The representation of the bistable area in the λ–τu parameter plane also confirms that the model exhibits a hysteresis effect. Suppose that we have a fixed λ between the critical points and , and τu moves from zero vertically. As the value of τu increases, the system will discontinuously jump from one steady state to three steady states back to one steady state. The same discontinuous jump can be observed for a fixed τu as λ increases from zero horizontally in Fig. 4.
Figure 4.

The threshold behavior depends on the nondimensional bystander isomer residence time in the ER (τu) and basal misfolded isomer/bystander isomer inflow rates into the ER (λ). We illustrate this result in the λ−τu parameter plane, which shows the number of physically realistic steady states for the model from Eq. 17. The boundary curves are given implicitly and parametrically by the solutions of Eq. 25 for n = 1 and m = 2. At the cusp point C, and . The model exhibits three steady states inside the closed area, and one steady state outside. (Inset) Figure detail.
Necessary conditions for the threshold behavior
To this point, the analysis of our model shows that there are three possible steady states for the extent of the reaction. According to the parameter plane analysis (Fig. 4), the threshold behavior is a function of τu and λ. In reality, the model can exhibit the threshold behavior if we guarantee the existence of two physically realistic and distinct tangency points. The conditions for the existence of two realistic and distinct tangency points will provide us with necessary conditions for the appearance of the threshold behavior in our model. After careful examination of the tangency point(s) given by Eq. 25, the model can have two real and distinct tangency points if the discriminant D is greater than zero:
| (29) |
As we discussed before, from the above inequality, the model requires n ≥ 1 and m ≥ 2.
The analysis of Eq. 29 needs to be divided into two cases: n = 1 and n ≥ 1. For the special case n = 1, the λ2 term is eliminated from the discriminant D, which leads to the necessary condition
| (30) |
However, note that the condition (Eq. 20) for the model to exhibit a physically realistic steady state when n = 1,
| (31) |
is stronger than condition given by Eq. 30. Therefore, for the special case n = 1, Eq. 31 is a necessary condition for the model to exhibit threshold behavior. For the more generic case n > 1, we need to solve the quadratic expression of Eq. 29. After some basic analysis, we find that the expression
| (32) |
is a necessary condition for the system to exhibit the threshold behavior when n > 1. Equations 31 and 32 permit us to assess the dependence of the threshold behavior on the ratio of basal misfolded isomer to bystander isomer inflow rates and the order of the reaction with respect to the misfolded isomer (Fig. 5). For a fixed value of λ, there are reaction order values that are favorable for the threshold behavior, as well as reaction order values that will guarantee monostability in the model. In the case that the reaction order exponents are favorable for the appearance of bistability, the threshold behavior will be exhibited if λ and τu are both in a parameter plane analysis region (Fig. 4) where the model has three steady states.
Figure 5.

The order of the reaction with respect to the misfolding isomer plays an important role in the appearance of the threshold behavior. We illustrate this point by showing the number of steady states in the parameter domain λ–n–m for our model equation (Eq. 17). The domains are defined by necessary conditions obtained from the solutions of the inequality from Eq. 29 for cases n = 1 and n > 1. (A) Equation 31 defines the domains for one steady state, and one-or-three steady states for the special case n = 1. (B) Equation 32 defines the same domains for one steady state, and one-or-three steady states for the case n > 1. The panels show that there are reaction order exponents which are favorable for the appearance of the threshold behavior for a fixed value of λ.
Discussion
We presented a model of bystander and misfolded protein interaction to investigate how the threshold behavior in protein misfolding is triggered in conformational diseases. In our model, bystander isomers are converted by the misfolded isomers through a process catalyzed by the misfolded isomers with a phenomenological rate of the form Eq. 3. We model the ER as a reactor with a continuous flow of bystander and misfolded isomers (Fig. 1), which is the direct result of basal protein synthesis and depletion. Conformational disease can either result from a dominant-negative effect of misfolded isomers, leading to a loss-of-function of the native folded protein, or from a toxic gain-of-function of the misfolded isomer. Interestingly we can investigate both loss-of-function and toxic gain-of-function diseases by modeling the extent of the overall reaction between bystander and misfolded isomers.
Previous studies (16–19) showed that the threshold behavior in conformational diseases is caused by the nonlinear phenomenon known as bistability. Our mathematical model also displayed bistability, though it is qualitatively different from the other models. In Rieger et al. (16), protein misfolding and aggregation are regulated by folding chaperones. In our model, protein misfolding cannot be reversed by folding chaperones. The other models (17–19) focus on the quantification of prion infection dynamics. We do not investigate the role of protein misfolding in infection by prions.
In our model, there are three possible steady states; two of these steady states are stable to small perturbations and are easily observable under physiological conditions.The stable steady state with the lower bystander isomer depletion and lower misfolded production is characterized by the fast flow of bystander isomers in the ER lumen. On the other hand, the stable steady state with the higher bystander depletion and higher misfolded production causes the outbreak of the conformational disease (Fig. 3). Our analysis showed that the appearance of the threshold behavior depends on two parameters: the ratio of basal misfolded isomer to bystander isomer inflow rates λ, and the bystander isomer residence time τu (Fig. 4). These parameters are external to the misfolding reaction mechanism, because they are driven by the ER protein production, folding, and export machinery. We also found that there are values of the order of the reaction with respect to the misfolded isomer that favor the appearance of the threshold behavior (Fig. 5). This reaction order is an internal property of the reaction mechanism, because it can depend specifically on the nature of the elementary reactions driving protein misfolding.
The appearance of bistability has important implications for the onset and rescue of conformational diseases.
What are the factors that can cause the outbreak of protein misfolding in conformational diseases?
Here we must relate the parameters controlling the appearance of bistability to the steady-state values of the model x∗ shown in Fig. 6. A low x∗ implies a high bystander isomer concentration (and a low misfolded isomer production) at steady state, while a high x∗ implies a low bystander isomer concentration (and high misfolded isomer production) at steady state. An outbreak of misfolding isomer production can be the result of increasing the transition time of the bystander protein in the ER (Fig. 6 A, control versus τu = 1.5) above the threshold behavior point. Current experimental evidence supports this observation. An increase in the bystander proinsulin transition time in the Akita mice results in Mutant INS-gene Induced Diabetes of Youth (5,6).
Figure 6.
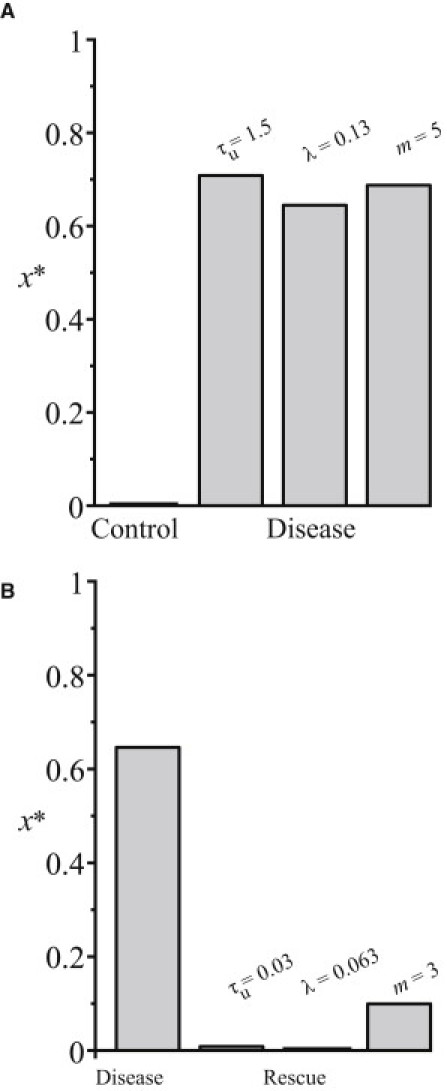
Parameters involved in the onset and rescue of conformational diseases. A low x∗ implies a high bystander isomer concentration at steady state, while a high x∗ implies a low bystander isomer concentration at steady state. (A) Here, we illustrate how the onset of conformational disease can be caused by increasing the transition time of the bystander protein in the ER (τu), basal misfolded isomer/bystander isomer inflow rates in the ER (λ), or the misfolded isomer reaction order (m). Parameter values for control: τu = 0.45, λ = 0.025, n = 4, and m = 4. (B) Bystander protein concentration is rescued by decreasing τu, λ, or m. Parameter values for disease are τu = 0.10, λ = 0.1875, n = 4, and m = 5.
Alternatively, depletion of bystander protein will reach a loss-of-function point if we increase the ratio of basal misfolded isomer to bystander isomer inflow rates in the ER (Fig. 6 A, control versus λ = 0.13) above the threshold point. This ratio can be increased by overexpression of the basal misfolded isomer levels. There is experimental evidence to support this model prediction. In the Akita mouse, higher levels of misfolded proinsulin results in fulminant diabetes within two weeks of life (40) and in a reduction of bystander insulin (6). Similar results have been reported for the toxicity of Dutch E22Q and Flemish A21G mutant amyloid β proteins in human cerebral microvessel and aortic smooth muscle cells (9). Interestingly, our model predicts that an increase of the order of the misfolded isomer can trigger the outbreak in misfolding isomer production and the depletion of bystander protein (Fig. 6 A, control versus m = 5). This reaction order exponent will increase if the number of misfolded isomers involved in the recruitment of bystander proteins into aberrant isomer complexes increases. More work is needed to characterize, precisely, the reaction mechanisms involved in the recruitment of bystander proteins into misfolded isomer complexes.
From the disease rescue point of view, what can be done to rescue bystander isomers or decrease misfolded isomer production?
A general increase in the folding capacity of the ER can reduce the bystander isomer residence time (41), resulting in the rescue of bystander protein (Fig. 6 B, disease versus τu = 0.03). Rieger et al. (16) proposed that the overexpression of molecular chaperones can increase folding capacity, reducing protein misfolding and aggregation in neurodegenerative diseases. Of course, the ability to rescue bystander protein by decreasing the bystander residence time will likely depend on the specific nature of the protein itself, which will in turn influence the folding and trafficking pathways accessible to the protein (42).
Alternatively, bystander proteins can be rescued by decreasing the ratio of basal misfolded isomer to bystander isomer inflow rates in the ER (Fig. 6 B, disease versus λ = 0.063). This ratio can be decreased by the upregulation of basal isomer inflow or downregulation of the basal misfolded isomer inflow. This rescue mechanism can be tested by increasing the expression of the bystander isomer with varying levels and verifying that rescue is not caused by a general increase in folding capacity of the ER. Another strategy for rescuing from the conformational disease is to reduce the reaction order of the misfolded isomer (Fig. 6 B, disease versus m = 3). The reduction of reaction order m can be achieved through the introduction of pharmacological inhibitors, which block elementary reactions involving the association of misfolded isomers into complexes. Pharmacological agents can also affect τu by changing the reaction coefficient k.
The above potential therapies must account for the hysteresis in bistable systems. The rescue of the system to the high bystander concentration (or low misfolded isomer production) requires a decrease of τu, λ, and m below the threshold point level to overcome the hysteresis phenomena due to bistability.
Concluding Remarks
Our model proposes qualitative ideas for the rescue of conformational diseases. It is not easy to determine an optimal strategy quantitatively, particularly because the specific nature of the protein and its misfolding pathway must be taken into account. Therefore, a more detailed description of the bystander and misfolded protein reaction mechanism and their interactions with the ER machinery is required. The modeling of these detailed mechanisms will allow us to investigate the control of the threshold behavior and to develop a more complete and quantitative theory for the design of rescue strategies for specific conformational diseases.
Acknowledgments
The authors thank Michael Bell, Erin Shellman, Samantha Thomas, and Michelle Wynn (University of Michigan Medical School) for their comments. We also thank the anonymous reviewers for their constructive comments.
C.I.S. is supported by the National Institutes of Health's Ruth L. Kirschstein National Research Service Award Predoctoral Fellowship Award to Promote Diversity in Health-Related Research (award No. F31GM0967728). This work has also been funded by a grant of the James S. McDonnell Foundation under the 21st Century Science Initiative, Studying Complex Systems Program. The content is solely the responsibility of the authors and does not necessarily represent the official views of the National Institute of General Medical Sciences or the National Institutes of Health.
Footnotes
This article is dedicated to the memory of Cleo Martin Sandefur.
Appendix A
The shape of yr(x)
To distinguish between unique and multiple steady states, we need to understand the shape of yr(x) for x = [0,1]. The equation of yr(x) is a (n+m)th order polynomial of the form
| (33) |
First, we proceed to calculate the critical points of Eq. 33 by determining the values of x for which the derivative of Eq. 33 with respect to x is equal to zero. This becomes
| (34) |
The critical values satisfying the above equation are
| (35) |
Using the second derivative test, we determine that the function yr(x) is concave downward and has a maximum at the critical point x = 1−n(τr + θ)/τr (n+m):
| (36) |
The maximum value is, therefore,
| (37) |
References
- 1.Morimoto R.I. Proteotoxic stress and inducible chaperone networks in neurodegenerative disease and aging. Genes Dev. 2008;22:1427–1438. doi: 10.1101/gad.1657108. [DOI] [PMC free article] [PubMed] [Google Scholar]
- 2.Schroder M., Kaufman R.J. ER stress and the unfolded protein response. Mut. Res. 2005;569:29–63. doi: 10.1016/j.mrfmmm.2004.06.056. [DOI] [PubMed] [Google Scholar]
- 3.Nakatsukasa K., Brodsky J.L. The recognition and retrotranslocation of misfolded proteins from the endoplasmic reticulum. Traffic. 2008;9:861–870. doi: 10.1111/j.1600-0854.2008.00729.x. [DOI] [PMC free article] [PubMed] [Google Scholar]
- 4.Gidalevitz T., Ben-Zvi A., Morimoto R.I. Progressive disruption of cellular protein folding in models of polyglutamine diseases. Science. 2006;311:1471–1474. doi: 10.1126/science.1124514. [DOI] [PubMed] [Google Scholar]
- 5.Liu M., Hodish I., Arvan P. Proinsulin maturation, misfolding, and proteotoxicity. Proc. Natl. Acad. Sci. USA. 2007;104:15841–15846. doi: 10.1073/pnas.0702697104. [DOI] [PMC free article] [PubMed] [Google Scholar]
- 6.Hodish I., Liu M., Arvan P. Misfolded proinsulin affects bystander proinsulin in neonatal diabetes. J. Biol. Chem. 2010;285:685–694. doi: 10.1074/jbc.M109.038042. [DOI] [PMC free article] [PubMed] [Google Scholar]
- 7.Liu M., Hodish I., Arvan P. Proinsulin misfolding and diabetes: mutant INS gene-induced diabetes of youth. Trends Endocrinol. Metab. 2010;21:652–659. doi: 10.1016/j.tem.2010.07.001. [DOI] [PMC free article] [PubMed] [Google Scholar]
- 8.Rahkonen O., Su M., Penttinen R. Mice with a deletion in the first intron of the Col1a1 gene develop age-dependent aortic dissection and rupture. Circ. Res. 2004;94:83–90. doi: 10.1161/01.RES.0000108263.74520.15. [DOI] [PubMed] [Google Scholar]
- 9.Wang Z., Natté R., Vinters H.V. Toxicity of Dutch (E22Q) and Flemish (A21G) mutant amyloid-β proteins to human cerebral microvessel and aortic smooth muscle cells. Stroke. 2000;31:534–538. doi: 10.1161/01.str.31.2.534. [DOI] [PubMed] [Google Scholar]
- 10.Gray P., Scott S.K. Oxford University Press; Oxford, UK: 1994. Chemical Oscillations and Instabilities. [Google Scholar]
- 11.Epstein I.R., Pojman J.A. Oxford University Press; New York: 1998. An Introduction to Nonlinear Chemical Dynamics. [Google Scholar]
- 12.Meersman F., Heremans K. Temperature-induced dissociation of protein aggregates: accessing the denatured state. Biochemistry. 2003;42:14234–14241. doi: 10.1021/bi035623e. [DOI] [PubMed] [Google Scholar]
- 13.Ferrão-Gonzales A.D., Souto S.O., Foguel D. The preaggregated state of an amyloidogenic protein: hydrostatic pressure converts native transthyretin into the amyloidogenic state. Proc. Natl. Acad. Sci. USA. 2000;97:6445–6450. doi: 10.1073/pnas.97.12.6445. [DOI] [PMC free article] [PubMed] [Google Scholar]
- 14.Giger K., Vanam R.P., Dubin P.L. Suppression of insulin aggregation by heparin. Biomacromolecules. 2008;9:2338–2344. doi: 10.1021/bm8002557. [DOI] [PubMed] [Google Scholar]
- 15.Lai Z., McCulloch J., Kelly J.W. Guanidine hydrochloride-induced denaturation and refolding of transthyretin exhibits a marked hysteresis: equilibria with high kinetic barriers. Biochemistry. 1997;36:10230–10239. doi: 10.1021/bi963195p. [DOI] [PubMed] [Google Scholar]
- 16.Rieger T.R., Morimoto R.I., Hatzimanikatis V. Bistability explains threshold phenomena in protein aggregation both in vitro and in vivo. Biophys. J. 2006;90:886–895. doi: 10.1529/biophysj.105.066662. [DOI] [PMC free article] [PubMed] [Google Scholar]
- 17.Kacser H., Small J.R. How many phenotypes from one genotype? The case of prion diseases. J. Theor. Biol. 1996;182:209–218. doi: 10.1006/jtbi.1996.0157. [DOI] [PubMed] [Google Scholar]
- 18.Laurent M. Prion diseases and the ‘protein only’ hypothesis: a theoretical dynamic study. Biochem. J. 1996;318:35–39. doi: 10.1042/bj3180035. [DOI] [PMC free article] [PubMed] [Google Scholar]
- 19.Porcher E., Gatto M. Quantifying the dynamics of prion infection: a bifurcation analysis of Laurent's model. J. Theor. Biol. 2000;205:283–296. doi: 10.1006/jtbi.2000.2068. [DOI] [PubMed] [Google Scholar]
- 20.Cohen R.J., Benedek G.B. Equilibrium and kinetic theory of polymerization and the sol-gel transition. J. Phys. Chem. 1982;86:3696–3714. [Google Scholar]
- 21.Kellershohn N., Laurent M. Prion diseases: dynamics of the infection and properties of the bistable transition. Biophys. J. 2001;81:2517–2529. doi: 10.1016/S0006-3495(01)75897-3. [DOI] [PMC free article] [PubMed] [Google Scholar]
- 22.Chiti F., Dobson C.M. Protein misfolding, functional amyloid, and human disease. Annu. Rev. Biochem. 2006;75:333–366. doi: 10.1146/annurev.biochem.75.101304.123901. [DOI] [PubMed] [Google Scholar]
- 23.Zhang B.Y., Liu M., Arvan P. Behavior in the eukaryotic secretory pathway of insulin-containing fusion proteins and single-chain insulins bearing various B-chain mutations. J. Biol. Chem. 2003;278:3687–3693. doi: 10.1074/jbc.M209474200. [DOI] [PubMed] [Google Scholar]
- 24.Liu M., Ramos-Castañeda J., Arvan P. Role of the connecting peptide in insulin biosynthesis. J. Biol. Chem. 2003;278:14798–14805. doi: 10.1074/jbc.M212070200. [DOI] [PubMed] [Google Scholar]
- 25.Liu M., Li Y., Arvan P. Proinsulin disulfide maturation and misfolding in the endoplasmic reticulum. J. Biol. Chem. 2005;280:13209–13212. doi: 10.1074/jbc.C400475200. [DOI] [PMC free article] [PubMed] [Google Scholar]
- 26.Grant A.G., Hoffenberg R. The effect of dietary protein deprivation on protein synthesis in the isolated liver parenchymal cell. Br. J. Nutr. 1977;38:255–260. doi: 10.1079/bjn19770086. [DOI] [PubMed] [Google Scholar]
- 27.Hayase K., Yokogoshi H. Age affects brain protein synthesis in rats. J. Nutr. 1994;124:683–688. doi: 10.1093/jn/124.5.683. [DOI] [PubMed] [Google Scholar]
- 28.Anelli T., Sitia R. Protein quality control in the early secretory pathway. EMBO J. 2008;27:315–327. doi: 10.1038/sj.emboj.7601974. [DOI] [PMC free article] [PubMed] [Google Scholar]
- 29.Kincaid M.M., Cooper A.A. Misfolded proteins traffic from the endoplasmic reticulum (ER) due to ER export signals. Mol. Biol. Cell. 2007;18:455–463. doi: 10.1091/mbc.E06-08-0696. [DOI] [PMC free article] [PubMed] [Google Scholar]
- 30.Cleland J.L., Powell M.F., Shire S.J. The development of stable protein formulations: a close look at protein aggregation, deamidation, and oxidation. Crit. Rev. Ther. Drug Carrier Syst. 1993;10:307–377. [PubMed] [Google Scholar]
- 31.Fink A.L. Protein aggregation: folding aggregates, inclusion bodies and amyloid. Fold. Des. 1998;3:R9–R23. doi: 10.1016/S1359-0278(98)00002-9. [DOI] [PubMed] [Google Scholar]
- 32.Morris A.M., Watzky M.A., Finke R.G. Protein aggregation kinetics, mechanism, and curve-fitting: a review of the literature. Biochim. Biophys. Acta. 2009;1794:375–397. doi: 10.1016/j.bbapap.2008.10.016. [DOI] [PubMed] [Google Scholar]
- 33.Roberts C.J. Non-native protein aggregation kinetics. Biotechnol. Bioeng. 2007;98:927–938. doi: 10.1002/bit.21627. [DOI] [PubMed] [Google Scholar]
- 34.Privalov P.L. Intermediate states in protein folding. J. Mol. Biol. 1996;258:707–725. doi: 10.1006/jmbi.1996.0280. [DOI] [PubMed] [Google Scholar]
- 35.Wetzel R. For protein misassembly, it's the “I” decade. Cell. 1996;86:699–702. doi: 10.1016/s0092-8674(00)80143-9. [DOI] [PubMed] [Google Scholar]
- 36.Morris A.M., Watzky M.A., Finke R.G. Fitting neurological protein aggregation kinetic data via a 2-step, minimal/“Ockham's razor” model: the Finke-Watzky mechanism of nucleation followed by autocatalytic surface growth. Biochemistry. 2008;47:2413–2427. doi: 10.1021/bi701899y. [DOI] [PubMed] [Google Scholar]
- 37.Speed M.A., King J., Wang D.I. Polymerization mechanism of polypeptide chain aggregation. Biotechnol. Bioeng. 1997;54:333–343. doi: 10.1002/(SICI)1097-0290(19970520)54:4<333::AID-BIT6>3.0.CO;2-L. [DOI] [PubMed] [Google Scholar]
- 38.Gast K., Modler A.J., Damaschun G. Effect of environmental conditions on aggregation and fibril formation of barstar. Eur. Biophys. J. 2003;32:710–723. doi: 10.1007/s00249-003-0336-5. [DOI] [PubMed] [Google Scholar]
- 39.Segel L.A. Simplification and scaling. SIAM Rev. 1972;14:547–571. [Google Scholar]
- 40.Kayo T., Koizumi A. Mapping of murine diabetogenic gene MODY on chromosome 7 at D7Mit258 and its involvement in pancreatic islet and β-cell development during the perinatal period. J. Clin. Invest. 1998;101:2112–2118. doi: 10.1172/JCI1842. [DOI] [PMC free article] [PubMed] [Google Scholar]
- 41.Christis C., Fullaondo A., Braakman I. Regulated increase in folding capacity prevents unfolded protein stress in the ER. J. Cell Sci. 2010;123:787–794. doi: 10.1242/jcs.041111. [DOI] [PMC free article] [PubMed] [Google Scholar]
- 42.Schnell S. A model of the unfolded protein response: pancreatic β-cell as a case study. Cell. Physiol. Biochem. 2009;23:233–244. doi: 10.1159/000218170. [DOI] [PubMed] [Google Scholar]