

Abstract
The sequence of a DNA molecule is known to influence its secondary structure and flexibility. Using a combination of bulk and single-molecule techniques, we measure the structural and mechanical properties of two DNAs which differ in both sequence and base-stacking arrangement in aqueous buffer, as revealed by circular dichroism: one with 50% G·C content and B-form and the other with 70% G·C content and A-form. Atomic force microscopy measurements reveal that the local A-form structure of the high-G·C DNA does not lead to a global contour-length decrease with respect to that of the molecule in B-form although it affects its persistence length. In the presence of force, however, the stiffness of high-G·C content DNA is similar to that of balanced-G·C DNA as magnetic and optical tweezers measured typical values for the persistence length of both DNA substrates. This indicates that sequence-induced local distortions from the B-form are compromised under tension. Finally, high-G·C DNA is significantly harder to stretch than 50%-G·C DNA as manifested by a larger stretch modulus. Our results show that a local, basepair configuration of DNA induced by high-G·C content influences the stretching elasticity of the polymer but that it does not affect the global, double-helix arrangement.
Introduction
The sequence of nucleotide bases is known to affect the structure of DNA (1) and it is expected that such structural details promote a specific dynamical behavior in solution. Moreover, environmental conditions have been shown to modulate the DNA thermally induced mechanical properties (2,3) which affect its biological function. For instance, the processing of DNA by proteins involves specific interactions which are influenced by its mechanical malleability. Therefore, the local conformational details of DNA are essential to understand the mechanisms of many processes like protein DNA-binding, packaging inside viral capsids, or the energetics involved in replication and transcription.
DNA polymorphism has been studied using a variety of spectroscopic techniques which describe the basepair arrangement at the atomic level (1,4). In physiological conditions, circular dichroism (CD) is a straightforward technique in the analysis of nucleic acids' secondary structure (5,6). From CD studies, it is known that DNA in physiological conditions adopts the B form, but also that it is not an immutable structure. In particular, it has been shown that the local base arrangement can affect the double-helix global conformation by promoting a structure similar to that of dsRNA (1,7,8).
Sequence-dependent effects have also been observed in the mechanical stability of DNA (9). Specifically, overstretching, melting, and unzipping transitions have been studied with DNAs of different G·C composition. The G·C content is also implicated in DNA polymorphism (4). In particular, it has been reported that G·C-rich regions of dsDNA are more prone to adopt the A-form than A·T-rich regions (7,10,11). Due to the different behavior of DNAs with different G·C composition, the effect of DNA sequence and local structure on its persistence length and contour length represents an essential analysis. Likewise, sequence- and structure-dependent effects may influence the elastic stretch modulus of the polymer at high forces.
Over the last years, DNA has been extensively studied with single-molecule methods (12). Mechanical properties of the different structural states of nucleic acids can be made available through this approach with insight into equilibrium conditions (13,14). Optical tweezers (OT) give access to the elasticity of single DNA molecules in a long range of forces which comprises the entropic regime, where the molecule behaves as an entropic spring, the intrinsic regime, where the molecule deviates from the inextensible wormlike chain (WLC) model because it is stretched beyond its contour length, and the overstretching transition (15). The elastic stretch modulus and the persistence length are thus accessible at high forces with this technique. Magnetic tweezers (MT) allow a precise control of the forces involved in the entropic regime. Both the persistence length and the contour length can be studied under low stretching forces with this technique. The combination of these methodologies provides an accurate measurement of the elastic properties of DNA under stress before the polymer denatures in the overstretching transition. Finally, atomic force microscopy (AFM) is an appropriate technique to directly determine the contour-length of an individual molecule and for the analysis of the persistence length at zero force (13,16,17).
Here, we investigate the elastic properties of individual dsDNA molecules of high-G·C content with A-type base-stacking arrangement. We use a linear fragment of plasmid piJ702 from Streptomyces which contains a 70% makeup of G·C basepairs and adopts A-form in buffer solution. As a control, we analyze the behavior of a 50%-G·C content linearized plasmid (pBACgus11 (18)), which is stable in B form in the same buffer solution. We begin by characterizing the secondary structure of these plasmids by using CD in aqueous solution. We show that, as mentioned, piJ702 adopts A-type base-stacking and pBACgus11 adopts B-type base-stacking. Then, we study the single-molecule behavior of these prototype molecules under two different mechanical conditions: in the absence of a force, where the molecule is left to equilibrate on a flat surface, and in the presence of an external force, where the molecule is stretched lengthwise in aqueous buffer.
At zero force, we use AFM imaging, and in the presence of tension, we use OT and MT for high and low forces, respectively. Contrary to the expected scenario in which A-DNA is shorter than B-DNA, we determine by AFM that both plasmids have the same mean rise per basepair. We also use AFM to measure the persistence length of the molecules at zero force. As validated by Rivetti et al. (19), AFM imaging of DNA deposited under equilibrium conditions combined with two-dimensional data analysis based on polymer-chain statistics can be used to infer the persistence length of DNA molecules to a high degree of precision. The persistence length of the molecules equilibrated at zero force indicates structural differences stemming from the base-stacking arrangement: B-DNA shows typical values for this parameter whereas A-DNA shows values which resemble those obtained for dsRNA (13). Thereafter, we analyze the behavior of the two DNAs in the presence of force. Specifically, we measured force-extension curves with both MT and OT to study DNA elasticity up to forces which produce the so-called overstretching transition.
The contour-length of both substrates accurately complies with that of B-DNA at all range of forces, thus confirming the zero-force AFM measurements. In the presence of tension, the analysis of the extent of the overstretching plateau and the persistence length render typical values for both plasmids. The analysis of the stretch modulus at high forces, however, reveals that the high-G·C content DNA is harder to elongate than the plasmid with a more balanced base composition. Overall, we find that DNA sequence affects the base-stacking configuration, a structural feature which influences the stretching elasticity of the polymer, but that such local behavior does not significantly affect the global helical arrangement.
Materials and Methods
DNA samples
Two kinds of DNA molecules with different G·C content were used: a ∼8 kbp dsDNA molecule with 48% G·C, obtained from pBACgus11 plasmid (Novagen, Darmstadt, Germany) and a ∼5.7 kbp dsDNA molecule with 70% G·C made from piJ702 plasmid purified from Streptomyces (20). Circular plasmids were linearized by digestion with HindIII (pBACgus11) and NdeI (piJ702) and purified by using the Qiagen PCR Purification Kit (Qiagen, Venlo, The Netherlands) and phenol, respectively. These DNA substrates were 8041 bp (pBACgus11) and 5724 bp (piJ702) and were ready to be used in CD and AFM experiments (see AFM Sample Preparation, below).
For OT and MT experiments, the plasmids were cleaved with BamHI and HindIII (pBACgus11) and BamHI and XhoI (piJ702) which gave DNA fragments of 8022 bp (pBACgus11) and 5682 bp (piJ702). Linearized substrates used for each technique thus differed in length by <0.8%. Cohesive ends were ligated to two labeled DNA handles at each end of the DNA molecule. The DIG handle was a 400-bp-PCR product made by using digoxigenin-11-dUTP (Roche, Basel, Switzerland) and was ligated to the BamHI end of both DNAs. The other end was labeled with two 20-bp complementary oligos containing two biotins in the same strand at the 5′-end. Ligation was performed with T4 DNA Ligase (Roche) using protocols described in Ibarra et al. (18). All restriction enzymes were purchased from New England Biolabs (Ipswich, MA). DNA substrates were stored in TE buffer (10 mM Tris-HCl, 1 mM EDTA, pH 7.5). Fig. 1 A shows the average G·C content of each DNA substrate.
Figure 1.
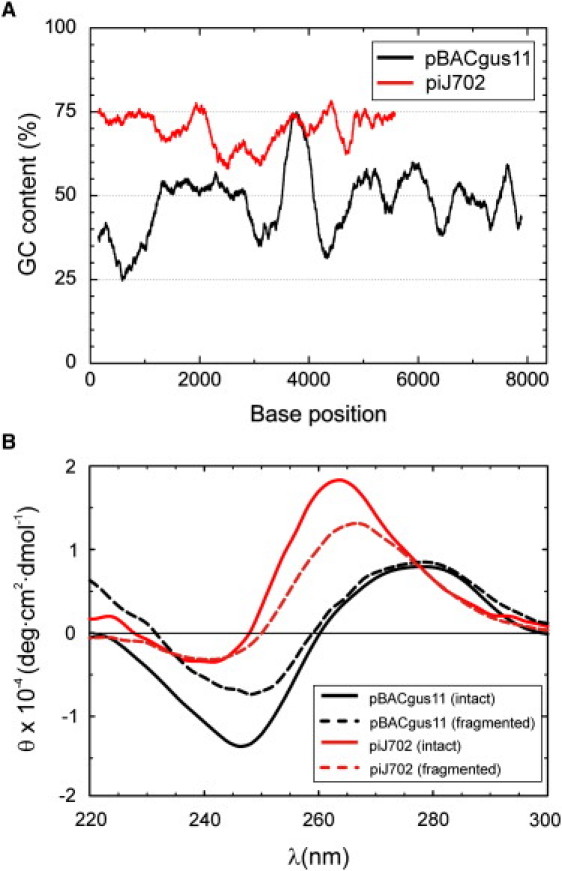
DNA used and circular dichroism characterization. (A) Distribution of G·C basepairs in the two plasmid DNAs. The graph shows the G·C content (G·C%) averaged over 300 bp along the sequence of pBACgus11 plasmid (black curve) from 1 to 8041 bp and piJ702 plasmid (red curve) from 1 to 5724 bp (sequences available upon request). (B) Normalized CD spectra (molar ellipticity per residue) of the two plasmid DNAs in 1 mM NaCl TE buffer. (Solid lines) Intact linearized plasmids of pBACgus11 (black line, 0.7 × 10⁻⁴ M DNA residue) and piJ702 (red line, 1.4 × 10⁻⁴ M DNA residue). (Dashed lines) Fragmented plasmids after 1-h sonication. (Dashed black line) pBACgus11 in fragments with length distribution in the range of 150–600 bp and concentration 2 × 10⁻⁴ M DNA residue. (Dashed red line) piJ702 in fragments with lengths of 100–300 bp, 6 × 10⁻⁴ M DNA residue.
Circular dichroism
Circular dichroism (CD) spectra were collected at 20°C on a model No. J-810 spectropolarimeter (JASCO, Tokyo, Japan) using a quartz cuvette with a 0.2-cm-path-length. Linearized plasmids without handles as described above were used. CD spectra were averaged over 10 scans. Spectra of solutions without DNA were taken as baselines and subtracted from the final DNA spectra. The scan speed was 100 nm/min. The CD intensity is expressed as mean residue ellipticity, θ (deg·cm2·dmol−1). CD spectra were collected with both intact and fragmented DNAs. DNAs of lengths from 150 to 600 bp (pBACgus11) and from 100 to 300 bp (piJ702) were prepared by sonication. Volumes of 500 μL of DNA (97 ng/μL for pBACgus11 and 180 ng/μL for piJ702) in 1 mM NaCl TE buffer solution were sonicated in ice using a Labsonic U tip sonicator (B. Braun Biotech International, Melsungen, Germany). The sonication procedure was performed both continuously for 1 h and by monitoring intervals at 5, 10, 20, 30, and 60 min. Size distributions for aliquots of 5 μL were determined by electrophoresis in an ethidium-bromide-stained 1.5% agarose gel. A sonication period of 1 h produced fragments of approximately the same mean size (200 bp) as those for a 30-min period and almost the same as for a 5-min period, being the spread of the size distribution larger for shorter sonication times, in agreement with Chen et al. (21). CD measurements after a 30-min sonication period for piJ702 produced similar signals as for a 1-h period, thus indicating that the CD signals were related to the average fragment size and not to the duration of the sonication procedure.
AFM sample preparation
DNA samples for AFM imaging and analysis were prepared by depositing 11 ng of DNA (∼0.3 nM molecules) diluted in 10 mM Tris-HCl (pH 8.0) and supplemented with 15 mM MgCl2, onto freshly cleaved mica. After 30 s, the mica surface was washed with MilliQ-filtered water (Millipore, Billerica, MA) and blown dry in a gentle stream of nitrogen gas. AFM results are based on two-dimensional equilibration of molecules on the mica surface. These adsorption conditions require the use of divalent ions (Mg2+), instead of monovalent ions like Na+ which does not promote molecule adsorption. Samples were imaged at 1.95 nm per pixel resolution in air at room temperature and low humidity using tapping mode. The experiments were performed with an AFM from Nanotec (Nanotec Electrónica, Madrid, Spain) and tapping mode PointProbePlus tips, type PPP-NCH (Nanosensors, Neuchâtel, Switzerland) was used. Image processing consisted of in-plane subtraction and flattening and was carried out using WSxM freeware (22). Traces were obtained using the tracing routine described in Wiggins et al. (23).
Magnetic tweezers technique
The MT technique used is similar to the one described in Abels et al. (13) (Fig. 3 A). Briefly, it consists of an inverted optical microscope where the sample is placed in a liquid chamber built up from two microscope cover slides separated by a thin layer of parafilm (∼200 μm) leaving a volume of ∼100 μL. In the upper cover slide, two holes are drilled, giving access to the inner chamber and allowing exchange of liquids. The lower cover slide is placed over an oil immersion objective (100×, 1.4 NA; Olympus, Melville, NY) whose movement can be controlled using a piezoelectric stage (PIFoc; Physik Instrumente, Karlsruhe, Germany). A linear nucleic acid polymer is tethered in the liquid cell to the bottom glass surface via multiple Dig-α-Dig linkages at one end and to a superparamagnetic 1.0 μm bead (Dynabeads MyOne; Invitrogen, Carlsbad, CA) at the other end. Above the cell, a parallel light source is located, as well as two square magnets that can be translated and rotated, allowing us to vary force and torsion on the bead. Two 6 × 6 × 5 mm3 neodynium-iron-boron (NdFeB) permanent magnets (Binder Magnetic, Gennevilliers, France) separated by 1.4 mm were used. Images from the bead were captured with a charge-coupled device camera with a sampling rate of 120 Hz (model No. TM6710CL; PULNiX America, Sunnyvale, CA) and they were used to extract the bead mean 〈z〉 from the glass surface and the value of its transverse fluctuations 〈δx2〉. From these measurements, we calculated the force applied on a single DNA molecule by using the equation F = kBT 〈z〉/〈δx2〉, where kB is Boltzmann's constant and T is the temperature in Kelvin. Beads positions were tracked in x, y, and z directions with an accuracy of ∼10 nm for a 0.5 s time-filtering. MT experiments were done in 80 mM NaCl TE buffer.
Figure 3.
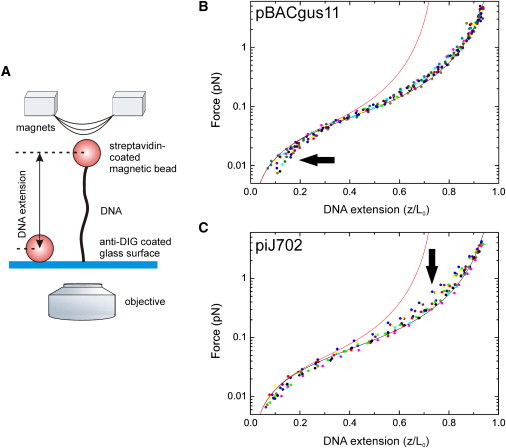
Force-extension curves of pBACgus11 and piJ702 substrates using magnetic tweezers. (A) Cartoon of the experimental MT configuration (not to scale). A single DNA molecule is tethered between a paramagnetic bead on one end, and to a glass surface on the other end in 80 mM NaCl TE buffer. Molecules are rotationally unconstrained due to single biotin-streptavidin and dig-antidigoxigenin attachments. Force is controlled by the position of the magnets and distances are measured from optical images of bead diffraction rings. (B) Force-extension data on pBACgus11 substrates. Raw data was fit to Eq. 3 from which a value for P and L0 was extracted. For the purpose of comparison, DNA extension was normalized to the fitted L0 value. Different colors represent different individual DNA molecules. In the plot, 14 pBACgus11 molecules are included. (C) Force-extension data on piJ702 substrates (n = 10). (Red curves) Force-extension curve, according to Eq. 3, of a molecule with a rise per basepair of 0.256 nm and a P = 63.8 nm.
Optical tweezers technique
The optical design includes a dual-counterpropagating-beam (λ = 835 nm) optical trap capable of measuring forces as changes in light momentum flux (24). In each experiment, a single DNA molecule is tethered by opposite ends between two dielectric microspheres: an α-Dig-coated bead, which is optically trapped, and a streptavidin-coated bead, which is held by suction on top of a micropipette inside the fluid chamber (Fig. 4 A). Streptavidin-coated, 2.10-μm-diameter beads and G-protein-coated, 3.18-μm-diameter polystyrene beads, purchased from Spherotech (Libertyville, IL), were used. α-Dig was linked to the G-coated beads using dimethyl pimelimidate dihydrochloride. The force on the DNA molecule is generated by moving the micropipette relative to the trapped bead through a piezo-controlled stage, and its extension is determined from the distance between bead centers. Tethered DNA molecules were stretched and relaxed at 500 nm/s. All tweezers experiments were carried out at room temperature, 23 ± 1°C in 80 mM NaCl TE buffer.
Figure 4.
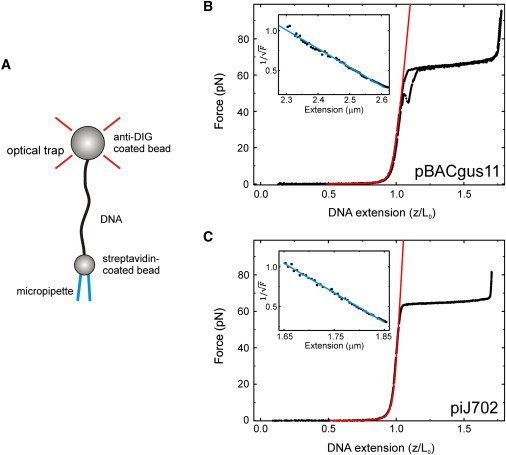
Force-extension characterization of pBACgus11 and piJ702 substrates using optical tweezers. (A) Cartoon of a dsDNA molecule as placed in the OT (not to scale). The molecule is tethered between a bead (biotin-streptavidin linkage), held by suction on the top of a micropipette, and an optically trapped bead (Dig-α-Dig linkage). The molecule can be stretched by moving the micropipette through a piezo-actuator. Normalized force-extension curves (black dots correspond to data points) of a pBACgus11 (B) and a piJ702 molecule (C) with their respective fittings to the extensible WLC (Eq. 5) in 80 mM NaCl TE buffer (red lines). The fits for these examples yielded values L0 = 2.69 μm, P = 49.9 nm, and S = 838 pN for pBACgus11 and L0 = 1.92 μm, P = 57.5 nm, and S = 1476 pN for piJ702. (Insets) Linear relation between force−1/2 and z when z approaches L0, characteristic of a strong-stretching WLC behavior. (Blue lines) Inextensible WLC (Eq. 4). Linear fits of these particular data yielded L0 = 2.73 μm and P = 41.4 nm for pBACgus11, and L0 = 1.93 μm and P = 52.2 nm for piJ702.
Results
Circular dichroism bulk characterization of DNA
Circular dichroism (CD) spectroscopy has been shown to be a powerful technique to study secondary structure of DNA (25). Because the G·C content is an important determinant of DNA base-stacking conformation (7,10), we first checked the CD signals of our two DNA substrates: pBACgus11, with 48% G·C, and piJ702, with 70% G·C. Fig. 1 A shows the average G·C content of each DNA substrate. Fig. 1 B (black and red solid lines) shows CD spectra of linear pBACgus11 and piJ702, respectively, in a low-salt buffer solution. The resulting CD spectrum of control DNA pBACgus11 (48% G·C) is typical for the canonical B-form with approximately equal positive (with a maximum near 275 nm) and negative (with a minimum near ∼247 nm) bands intersected at ∼260 nm (6). In contrast, the CD spectrum of piJ702 (70% G·C) is dominated by a positive band with a maximum at a wavelength of ∼264 nm and a small negative band at ∼240 nm. This signal is very similar to that of DNA at low water activity and double-stranded RNA (dsRNA) (6,26). G·C-rich DNA was shown to favor A-form at low ethanol concentrations (10) and, in fact, synthetic poly(dG)·poly(dC) can adopt A-form in aqueous solution (7). Therefore, our CD data show that the piJ702 substrate adopts an A-form base-stacking in buffer.
To study the influence of DNA length in the CD signals, we also characterized the fragmented plasmids. Fig. 1 B (black and red dashed lines, respectively) shows CD spectra of sonicated fragments of pBACgus11 and piJ702 in the same buffer solution. The 1-h sonication procedure generated segments of 150–600 bp for pBACgus11 and of 100–300 bp for piJ702 according to analytical gel electrophoresis. Sonication at intermediate time (30 min) did not produce significant changes in CD measurements with respect to the 1-h sonication procedure (data not shown). The spectrum of each DNA conserve the qualitative features described above for B- and A-type CD spectra in pBACgus11 and piJ702, respectively, and therefore these measurements underline that the CD structural information stems from the local (base-stacking) arrangement. The fact that CD spectrum patterns for either B- or A-form are more marked for intact, linearized plasmids than for the fragmented samples suggests that intrastrand association of double-helical chain domains, which have a higher tendency to happen for long fragments, contributes to the final CD signal (27).
A-DNA adopts a conformation closely related to that of dsRNA. From measurements on dsRNA, it became clear that the rise per basepair was notably smaller than that for dsDNA, which was considered to adopt a B-form structure. Despite the wide range of values reported for the A-family isoforms, the consensus is that a typical rise per basepair for A-DNA is 2.56 Å, for dsRNA is 2.8 Å, and for B-DNA is 3.38 Å (1). These values could experimentally be calculated by measuring, for instance, the contour length of the molecule as the number of basepairs contained in the molecule is known. Published data also showed that dsRNA (A-form) has an increased rigidity compared to dsDNA (B-form) (28). In the light of previous background, we decided to investigate whether the structural differences of piJ702, shown by its A-form CD signal, affect global parameters like the contour length, persistence length, and stretch modulus by using single-molecule techniques.
Single-molecule atomic force microscopy analysis at zero force
DNA samples were adsorbed on a mica surface and imaged at high resolution as described in Materials and Methods. Control DNA of 48% G·C is shown in Fig. 2 A. The average measured contour length, L0, was 2819 ± 53 nm (n = 13), yielding a rise per basepair of 0.35 ± 0.01 nm in agreement with a B-form structure. The same analysis on the high-G·C content DNA (Fig. 2 B) gave a mean contour length of 2016 ± 84 nm (n = 22) and a rise per basepair of 0.35 ± 0.02 nm, therefore a similar value to that obtained for pBACgus11 DNA. This result indicates that a high proportion of G·C in the DNA sequence does not affect the overall contour length. Moreover, this result shows that the A-type CD spectrum found for piJ702 does not correspond with an average rise per basepair of an A-form molecule. However, these measurements could not discard a change in rigidity of the polymer induced by sequence.
Figure 2.
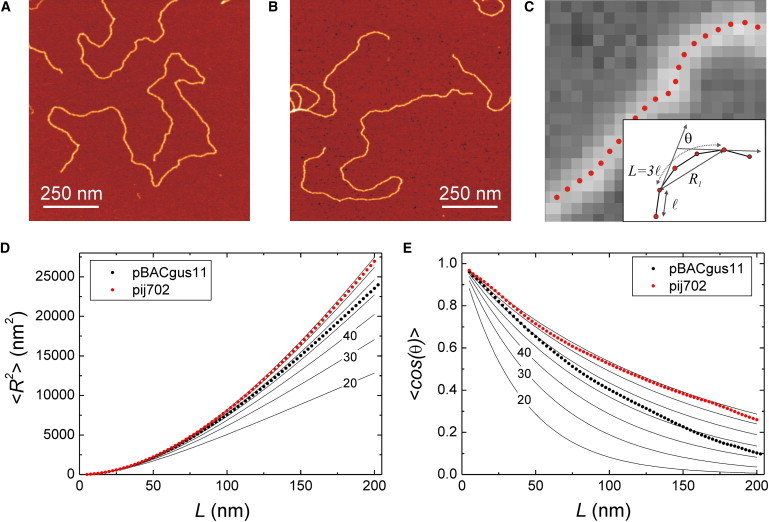
Atomic force microscopy analysis of mechanical properties of DNA. (A) Representative image of pBACgus11 substrate of 8041 bp. (B) Representative image of piJ702 substrate of 5724 bp. Both images are 1 μm × 1 μm and have 1.95 nm/pixel resolution. (C) Illustration of the data analysis and tracing of DNA molecules. A segmented line made of points separated by ℓ = 2.5 nm follows the contour of the molecule. The important parameters we employ are the contour length spacing L, the extension R, and the angle θ between two tangents separated by L. (C, inset) Parameters L, R, and θ are shown together with an example for L = 3 × ℓ = 7.5 nm. (D) Plots of 〈R2〉 versus contour length spacing L for pBACgus11 (black circles) and piJ702 (red circles). pBACgus11 data follows the prediction given by the WLC model (Eq. 1) with a persistence length of 54 nm. pij702 data gave a value for P of 74 nm. To guide the eye, predictions from WLC with different values for the persistence length are included (solid lines). The six curves shown are for P = 20, 30, 40, 50, 60, and 70 nm. The slope of the curves increases as P increases. (E) Plots of 〈cosθ〉 versus contour length spacing L for pBACgus11 (black circles) and piJ702 (red circles). pBACgus11 data are between curves of Eq. 2 for P = 50 nm and 60 nm in contrast with piJ702 data that are between curves of P = 70 nm and 80 nm. In total, 189 fragments of 325 nm were studied for pBACgus11 and 135 fragments for piJ702, giving >15,000 data points at contour lengths of 5 nm.
To find out how sequence affected the persistence length of the DNA samples used in this study we analyzed trajectories of equilibrated single DNA molecules following the methods described in Moreno-Herrero et al. (17) and Wiggins et al. (23). As reported by Rivetti et al. (19) DNA equilibrates on a mica surface when adsorption is promoted by divalent ions such as Mg2+. The behavior of DNA molecules under these conditions can be predicted by the WLC model (19), which describes a mean trajectory of the polymer on the mica with the equations
| (1) |
| (2) |
where P is the persistence length of the polymer, L is the contour length spacing, and 〈R2s,s+L〉 is the mean-squared separation of points along the chain as a function of their contour length separation L, or located at distances s and s+L. Similarly, 〈cos(θs,s+L)〉 is the mean angle between tangents at contour points located at distances s and s+L. The average is computed over s and over all observed contours (see Fig. 2 C and the Supporting Material). The fit of the pBACgus11 DNA data to Eq. 1 (Fig. 2 D, black circles) yielded a value for the persistence length of 54 nm, in agreement with published results with similar A·T/G·C composition (19,29). These data were consistent with the hypothesis that our sample preparation yields contours that reflect equilibrium two-dimensional chain conformations. We repeated the same type of analysis for pij702 DNA (Fig. 2 D, red circles) and the fit using Eq. 1 gave a value for P of 74 nm. As a crosscheck analysis we calculated the tangent-tangent correlation 〈cos(θs,s+L)〉 up to a contour length spacing of L = 200 nm (Fig. 2 E). Data were consistent with previous AFM results and confirmed a larger persistence length for the high-G·C content DNA. To guide the eye, we included plots of Eq. 2 using P = 20–80 nm (solid lines in Fig. 2, D and E).
AFM measurements with both plasmid DNAs were done at exactly the same ionic conditions, thus allowing a direct comparison of structural and mechanical properties. It is known that contour lengths, on the one hand, are not significantly affected by different ionic conditions (2) and our AFM measurements in the presence of Mg2+ confirm a similar average rise per basepair, typical of B-DNA, for both plasmids. However, this result contrasts with our previous CD structural data of high-G·C content DNA, which gave a signal similar to that of dsRNA (a prototype for A-form structure, and known to have a shorter rise per basepair).
The analysis of the persistence length, on the other hand, was performed on short patches of DNA, a length scale in which we have previously observed by CD that the high-G·C content DNA presents a different base-stacking arrangement. We find from this analysis that the A-type base-stacking arrangement of the high-G·C content molecule gives rise to a larger P than that of the 50%-G·C DNA with B-form. Common to AFM and CD techniques is the fact that they provide measurements in equilibrium conditions, i.e., at zero force. In the following sections, we ask how force can affect the apparent local A-form structure and elastic properties of high-G·C content DNA. We answer these questions by analyzing the force-extension curves of the two DNA substrates obtained with MT in the entropic force regime (0.01–4 pN) and OT in both entropic and intrinsic-elasticity force regimes (0.1–100 pN).
Single-molecule magnetic tweezers analysis at low force
We used MT to characterize the mechanical properties of both DNA substrates by measuring the extension of the polymer as a function of the applied stretching force (Fig. 3 A). We performed several controls to verify that the molecule tethered between the magnetic bead and the glass surface was indeed a single DNA molecule (see the Supporting Material). Briefly, while tracking the z position or extension we rotated the magnets for forces above 1 pN. We found that none of the tracked molecules could generate plectonemes, confirming that molecules were torsionally unconstrained.
Extensions were measured for several DNA beads as a function of the applied force in the range (0.01–4 pN). To preserve conditions of entropic regime of DNA, we decided to stay at the low force range and used small magnetic beads. Fig. 3, B and C, shows normalized force-extension curves for pBACgus11 and piJ702, respectively. WLC model was then fit to the force-extension data as previously described (29,30),
| (3) |
where kB is Boltzmann's constant and T is the temperature in Kelvin, P is the persistence length, L0 is the contour length, and the constants αi have values α2 = −0.5164228, α3 = −2.737418, α4 = 16.07497, α5 = −38.87607, α6 = 39.49944, and α7 = −14.17718 (30). Best fit of Eq. 3 to the data yielded a contour length L0 and persistence length P for each DNA molecule. Repeating this experiment for a number of beads containing pBACgus11 or piJ702 substrate resulted in a mean value of 〈L0〉 and 〈P〉. For pBACgus11 we measured 〈L0〉 = 2.8 ± 0.1 μm and 〈P〉 = 47 ± 3 nm (n = 14, errors are SD of the mean). For piJ702 we measured 〈L0〉 = 1.8 ± 0.1 μm and 〈P〉 = 48 ± 5 nm (n = 10). Interestingly, values for the persistence length for piJ702 measured in the presence of force by using MT are significantly lower than the values measured with AFM. Because the pBACgus11 DNA was 8022 bp in length, we deduce a mean rise per basepair of 0.35 ± 0.01 nm, which is in excellent agreement with the value calculated from AFM images. The same calculation for piJ702 (5682 bp) yielded a rise per basepair of 0.32 ± 0.02 nm, slightly below the value calculated using the AFM analysis. These values confer our sample molecules with a mechanical behavior which remarkably diverges from the expected behavior for an A-form DNA molecule. This is further shown in Fig. 3, B and C (red curve), where we have used Eq. 3 to plot the force-extension curves of hypothetical molecules with a rise per basepair of 0.256 nm and P = 63.8 nm, according to Abels et al. (13).
Deviations from the WLC model indicate interactions which are not considered in the entropic elasticity of the assumed rodlike DNA structure. In particular, intrastrand interactions, which are known to be stronger in the presence of G·C-rich DNA molecules (25), are not included in this model. Given that piJ702 has a higher G·C content, it is expected that the forces required to release polymer segments from these interactions in this DNA are larger than those for pBACgus11 and therefore, deviations from the WLC model for piJ702 should occur at higher forces than those for pBACgus11. In agreement with these ideas, deviations from the WLC model in our experiments became significant for piJ702 plasmid at forces of 0.1−2 pN whereas they were significant for pBACgus11 plasmid at lower forces, namely, between 0.01 and 0.03 pN (see arrows in Fig. 3).
The fact that MT experiments measure a very similar value for P for both DNAs indicates that both DNAs adopt a similar base-stacking under low forces. In other words, our data suggest that the local A-form structure of the high-G·C DNA is distorted in the presence of force and behaves as B-form DNA. In fact, the analysis of the contour lengths reveals a similar average rise per basepair for both DNAs and is typical of B-DNA. In the next section, we extend this analysis to high forces by using OT.
Single-molecule optical tweezers analysis at high force
To investigate the effect that a high-G·C content has on the mechanical properties of DNA at high forces (0.1–100 pN), we used the OT technique. Fig. 4 A shows a single-molecule experiment in which a dsDNA fiber is stretched between two beads, one optically trapped and the other held by suction on a micropipette, as described in Materials and Methods. Normalized force-extension curves (stretch-relax cycles) for pBACgus11 (48% G·C) and piJ702 (70% G·C) are plotted in Fig. 4, B and C. As expected due to the different number of hydrogen bonds involved in G·C and A·T basepairs, hysteresis is smaller for piJ702 than for control plasmid pBACgus11, thus indicating that the rate of strand annealing is faster for the former (the stretch-release cycle is almost reversible at the used loading rate).
Note that the melting hysteresis in our experiments is caused by fraying from nicks. In addition, the overstretching transition for this DNA occurs within a narrower force range, thus demonstrating that the cooperativity of this transition increases with the density of G·C content. For instance, the slope of the overstretching plateau of the pBACgus11 molecule (Fig. 4 B) is 9.88 pN/nm and it is 4.77 pN/nm for the piJ702 molecule (Fig. 4 C). Although unzipping forces for G·C-rich regions are higher than those for A·T-rich regions (31), overstretching forces for pBACgus11 and piJ702 were similar: 65.4 ± 0.2 pN and 63.8 ± 0.1 pN, respectively (n > 30, errors are SE of the mean). This result is in agreement with that of Clausen-Schaumann et al. (32), who found that poly(dG-dC) and λ DNA (∼50% G·C) overstretch at the same force.
To adjust the entropic elasticity regime of force-extension curves measured with OT, we used a purely entropic or inextensible WLC model (33):
| (4) |
We have used this expression to fit the force-extension curves in the range 1–10 pN. Two examples of these fits (expressed as F−1/2 versus z) are shown as blue lines in the insets of Fig. 4, B and C. Mean values obtained with this model are consistent with the values derived previously using MT: 〈L0〉 = 2.73 ± 0.01 μm and 〈P〉 = 47 ± 2 nm for pBACgus11, and 〈L0〉 = 1.95 ± 0.01 μm and 〈P〉 = 48 ± 2 nm for piJ702 (n ≥ 11, errors are SE of the mean).
The elastic stretch modulus of DNA has been proved to be dependent on base composition (34,35). Therefore, to examine any difference between the flexibility of the G·C-rich DNA and balanced A·T/G·C DNA, we have extended the fit of the force-extension curves to the intrinsic elasticity region. To describe this force regime, we used a variation of the WLC model which takes into account that the DNA molecule can be stretched beyond its contour length. The extensible WLC model in the so-called strong-stretching limit incorporates an elastic stretch modulus, S, as (36):
| (5) |
We used this expression to fit force-extension curves in the range 1–40 pN. Two examples of these fits are shown as red lines in Fig. 4, B and C. Best fit of Eq. 5 to the data yielded a contour length L0, a persistence length P, and a stretch modulus S for each DNA molecule. For pBACgus11 we measured 〈L0〉 = 2.70 ± 0.01 μm, 〈P〉 = 50 ± 2 nm, and 〈S〉 = 1114 ± 61 pN. For piJ702 we measured 〈L0〉 = 1.93 ± 0.01 μm, 〈P〉 = 49 ± 3 nm, and 〈S〉 = 1325 ± 93 pN (n ≥ 11, errors are SE of the mean).
We observed that mean values of L0 and P derived from these fittings are very similar to the values measured with MT data, thus confirming that the presence of force distorts the local base-stacking arrangement of the high-G·C content DNA and renders typical B-DNA properties. Moreover, the overstretching plateau for piJ702 and pBACgus11 accurately complies with a length of 0.7 × L0, which is an empiric rule that has been observed in all natural DNA molecules to date (2,12). Interestingly, the extensible WLC approximation for piJ702 yielded a stretch modulus, S, considerably above the value of control pBACgus11. This can be directly noticed by comparing the slope of the intrinsic elasticity region of the force-extension curve in Fig. 4, B and C.
Discussion
Table 1 reviews the values of 〈L0〉, 〈P〉, and 〈S〉 which have been presented above and which, as explained, have been calculated from different fits of experimental data measured with AFM, MT, and OT. Contour-length measurements scaled to the number of basepairs in all techniques clearly showed that both DNA substrates have a characteristic B-form rise per basepair of ∼3.4 Å. This important result indicates that overall contour length in DNA is not affected by the base-stacking arrangement, here induced by G·C content. There are several examples showing that sequence affects mechanical properties of DNA (32,34,35), and it was also proposed that base-stacking is one of the factors that determine the sequence-dependent conformational heterogeneity of DNA (37).
Table 1.
Contour length, persistence length and elastic modulus of a 48% G·C and a 70% G·C DNAs measured with different single-molecule techniques
| pBACgus11 (48% G·C, ∼8.0 kbp) |
piJ702 (70% G·C, ∼5.7 kbp) |
|||||
|---|---|---|---|---|---|---|
| L0 (μm) | P (nm) | S (pN) | L0 (μm) | P (nm) | S (pN) | |
| B-form∗ | 2.71 | — | — | 1.92 | — | — |
| A-form∗ | 2.05 | — | — | 1.45 | — | — |
| AFM | 2.82 ± 0.05 | 54.5 ± 0.5 | — | 2.02 ± 0.08 | 74.5 ± 0.5 | — |
| MT | 2.8 ± 0.1 | 47 ± 3 | — | 1.8 ± 0.1 | 48 ± 5 | — |
| OT inext. | 2.73 ± 0.01 | 47 ± 2 | — | 1.95 ± 0.01 | 48 ± 2 | — |
| OT ext. | 2.70 ± 0.01 | 50 ± 2 | 1114 ± 61 | 1.93 ± 0.01 | 49 ± 3 | 1325 ± 93 |
L0, contour length; P, persistence length; S, stretch modulus. Inext, inextensible; ext, extensible.
The canonical B- and A-form values for L0 were computed from the number of basepairs in the DNA tether, assuming 0.338 nm/bp for B-form and 0.256 nm/bp for A-form (1).
However, how local distortions of the canonical B-form of DNA affect the overall structure of long sequences of DNA is not well known. Here we studied a high-G·C content DNA with a CD spectrum similar to dsRNA, therefore showing an A-form base-stacking. Previous studies also measured analogous A-form spectroscopic signal on poly(dG)·poly(dC) in aqueous solution (7). Importantly, we found by using a single-molecule approach that the A-form CD spectrum of piJ702 does not imply a contour length different than that of B-DNA. An example of a combination of A-type base stacking with B-type sugar puckering has been found in the d(C4G4) octamer (38).
The persistence length, in contrast, was affected by the different base-stacking arrangement in experiments in the absence of tension. DNA sequence has been shown to contribute not only to the three-dimensional structure but also to the mechanical properties of the polymer. For instance, long patches of A·T dinucleotides exhibit an intrinsic long-scale bending that turns into a low persistence length (17). Using AFM, we measured a larger persistence length for high-G·C content DNA than for the control 50%-G·C pBACgus11 plasmid. Our measurements are in agreement with previous data that found that poly(dG)·poly(dC) behaves as a stiff polymer (39). However, we should keep in mind that AFM measured the mechanical properties of short patches of DNA (325 nm) at zero force. In fact, measurements under tension with MT and OT in different force regimes did not observe significant differences in P between piJ702 and pBACgus11 substrates (see Table 1), thus indicating that the local distortion from B-form produced by sequence in the high-G·C DNA is compromised under stress.
Interestingly, the high content of G·C in the piJ702 plasmid has its footprint in the large stretch modulus measured with OT at high forces and in the lower hysteresis between stretch and release paths. The former result indicates that high-G·C DNA is harder to stretch than balanced A·T/G·C DNA (see Table 1) and the latter indicates that high-G·C DNA requires a higher energy to melt for a given loading rate than balanced A·T/G·C DNA. Both the stretch modulus and the melting behavior are associated with the magnitude of base-stacking and basepairing interactions (1,40–42).
Our measurements have provided basepair-ensemble averaged properties over single molecules. They reveal that mechanical properties of A-DNA are not significantly different from those of B-form under tension. The structure of individual basepairs steps according to their base-stacking configuration may switch between A and B modes, as shown by circular dichroism. However, changes in molecular length do not happen at the single-molecule level, because the stability of A-type base-stacking is compromised in the presence of force. The appearance of a contour-length shortening in the B-A transition is expected to be a cooperative effect which ultimately enhances the stabilization of the A-type base-stacking. This effect is proposed to happen through intra- and interstrand association of double-helical chain domains, consistent with the results from Hillen and Wells (27).
In this regard, we propose condensation/aggregation as the mechanism by which B-A structural changes in the base-stacking configuration lead to molecular shortenings. However, this mechanism needs additional favorable conditions to take place in the form of low humidity conditions and/or the presence of multivalent cations. We address, in the accompanying article, (43) a single-molecule study of the B-A transition under these conditions which provides additional support to the aforementioned mechanism by which B-A transition in DNA leads to a molecular length change.
Conclusions
We have studied how DNA local structure induced by sequence propagates to the global molecular length and mechanical properties by using a combination of bulk and single-molecule techniques. We have used a high-G·C content DNA with A-type base-stacking conformation in aqueous buffer and a DNA with balanced nucleotide composition and B-type local configuration. AFM measurements of both DNAs (zero force) have led to typical values of the contour-length, thus showing that the local conformation does not influence the global double-helix length. The persistence length, in contrast, was affected by the different base-stacking arrangement. AFM measurements showed a larger persistence length for the DNA substrate with high-G·C content than for the control DNA with balanced A·T/G·C composition.
Experiments under tension with OT and MT, however, rendered typical values of the persistence length in both DNAs, thus indicating that the local A-basepair arrangement induced by sequence in the high-G·C content DNA rearranges into that of the B-form in the presence of stress. The analysis of the contour length with these techniques provided typical B-form rise per basepair, as in measurements with AFM, thus confirming that a local A-type base-stacking in DNA does not lead to a shorter molecule and suggesting that additional conditions which favor the association of double-helical domains are required to produce a cooperative molecular length change. The overstretching transition also complied with a plateau length of 0.7 × [B-DNA contour length], as has been observed in all natural DNA molecules to date (2,12). Sequence, however, does affect the stretch modulus and melting behavior at high forces as high-G·C content molecules were significantly harder to extend and exhibited higher hysteresis area between the stretch-relax paths than control 50%-G·C molecules.
These results represent a necessary description to understand both the local and long-range mechanical action of DNA-binding proteins and DNA enzymatic processing, as generated by the different nucleotide base composition of the DNA.
Acknowledgments
C. Bustamante and S. B. Smith are acknowledged for help in setting up the optical tweezers laboratory. G. Montoya is acknowledged for help with CD experiments. F. Malpartida and T. Cuesta are acknowledged for piJ702 plasmid DNA purification.
This work was supported by grants from the Spanish Ministry of Science and Innovation (No. BFU2010-15703/BMC, No. BFU2008-02328/BMC, and Consolider No. CSD2007-00010) and the Comunidad de Madrid (No. S2009/MAT/1507). S.H. acknowledges a scholarship from Consejería de Educación de la Comunidad de Madrid and the European Social Fund. J.R.A.-G. acknowledges a former individual fellowship from the International Human Frontier Science Program Organization and a Ramón y Cajal contract from the Spanish Ministry of Science and Innovation. Work in F.M.-H. Laboratory is supported by the European Research Council (starting grant No. 206117) and the Spanish Ministry of Science and Innovation (grant No. FIS2008-0025).
Contributor Information
Fernando Moreno-Herrero, Email: fernando.moreno@cnb.csic.es.
J. Ricardo Arias-Gonzalez, Email: ricardo.arias@imdea.org.
Supporting Material
References
- 1.Saenger W. Springer-Verlag; New York: 1984. Principles of Nucleic Acid Structure. [Google Scholar]
- 2.Baumann C.G., Smith S.B., Bustamante C. Ionic effects on the elasticity of single DNA molecules. Proc. Natl. Acad. Sci. USA. 1997;94:6185–6190. doi: 10.1073/pnas.94.12.6185. [DOI] [PMC free article] [PubMed] [Google Scholar]
- 3.Mao H.B., Arias-Gonzalez J.R., Bustamante C. Temperature control methods in a laser tweezers system. Biophys. J. 2005;89:1308–1316. doi: 10.1529/biophysj.104.054536. [DOI] [PMC free article] [PubMed] [Google Scholar]
- 4.Leslie A.G., Arnott S., Ratliff R.L. Polymorphism of DNA double helices. J. Mol. Biol. 1980;143:49–72. doi: 10.1016/0022-2836(80)90124-2. [DOI] [PubMed] [Google Scholar]
- 5.Ivanov V.I., Krylov, D. Y A-DNA in solution as studied by diverse approaches. Methods Enzymol. 1992;211:111–127. doi: 10.1016/0076-6879(92)11008-7. [DOI] [PubMed] [Google Scholar]
- 6.Gray D.M., Ratliff R.L., Vaughan M.R. Circular dichroism spectroscopy of DNA. Methods Enzymol. 1992;211:389–406. doi: 10.1016/0076-6879(92)11021-a. [DOI] [PubMed] [Google Scholar]
- 7.Nishimura Y., Torigoe C., Tsuboi M. An A-form poly(dG).poly(dC) in H2O solution. Biopolymers. 1985;24:1841–1844. doi: 10.1002/bip.360240913. [DOI] [PubMed] [Google Scholar]
- 8.Calladine C.R., Drew H.R., Travers A.A. Elsevier/Academic Press; New York: 2004. Understanding DNA. The Molecule and How it Works. [Google Scholar]
- 9.Rief M., Clausen-Schaumann H., Gaub H.E. Sequence-dependent mechanics of single DNA molecules. Nat. Struct. Biol. 1999;6:346–349. doi: 10.1038/7582. [DOI] [PubMed] [Google Scholar]
- 10.Nara-Inui H., Akutsu H., Kyogoku Y. Alcohol induced B-A transition of DNAs with different base compositions studied by circular dichroism. J. Biochem. 1985;98:629–636. doi: 10.1093/oxfordjournals.jbchem.a135319. [DOI] [PubMed] [Google Scholar]
- 11.Usatyi A.F., Shlyakhtenko L.S. Melting of DNA in ethanol-water solutions. Biopolymers. 1974;13:2435–2446. doi: 10.1002/bip.1974.360131204. [DOI] [PubMed] [Google Scholar]
- 12.Bustamante C., Bryant Z., Smith S.B. Ten years of tension: single-molecule DNA mechanics. Nature. 2003;421:423–427. doi: 10.1038/nature01405. [DOI] [PubMed] [Google Scholar]
- 13.Abels J.A., Moreno-Herrero F., Dekker N.H. Single-molecule measurements of the persistence length of double-stranded RNA. Biophys. J. 2005;88:2737–2744. doi: 10.1529/biophysj.104.052811. [DOI] [PMC free article] [PubMed] [Google Scholar]
- 14.Fang Y., Spisz T.S., Hoh J.H. Ethanol-induced structural transitions of DNA on mica. Nucleic Acids Res. 1999;27:1943–1949. doi: 10.1093/nar/27.8.1943. [DOI] [PMC free article] [PubMed] [Google Scholar]
- 15.Hormeño S., Arias-Gonzalez J.R. Exploring mechanochemical processes in the cell with optical tweezers. Biol. Cell. 2006;98:679–695. doi: 10.1042/BC20060036. [DOI] [PubMed] [Google Scholar]
- 16.Moukhtar J., Faivre-Moskalenko C., Arneodo A. Effect of genomic long-range correlations on DNA persistence length: from theory to single molecule experiments. J. Phys. Chem. B. 2010;114:5125–5143. doi: 10.1021/jp911031y. [DOI] [PubMed] [Google Scholar]
- 17.Moreno-Herrero F., Seidel R., Dekker N.H. Structural analysis of hyperperiodic DNA from Caenorhabditis elegans. Nucleic Acids Res. 2006;34:3057–3066. doi: 10.1093/nar/gkl397. [DOI] [PMC free article] [PubMed] [Google Scholar]
- 18.Ibarra B., Chemla Y.R., Bustamante C. Proofreading dynamics of a processive DNA polymerase. EMBO J. 2009;28:2794–2802. doi: 10.1038/emboj.2009.219. [DOI] [PMC free article] [PubMed] [Google Scholar]
- 19.Rivetti C., Guthold M., Bustamante C. Scanning force microscopy of DNA deposited onto mica: equilibration versus kinetic trapping studied by statistical polymer chain analysis. J. Mol. Biol. 1996;264:919–932. doi: 10.1006/jmbi.1996.0687. [DOI] [PubMed] [Google Scholar]
- 20.Katz E., Thompson C.J., Hopwood D.A. Cloning and expression of the tyrosinase gene from Streptomyces antibioticus in Streptomyces lividans. J. Gen. Microbiol. 1983;129:2703–2714. doi: 10.1099/00221287-129-9-2703. [DOI] [PubMed] [Google Scholar]
- 21.Chen C., Cohen J.S., Zadar A. Convenient continuous sonication method for the preparation of medium-sized polydeoxynucleotides. J. Biochem. Biophys. Methods. 1981;5:293–295. doi: 10.1016/0165-022x(81)90040-3. [DOI] [PubMed] [Google Scholar]
- 22.Horcas I., Fernández R., Baro A.M. WSXM: a software for scanning probe microscopy and a tool for nanotechnology. Rev. Sci. Instrum. 2007;78:013705. doi: 10.1063/1.2432410. [DOI] [PubMed] [Google Scholar]
- 23.Wiggins P.A., van der Heijden T., Nelson P.C. High flexibility of DNA on short length scales probed by atomic force microscopy. Nat. Nanotechnol. 2006;1:137–141. doi: 10.1038/nnano.2006.63. [DOI] [PubMed] [Google Scholar]
- 24.Smith S.B., Cui Y., Bustamante C. Optical-trap force transducer that operates by direct measurement of light momentum. Methods Enzymol. 2003;361:134–162. doi: 10.1016/s0076-6879(03)61009-8. [DOI] [PubMed] [Google Scholar]
- 25.Kypr J., Kejnovská I., Vorlícková M. Circular dichroism and conformational polymorphism of DNA. Nucleic Acids Res. 2009;37:1713–1725. doi: 10.1093/nar/gkp026. [DOI] [PMC free article] [PubMed] [Google Scholar]
- 26.Brahms J., Mommaerts W.F. A study of conformation of nucleic acids in solution by means of circular dichroism. J. Mol. Biol. 1964;10:73–88. doi: 10.1016/s0022-2836(64)80029-2. [DOI] [PubMed] [Google Scholar]
- 27.Hillen W., Wells R.D. Circular dichroism studies of the B goes to A conformational transition in seven small DNA restriction fragments containing the Escherichia coli lactose control region. Nucleic Acids Res. 1980;8:5427–5444. doi: 10.1093/nar/8.22.5427. [DOI] [PMC free article] [PubMed] [Google Scholar]
- 28.Hagerman P.J. Flexibility of RNA. Annu. Rev. Biophys. Biomol. Struct. 1997;26:139–156. doi: 10.1146/annurev.biophys.26.1.139. [DOI] [PubMed] [Google Scholar]
- 29.Bustamante C., Marko J.F., Smith S. Entropic elasticity of λ-phage DNA. Science. 1994;265:1599–1600. doi: 10.1126/science.8079175. [DOI] [PubMed] [Google Scholar]
- 30.Bouchiat C., Wang M.D., Croquette V. Estimating the persistence length of a worm-like chain molecule from force-extension measurements. Biophys. J. 1999;76:409–413. doi: 10.1016/s0006-3495(99)77207-3. [DOI] [PMC free article] [PubMed] [Google Scholar]
- 31.Essevaz-Roulet B., Bockelmann U., Heslot F. Mechanical separation of the complementary strands of DNA. Proc. Natl. Acad. Sci. USA. 1997;94:11935–11940. doi: 10.1073/pnas.94.22.11935. [DOI] [PMC free article] [PubMed] [Google Scholar]
- 32.Clausen-Schaumann H., Rief M., Gaub H.E. Mechanical stability of single DNA molecules. Biophys. J. 2000;78:1997–2007. doi: 10.1016/S0006-3495(00)76747-6. [DOI] [PMC free article] [PubMed] [Google Scholar]
- 33.Marko J.F., Siggia E.D. Stretching DNA. Macromolecules. 1995;28:8759–8770. [Google Scholar]
- 34.Hogan M., LeGrange J., Austin B. Dependence of DNA helix flexibility on base composition. Nature. 1983;304:752–754. doi: 10.1038/304752a0. [DOI] [PubMed] [Google Scholar]
- 35.Olson W.K., Swigon D., Coleman B.D. Implications of the dependence of the elastic properties of DNA on nucleotide sequence. Philos. Transact. A Math. Phys. Eng. Sci. 2004;362:1403–1422. doi: 10.1098/rsta.2004.1380. [DOI] [PubMed] [Google Scholar]
- 36.Odijk T. Stiff chains and filaments under tension. Macromolecules. 1995;28:7016–7018. [Google Scholar]
- 37.Hobza P., Sponer J. Structure, energetics, and dynamics of the nucleic acid base pairs: nonempirical ab initio calculations. Chem. Rev. 1999;99:3247–3276. doi: 10.1021/cr9800255. [DOI] [PubMed] [Google Scholar]
- 38.Trantírek L., Stefl R., Kypr J. An A-type double helix of DNA having B-type puckering of the deoxyribose rings. J. Mol. Biol. 2000;297:907–922. doi: 10.1006/jmbi.2000.3592. [DOI] [PubMed] [Google Scholar]
- 39.Hagerman P.J. Flexibility of DNA. Annu. Rev. Biophys. Biophys. Chem. 1988;17:265–286. doi: 10.1146/annurev.bb.17.060188.001405. [DOI] [PubMed] [Google Scholar]
- 40.Noy A., Golestanian R. The chirality of DNA: elasticity cross-terms at base-pair level including A-tracts and the influence of ionic strength. J. Phys. Chem. B. 2010;114:8022–8031. doi: 10.1021/jp104133j. [DOI] [PubMed] [Google Scholar]
- 41.Travers A.A. The structural basis of DNA flexibility. Philos. Transact. A Math. Phys. Eng. Sci. 2004;362:1423–1438. doi: 10.1098/rsta.2004.1390. [DOI] [PubMed] [Google Scholar]
- 42.SantaLucia J., Jr. A unified view of polymer, dumbbell, and oligonucleotide DNA nearest-neighbor thermodynamics. Proc. Natl. Acad. Sci. USA. 1998;95:1460–1465. doi: 10.1073/pnas.95.4.1460. [DOI] [PMC free article] [PubMed] [Google Scholar]
- 43.Hormeño S., Moreno-Herrero F., Arias-Gonzalez J.R. Condensation prevails over B-A transition in the structure of DNA at low humidity. Biophys. J. 2011;100:2006–2015. doi: 10.1016/j.bpj.2011.02.049. [DOI] [PMC free article] [PubMed] [Google Scholar]
Associated Data
This section collects any data citations, data availability statements, or supplementary materials included in this article.