

Abstract
The detection of defective mismatch repair (MMR), as assessed by the presence of tumor microsatellite instability (MSI) and/or loss of MMR protein expression by IHC, has been useful for risk assessment, prognosis, and prediction of treatment in patients with colorectal cancer. We analyzed tumors for the presence of defective MMR from 5927 Colorectal Cancer Family Registry patients recruited at six international consortium sites. We evaluated the appropriate percentage instability cutoff used to distinguish the three MSI phenotypes [ie, stable (MSS), low instability (MSI-L), and high instability (MSI-H)]; the sensitivity, specificity, and performance characteristics of individual markers; and the concordance between MSI and IHC phenotypes. Guided by the results of the IHC testing, our findings indicate that the distinction between an MSI-H phenotype from a low-instability or MSS phenotype can best be accomplished by using a cutoff of 30% or greater of the markers showing instability. The sensitivity and specificity of the mononucleotide markers were higher than those of the dinucleotide markers. Specifically, BAT26 and BAT25 had the highest sensitivity (94%) and specificity (98%), and the use of mononucleotide markers alone identified 97% of the MSI-H cases correctly. As expected, the presence of MSI-H correlated with an older age of diagnosis, the presence of tumor in the proximal colon, and female sex.
Based on the presence or absence of functional DNA mismatch repair (MMR), colorectal cancer (CRC) is generally divided into two broad categories.1,2 Tumors with defective MMR (dMMR) are characterized by the presence of a particular tumor phenotype, termed microsatellite instability (MSI), and by the absence of protein expression for any one of several genes involved in DNA MMR, including hMLH1, hMSH2, hMSH6, or hPMS2.3,4 MSI is recognized by the presence of insertion and deletion mutations in repetitive DNA sequences, called microsatellites, that consist of repeating mononucleotide, dinucleotide, or polynucleotide sequence loci. Tumors with dMMR have been identified in approximately 15% to 20% of sporadic CRCs and in CRCs of most patients with hereditary nonpolyposis colon cancer (HNPCC)/Lynch syndrome.5
In sporadic CRC, three distinct MSI phenotypes have been described: MSS (none of the examined loci demonstrate instability), MSI with low instability (MSI-L; from <30% to 40% of loci examined), and MSI with high instability (MSI-H; from 30% to 40% or greater of loci examined).6,7 Most sporadic cases with MSI-H (approximately 95%) are because of inactivation of hMLH1.8,9 Data suggest that the most common mechanism of MLH1 gene inactivation among unselected cases (approximately 90% of cases) is promoter hypermethylation and, less frequently, mutations in the gene itself.10–12 Of patients with the MSS/MSI-L phenotype, only a few demonstrate the loss or mutation of any of the MMR genes.
Germline mutations in these same MMR genes are responsible for HNPCC/Lynch syndrome, with hMLH1 and hMSH2 accounting for most cases (approximately 40% each) and hMSH6 and hPMS2 accounting for fewer cases (approximately 10% and 5%, respectively).13–15 Among all MSI colon cancer cases with loss of hMSH2 or hMSH6 detected in the tumor, the presence of a germline mutation appears to be the most common mechanism of gene inactivation. Thus, the molecular etiology of those tumors involving dMMR is heterogeneous, involving several different genes and numerous mechanisms of gene inactivation, including epigenetic, somatic, and germline alterations.
The MSI-H phenotype in patients with sporadic colon cancer is associated with distinct clinicopathological features, including proximal tumor site, high grade, early stage, and diploidy.16,17 The presence of the MSI-H tumor phenotype among these patients is gaining recognition as a prognostic marker2,18–21 and may also prove to be a predictive marker for response to 5 fluorouracil or irinotecan treatment.22 Several studies23–26 suggest that patients with tumors characterized by the presence of dMMR seem to show an improved overall survival and do not appear to benefit from 5 fluorouracil–based adjuvant chemotherapy. Among patients at risk of having an inherited form of colon cancer (eg, young age of onset and family history), tumor testing for the presence of dMMR has also been useful as a screening method for identifying MMR germline mutation carriers (ie, HNPCC/Lynch syndrome).
Overall, there are convincing data demonstrating biological and genetic differences between tumors with the MSI-H phenotype compared with those with the MSI-L/MSS phenotype.27–29 Although tumors with an MSI-L phenotype appear to behave in a similar fashion to MSS tumors, there remains controversy about whether there are true clinical and biological differences between these two tumor phenotypes.30–34
Since its description, testing tumors for the presence of dMMR has been an invaluable research tool. Given the importance of assessing tumors for the presence of dMMR, widespread clinical testing has also been implemented, with most clinical laboratories having the capacity to provide immunohistochemical (IHC) and MSI testing. For MSI testing, marker selection, marker performance, and percentage of markers showing instability in distinguishing MSS/MSI-L from MSI-H continue to be important issues to consider when determining the significance of the MSI test results.35,36
In the current study, we analyzed a set of tumor samples from the Colorectal Cancer Family Registry (Colon CFR) and evaluated the appropriate percentage instability cutoff in distinguishing the three MSI phenotypes (ie, MSS, MSI-L, and MSI-H), the performance characteristics of individual markers, and the sensitivity and specificity of the individual MSI markers in determining MMR protein deficiency. In addition, we looked at these same factors stratified by ascertainment method (population versus clinic based) to see if testing results were affected by sample ascertainment, given the likely different distribution of etiology between these two groups. To our knowledge, this study represents the largest reported collection of both population- and clinic-based cases used for this purpose.
Materials and Methods
Study Population
The Colon CFR has been described in detail elsewhere.37 Briefly, subjects were recruited between 1997 and 2007 by six Colon CFR centers: Cancer Care Ontario, Toronto, ON, Canada; University of Southern California Consortium, Los Angeles, CA; University of Melbourne, Australia; University of Hawaii, Honolulu, HI; Mayo Clinic, Rochester, MN; and Fred Hutchinson Cancer Research Center, Seattle, WA. Ascertainment of population-based cases was conducted at all centers; however, a variety of different sampling schemes was used based on age and/or family history. Thus, without using proband weighting, this group of cases is not intended to represent the frequency of various genotypes in an unselected population. Clinic-based cases were ascertained at three of the six centers [University of Melbourne, University of Southern California Consortium (through the Cleveland Clinic, Cleveland, OH), and Mayo Clinic]. Generally, these cases relate to clinical recognition of features suggesting increased possibility of genetic risk. Newcomb et al37 provide complete details of ascertainment. Epidemiological data, blood samples, tumor blocks, and pathological reports were collected on all subjects with CRC at each site using standardized core protocols. All participants gave informed consent for the study, which was approved by the Institutional Review Board at each Colon CFR site.
A total of 8167 subjects were available in the Colon CFR database. For this study, we used systematic exclusion criteria to narrow the list to a well-defined group of subjects. Those subjects with noncolorectal tumors and those with multiple tumors were excluded. In total, we included 5927 CRC subjects (International Classification of Diseases for Oncology, 3rd Edition (http://www.who.int/classifications/icd/adaptations/oncology/en): colon, codes 18.0 through 18.9; rectosigmoid junction, code 19.9; and rectum, code 20.9), of whom 4707 (79.4%) were population-based subjects and 1220 (20.6%) were clinic-based subjects.
MSI Status
MSI was performed using standard protocols.38 Paired normal and tumor DNA samples isolated from FFPE material were tested for MSI using a panel of 10 markers. These markers included four mononucleotide markers (ie, BAT25, BAT26, BAT34C4, and BAT40), five dinucleotide repeat markers (ACTC, D5S346, D10S197, D17S250, and D18S55), and one complex repeat marker (MYCL). The MSI test result at each locus was reported as follows: i) stable; ii) unstable; iii) equivocal; iv) stable, normal DNA not used in test; v) unstable, normal DNA not used in test; vi) equivocal, normal DNA not used in test; vii) quantity of DNA or tissue not sufficient; viii) not tested; and ix) no amplification. A minimum of four unequivocal results (MSI codes stable and unstable) were required to determine tumor MSI status.
Immunohistochemistry
IHC analysis of hMLH1, hMSH2, hMSH6, and hPMS2 expression was performed on FFPE samples, as previously described.38 IHC staining for all of the tumors was performed at three centers: Mayo Clinic, University of Queensland, and Cancer Care Ontario. The interpretation of IHC slides was performed by a pathologist without any knowledge of the corresponding tumor MSI status. The IHC result for each protein was reported as follows: i) negative, loss of expression; ii) positive, expression present; iii) positive, technically poor; iv) positive, technically equivocal; v) negative, technically poor; vi) negative, technically equivocal; vii) heterogeneous tumor; viii) reduced expression; ix) quantity of tissue not sufficient; x) not tested; and xi) technical failure. A total of 5296 subjects had IHC data available for analysis, 3964 of whom had staining for all four proteins (3346 population-based subjects and 618 clinic-based subjects). PMS2 immunostaining was not performed on 1332 tumors enrolled at the University of Southern California.
Statistical Analysis
The frequency distribution of cases was stratified by both percentage MSI and presence or absence of the expression of hMLH1, hMSH2, hMSH6, and hPMS2 proteins. The missing IHC data cases and those that had data available on fewer than four informative MSI markers were not included in further analyses. Associations between age groups (≤50 years versus 51 to 60 years, 61 to 70 years, and >70 years), sex (female versus male), and tumor site (distal versus proximal) variables and MSI were analyzed using Fisher's exact test. Contingency tables were used to assess the frequency of the variables by MSI phenotypes. Population- and clinic-based cases were also analyzed separately. All reported P values correspond to two-sided tests. Differences were considered statistically significant when P < 0.05. The sensitivity and specificity of each MSI marker in determining the MMR protein deficiency were calculated separately among population- and clinic-based groups and among all subjects. Sensitivity is defined as the proportion of tumors with instability in a specific MSI marker among the tumors with MMR protein deficiency. Specificity is defined as the proportion of tumors without instability in a specific marker among the tumors without MMR immunostaining loss. All analyses were conducted using JMP statistical software, version 7.0 (SAS Institute Inc., Cary, NC).
Results
Characteristics of the Study Subjects
A total of 5927 CRC cases, recruited at six Colon CFR sites, were included in this study. Table 1 describes the characteristics of the study population. The mean (range) age at diagnosis was 58 years (15 to 93 years). Of all patients, 36% were diagnosed when they were younger than 50 years and 13% were diagnosed when they were older than 70 years. Overall, 52% were male and 48% were female. For tumor site, tumors of the distal colon were more common (57%).
Table 1.
Characteristics of the Study Subjects
| Characteristics | Total sample (N = 5927) | Population-based sample (n = 4707) | Clinic-based sample (n = 1220) |
|---|---|---|---|
| Center | |||
| Cancer Care Ontario | 1127 (19) | 1126 (24) | 1 (<1) |
| USC | 635 (11) | 508 (11) | 127 (11) |
| University of Melbourne | 1187 (20) | 688 (15) | 499 (41) |
| University of Hawaii | 230 (4) | 230 (5) | 0 (0) |
| Mayo Clinic | 1416 (24) | 823 (17) | 593 (49) |
| FHCRC | 1332 (22) | 1332 (28) | 0 (0) |
| Age (years) | |||
| Range | 15–93 | 18–93 | 15–91 |
| Mean | 58 | 59 | 54 |
| ≤50 | 2146 (36) | 1476 (31) | 670 (55) |
| 51–60 | 1468 (25) | 1247 (26) | 221 (18) |
| 61–70 | 1544 (26) | 1362 (29) | 182 (15) |
| >70 | 757 (13) | 614 (13) | 143 (12) |
| Not designated | 12 (<1) | 8 (<1) | 4 (<1) |
| Sex | |||
| Male | 3097 (52) | 2456 (52) | 641 (53) |
| Female | 2830 (48) | 2251 (48) | 579 (47) |
| Tumor site | |||
| Proximal | 2297 (39) | 1791 (38) | 506 (41) |
| Distal | 3387 (57) | 2789 (59) | 598 (49) |
| Not designated | 243 (4) | 127 (3) | 116 (10) |
Data are given as number (percentage) of each group.
Colon CFR cases were recruited by two ascertainment methods: population based (79%) and clinic based (21%). Population-based cases (n = 4707) were enrolled at all six CFR sites. Clinic-based cases (n = 1220) were enrolled at only three CFR sites: University of Melbourne, University of Southern California Consortium (through the Cleveland Clinic), and Mayo Clinic. Because of systematic oversampling for specific characteristics, this cohort should not be interpreted as a true population-based sample of all CRCs.
Determination of Percentage Instability Cutoff for MSI Classification
All of the 5927 tumors were tested for MSI and the absence of protein expression by IHC. The MSI data were available for four or more markers for 4482 cases (3824 population-based cases and 658 clinic-based cases) (see Supplemental Tables S1–S3 at http://jmd.amjpathol.org). Approximately 13% (n = 441) of the 3346 population-based cases with available IHC data exhibited loss of protein expression: 9.8% MLH1/PMS2, 1.9% MSH2/MSH6, 1% MSH6 only, and <1% PMS2 only (see Supplemental Table S2 at http://jmd.amjpathol.org). A much higher prevalence of protein expression loss (36.6%, n = 226) was observed among the clinic-based cases: 19.1% MLH1/PMS2, 13.9% MSH2/MSH6, 1.1% MSH6 only, and <1% PMS2 only (see Supplemental Table S3 at http://jmd.amjpathol.org).
Overall, a microsatellite stable result was seen across all tested markers in 3117 cases (69.5%), with the remaining cases demonstrating instability in one or more of the markers (see Supplemental Table S1 at http://jmd.amjpathol.org). Among all 4482 cases, results demonstrated a distribution with the lowest point between 30% and 49% of the markers showing instability (approximately 0.8% of the cases at 30% to 39% and approximately 0.8% at 40% to 49%) (see Supplemental Table S1 at http://jmd.amjpathol.org). Overall, the plot of the frequency distribution of cases with and without loss of expression within MSI percentage ranges exhibited a bimodal distribution (Figure 1). At the 0% to 19% range, no cases showed loss of expression for any of the MMR proteins by IHC. A single case in each ascertainment group was detected at the 20% to 29% range: an MLH1/PMS2 loss case in the population-based group (see Supplemental Table S2 at http://jmd.amjpathol.org) and an MSH2/MSH6 loss case in the clinic-based group (see Supplemental Table S3 at http://jmd.amjpathol.org). The frequency of cases that showed loss of expression of any MMR protein by IHC increased with increasing proportion of unstable markers beyond the 30% to 39% category. Depending on the percentage instability cutoff used, 2 and 21 cases had discordant MSI/IHC results using an instability cutoff of 30% and 40% for MSI-H, respectively (see Supplemental Table S1 at http://jmd.amjpathol.org). Thus, using the MSI distribution, along with the IHC results as a guide, the most appropriate cutoff for distinguishing the MSI-H phenotypes appears to be approximately 30%. The subsequent analyses were based on this 30% cutoff.
Figure 1.
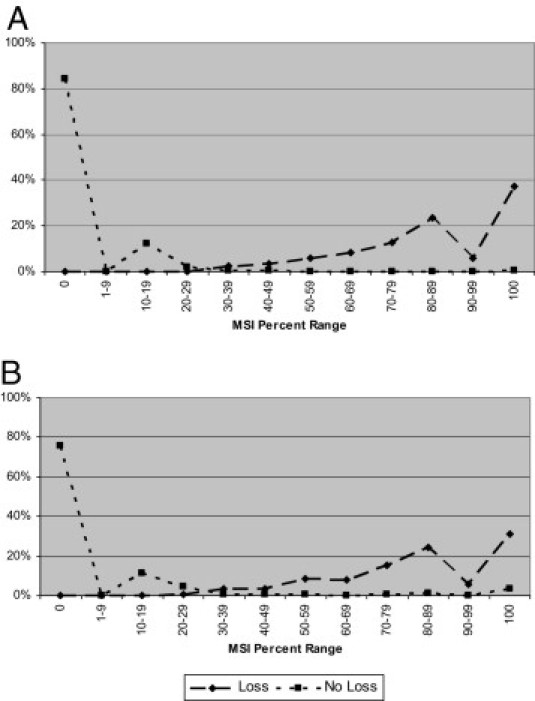
Distribution of cases with complete presence (no loss) or loss of expression in any of the four proteins (ie, MLH1, MSH2, MSH6, and/or PMS2) by IHC within percentage MSI phenotypes: population-based cases (n = 3824) (A) and clinic-based cases (n = 658) (B).
Evaluation of Individual MSI Marker Locus Instability Based on IHC Status
Further evaluation of the correlation between MSI at individual marker loci and IHC status was assessed by comparing the frequency of instability for each MSI marker among cases, with the loss of expression for any of the four proteins. Only cases with unequivocal loss of expression results were included in this analysis (categories 1 and 2 in the Materials and Methods section). The remaining categories were grouped under “equivocal” IHC data. The percentage of cases demonstrating instability for each of the 10 MSI markers was calculated for those cases that had loss of protein expression (MLH1/PMS2, MSH2/MSH6, PMS2, or MSH6) (Figure 2). The four mononucleotide markers (ie, BAT25, BAT26, BAT34C4, and BAT40) consistently demonstrated a higher frequency of MSI for each of the four IHC groups. Most of the mononucleotide markers showed at least 80% instability in all four groups of MMR loss, with the exception of BAT26 and BAT34C4 in the MSH6 loss group. The difference between the mononucleotide and the other dinucleotide markers was most significant within the MSH6-only loss group, in which these tumors demonstrated a much lower frequency of MSI (<40%) with the dinucleotide marker group. The frequency distribution of individual MSI marker instability with loss of MMR protein expression was similar among both population- and clinic-based cases. The cases with loss of PMS2 presented an overall high rate of instability for each of the markers, but there was significant variability for several of the dinucleotide markers between the ascertainment groups (see Supplemental Table S4 at http://jmd.amjpathol.org).
Figure 2.
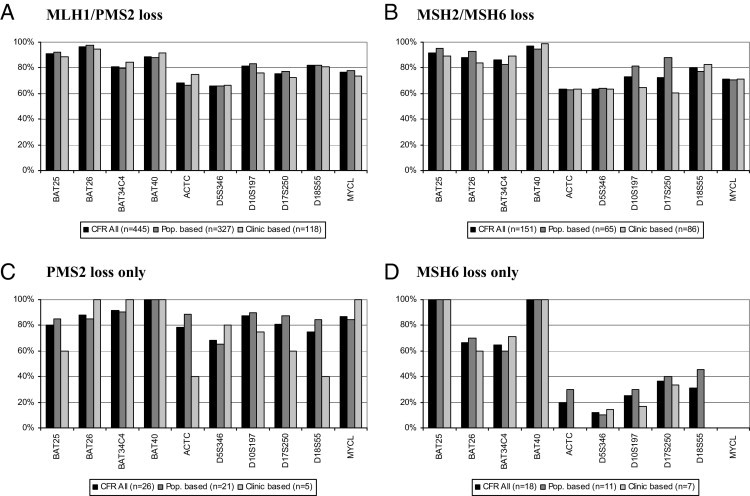
MSI marker panel percentage instability by IHC status among MLH1/PMS2 loss cases (A), MSH2/MSH6 loss cases (B), PMS2 loss-only cases (C), and MSH6 loss-only cases (D). Only cases with IHC codes zero and four are included in the analysis. MSI codes one, two, and six through nine are defined as interpretable. Percentage instability is calculated by dividing the number of unstable cases with the all-interpretable cases for each MSI marker. Loss of expression case counts in parentheses are total numbers and not specific to individual MSI marker interpretable data points. Pop. indicates population.
Evaluation of Sensitivity and Specificity of Individual MSI Markers
In an effort to determine the best markers with high specificity and sensitivity in identifying the MSI-L or MSI-H, two approaches were taken. First, individual marker percentage instability was calculated among cases that showed either 1% to 29% MSI-L (Figure 3A) or 30% or greater MSI-H overall instability (Figure 3B) to address the question of sensitivity and specificity of each marker for the MSI-L and MSI-H groups. Among MSI-L cases, most mononucleotide markers showed a low prevalence (from 1% to 2%) of instability, with the exception of BAT40 (9%). Among the other markers, the rates varied considerably, with MYCL showing the highest prevalence of instability (approximately 40%). The markers were much more uniform in the prevalence of instability among the MSI-H group. The mononucleotide markers were in the >80% range, whereas the dinucleotide markers showed more variability, ranging from 60% to 80% instability. No significant differences were observed between population- and clinic-based cases.
Figure 3.
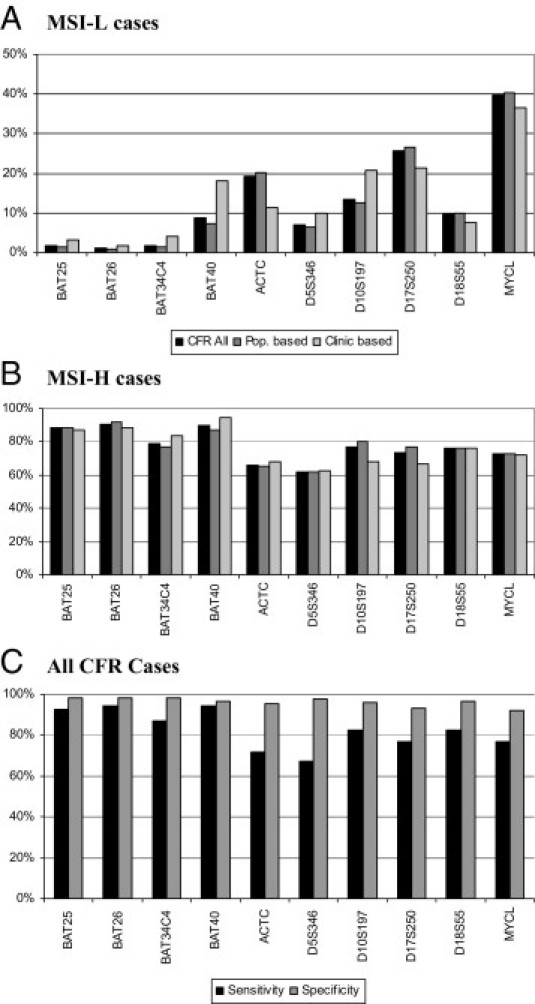
Individual marker percentage MSI: MSI-L cases (A) and MSI-H cases (B). The sensitivity and specificity of each marker in identifying MMR protein deficiency are also given. All CFR cases (C). Pop. indicates population.
Second, the sensitivity and specificity of each MSI marker were examined based on MMR immunostaining status (see Supplemental Figure S1 and Supplemental Tables S5–S7 at http://jmd.amjpathol.org). The specificity was high among all subjects, ranging from a low of 92% for MYCL to >97% for all four mononucleotide markers. However, the sensitivity was lower, ranging from 87% (BAT34C4) to 94% (BAT26 and BAT40) for mononucleotide markers and 67% (D5S346) to 83% (D10S197 and D18S55) for dinucleotide markers (Figure 3C).
Evaluation of Performance of Individual MSI Markers
To further evaluate the performance characteristics of each marker that defines the percentage instability cutoff for MSI classification, the frequency of various MSI outcomes (ie, stable, unstable, equivocal, and technical failure) was evaluated for the 4482 cases with available MSI data on four or more markers. Most marker calls with stable and unstable scoring were clearly identified. An equivocal MSI call was given to a case if the assay was not clearly interpretable because of technical problems or poor quality of the sample or if the normal DNA was not run in parallel. Figure 4A shows the distribution of equivocal calls for each of the 10 MSI markers: the frequency range was from 1% to 3.6%. The range varied much more (from 0.8% to 6.9%) when each of the three MSI groups (ie, MSS, MSI-L, and MSI-H) was evaluated separately. The equivocal call rate was higher for most markers in the MSI-H group. The frequency range of technically failed cases that were a result of no amplification was from 3.8% to 7.8% among all cases. Overall, no amplification calls were significantly more common in the MSI-H group and more prominent for the three dinucleotide markers (ie, ACTC, D10S197, and D17S250) and MYCL (Figure 4B).
Figure 4.
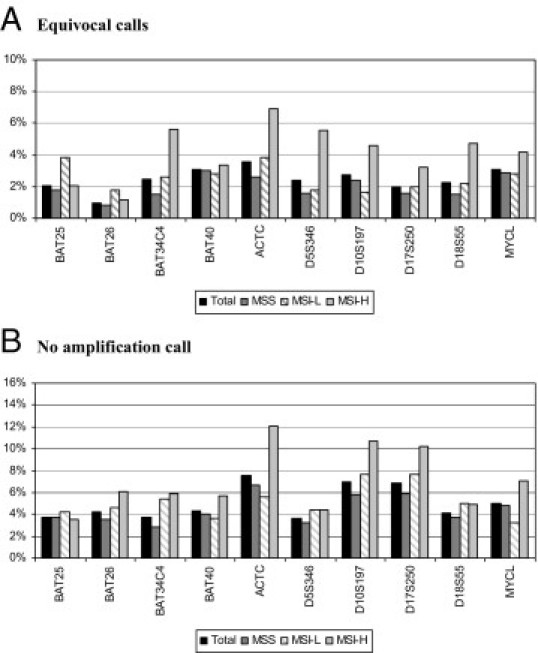
Distribution of equivocal (A) and no amplification (B) calls for each of the 10 markers among the 4482 cases with available data on a minimum four MSI markers. Among equivocal and no amplification calls, the frequencies are shown for each of the three MSI phenotypes (ie, MSS, MSI-L, and MSI-H) and the total.
Overall, the mononucleotide markers performed much better in identifying MSI and had much lower equivocal and failed calls. Specifically, marker BAT26 had the least equivocal calls, was among the lowest for failed calls, and had the highest sensitivity (94%) and specificity (98%) in identifying MMR protein deficiency. On the other hand, dinucleotide markers did not perform as well. MYCL was the least specific, and D5S346 was the least sensitive, marker among the 10-marker panel (see Supplemental Table S5 at http://jmd.amjpathol.org). The markers ACTC, D10S197, and D17S250 performed the worst in terms of high frequency of equivocal and technically failed cases.
Evaluation of MSI Groups with Mononucleotide Markers Only
Because the mononucleotide markers performed better in identifying MSI, they were used alone to determine their ability to distinguish the three MSI phenotypes. The phenotypes distinguished based on the 10-marker panel were compared with the phenotypes based on the four mononucleotide markers alone to determine the concordance (Table 2). Of the stable group (MSS), 100% were classified correctly with the mononucleotide markers (none of the four markers). The MSI-L group of tumors showed instability in one of the four mononucleotide markers for 10.7% and no instability (none of the four markers) for 89.3% of the cases. By using a cutoff of 50% unstable markers (two of the four markers), approximately 3% of the MSI-H cases would be misclassified by using a mononucleotide locus-only panel. Specifically, 9 (1.7%) of 530 showed instability in one of four markers and 6 (1.1%) of 530 did not have any marker instability (none of the four markers). The clinical features of these cases were randomly distributed for Colon CFR site, age, sex, and tumor site. Most had an unequivocal MSI result from a complete set of 10 markers. Five of the six cases with no instability (none of the four markers) and six of the nine cases with low instability (one of the four markers) showed no loss of protein expression (data not shown).
Table 2.
MSI Phenotypes Based on a Zero-, One-, Two-, Three-, or Four-Mononucleotide Marker Panel versus a 10-Marker Panel in Population- and Clinic-Based Cases
| MSI phenotypes | 10-Marker MSI panel |
|||
|---|---|---|---|---|
| MSS | MSI-L | MSI-H | Total | |
| CFR all | ||||
| 0 | 2239 (100.0) | 301 (89.3) | 6 (1.1) | 2546 |
| 1 | 0 (0) | 36 (10.7) | 9 (1.7) | 45 |
| 2 | 0 (0) | 0 (0) | 27 (5.1) | 27 |
| 3 | 0 (0) | 0 (0) | 84 (15.8) | 84 |
| 4 | 0 (0) | 0 (0) | 404 (76.2) | 404 |
| Total | 2239 (100.0) | 337 (100.0) | 530 (100.0) | 3106 |
| Population based | ||||
| 0 | 2005 (100.0) | 273 (90.7) | 5 (1.4) | 2283 |
| 1 | 0 (0) | 28 (9.3) | 6 (1.6) | 34 |
| 2 | 0 (0) | 0 (0) | 20 (5.4) | 20 |
| 3 | 0 (0) | 0 (0) | 54 (14.6) | 54 |
| 4 | 0 (0) | 0 (0) | 285 (77.0) | 285 |
| Total | 2005 (100.0) | 301 (100.0) | 370 (100.0) | 2676 |
| Clinic based | ||||
| 0 | 234 (100) | 28 (77.8) | 1 (0.6) | 263 |
| 1 | 0 (0) | 8 (22.2) | 3 (1.9) | 11 |
| 2 | 0 (0) | 0 (0) | 7 (4.4) | 7 |
| 3 | 0 (0) | 0 (0) | 30 (18.8) | 30 |
| 4 | 0 (0) | 0 (0) | 119 (74.4) | 119 |
| Total | 234 (100) | 36 (100.0) | 160 (100.0) | 430 |
Data are given as number (percentage) of each group unless otherwise indicated. MSI phenotypes were as follows: MSS, none of the examined loci demonstrate instability; MSI-L, MSI at <30% of loci examined; and MSI-H, MSI at ≥30% of loci examined.
The performance of the mononucleotide marker BAT26 was the most robust among the MSI panel. However, several studies have demonstrated a limitation of using this marker in patients with HNPCC/Lynch syndrome. A large germline deletion within the MSH2 gene has the potential to somatically delete the BAT26 MSI marker. Consequently, the tumor phenotype can be misclassified as MSS when using this marker alone. The frequency of BAT26 instability was investigated among MLH1 and MSH2 cases to assess the usefulness of this marker for the detection of MMR deficiency. Among all MSI-H cases tested in this study, loss of MLH1/PMS2 and loss of MSH2/MSH6 were observed in 444 (56.6%) and 150 (19.1%) of 784 tumors, respectively. The prevalence of BAT26 stability in the MLH1/PMS2 group was 2.7%, which is much lower than the 10% prevalence in the MSH2/MSH6 group (P = 0.0004), a difference that may be explained by the presence of possible deletions in MSH2 (Table 3).
Table 3.
BAT26 Stability Rates among MSI-H Cases with Loss of MLH1 and MSH2 Protein Expression
| Variable | MSI-H⁎ | BAT26† | P value‡ |
|---|---|---|---|
| MLH1−/PMS2− or ND | 444 (56.6) | 12 (2.7) | 0.0004 |
| MSH2−/MSH6− or ND | 150 (19.1) | 15 (10.0) |
−, loss of protein expression; ND, no data.
Data are given as MSI-H cases with loss of MLH1/PMS2 and MSH2/MSH6 protein expression and their percentage among all 784 CFR cases with available MSI and IHC data.
Data are given as BAT26 stable cases among MSI-H phenotypes with loss of MLH1/PMS2 and MSH2/MSH6 protein expression and their percentage in the corresponding MSI-H group.
By Fisher's exact test.
Evaluation of Tumor Characteristics Based on MSI Phenotypes
Tumor characteristics, including age at diagnosis, sex, and tumor site, were compared among the three MSI phenotypes. Table 4 shows the frequency of MSI phenotypes stratified by tumor characteristics among population- and clinic-based cases. Across all ages, the proportion of tumors among all cases that showed MSI-L was similar to cases with MSS, varying between 14% and 31%. However, a significant variation was observed in MSI-H versus MSS cases (P < 0.0001). Among clinic-based MSI-H cases, the variation in age distribution differed significantly (from 6% to 64%), with the highest proportion in the youngest age group (<50 years). Older age at diagnosis decreased the likelihood that a given tumor would be MSI-H in the clinic-based cases (P = 0.0002). In contrast, a younger age of diagnosis decreased the likelihood for MSI-H compared with MSS (P = 0.0003) in the population-based cases.
Table 4.
MSI Phenotypes by Age at Diagnosis, Sex, and Tumor Site
| Variables | Total | MSI phenotypes⁎ |
P values† |
|||
|---|---|---|---|---|---|---|
| MSS | MSI-L | MSI-H | MSS MSI-L | MSS MSI-H | ||
| Age at diagnosis (years) | ||||||
| CFR all | ||||||
| ≤50 | 1337 | 856 (28) | 142 (29) | 339 (39) | ||
| 51–60 | 1255 | 926 (30) | 153 (31) | 176 (20) | 1.00 | <0.0001 |
| 61–70 | 1291 | 930 (30) | 134 (27) | 227 (26) | 0.30 | <0.0001 |
| >70 | 598 | 405 (13) | 68 (14) | 125 (14) | 0.94 | 0.04 |
| Population based‡ | ||||||
| ≤50 | 970 | 701 (25) | 112 (26) | 157 (27) | ||
| 51–60 | 1129 | 866 (31) | 142 (33) | 121 (21) | 0.89 | 0.0003 |
| 61–70 | 1203 | 885 (31) | 122 (28) | 196 (34) | 0.32 | 0.95 |
| >70 | 522 | 359 (13) | 56 (13) | 107 (18) | 0.93 | 0.04 |
| Clinic based | ||||||
| ≤50 | 367 | 155 (51) | 30 (46) | 182 (64) | ||
| 51-60 | 126 | 60 (20) | 11 (17) | 55 (19) | 1.00 | 0.28 |
| 61-70 | 88 | 45 (15) | 12 (18) | 31 (11) | 0.43 | 0.04 |
| >70 | 76 | 46 (15) | 12 (18) | 18 (6) | 0.43 | 0.0002 |
| Sex | ||||||
| CFR all | ||||||
| Female | 2132 | 1428 (46) | 223 (45) | 481 (55) | ||
| Male | 2350 | 1689 (54) | 274 (55) | 387 (45) | 0.70 | <0.0001 |
| Population based‡ | ||||||
| Female | 1810 | 1279 (45) | 193 (45) | 338 (58) | ||
| Male | 2014 | 1532 (55) | 239 (55) | 243 (42) | 0.76 | <0.0001 |
| Clinic based | ||||||
| Female | 322 | 149 (49) | 30 (46) | 143 (50) | ||
| Male | 336 | 157 (51) | 35 (54) | 144 (50) | 0.79 | 0.81 |
| Tumor site | ||||||
| CFR all | ||||||
| Distal | 2551 | 2075 (69) | 284 (59) | 192 (23) | ||
| Proximal | 1779 | 951 (31) | 198 (41) | 630 (77) | <0.0001 | <0.0001 |
| Population based‡ | ||||||
| Distal | 2233 | 1872 (68) | 249 (59) | 112 (20) | ||
| Proximal | 1504 | 872 (32) | 173 (41) | 459 (80) | 0.0002 | <0.0001 |
| Clinic based | ||||||
| Distal | 318 | 203 (72) | 35 (58) | 80 (32) | ||
| Proximal | 275 | 79 (28) | 25 (42) | 171 (68) | 0.04 | <0.0001 |
Data are given as number (percentage) of each group.
By Fisher's exact test.
These cases were overselected for specific criteria at some enrollment sites; therefore, these numbers are not reflective of an unselected series of population-based cases. On average, this group has a lower proportion of families with Lynch syndrome than found in the clinic-based cases.
The proportion of MSI-L was relatively similar across sexes (P = 0.70); however, the proportion of MSI-H cases in population-based females was significantly higher (P < 0.0001) than among males. The MSI-H tumors accounted for significantly different proportions of CRCs across distal and proximal tumor sites (P < 0.0001). High proportions of distal tumors were observed among MSS cases, whereas proximal site tumors were much more common in cases that were MSI-H for both the population- and clinic-based cases.
Discussion
The goals of this study were to evaluate the appropriate percentage instability cutoff in distinguishing the MSI phenotypes (ie, MSS, MSI-L, and MSI-H); to evaluate the sensitivity, specificity, and performance characteristics of individual MSI markers in identifying tumors with dMMR; to assess the concordance between MSI and IHC phenotypes; and to compare the relative findings between CRCs ascertained in high-risk clinics versus the general population. Overall, these goals are directed at being able to correctly identify that particular subgroup of patients with CRC that has dMMR based on molecular classification.
Since the initial discovery of MSI,16,39–41 MSI-H tumors have been defined as having instability in 30% or more to 40% of the markers tested, whereas MSI-L tumors exhibit instability in less than 30% to 40% of the markers.6 Although the distinction between MSI-L and MSS tumors has been less of an issue, the question of what percentage of the markers needs to show instability to best distinguish MSI-H tumors from MSI-L tumors remains unanswered because of issues surrounding the effect of MSI panel selection and case ascertainment biases on test performance characteristics.
Previous studies8,42–45 have reported several different cutoffs for the classification of MSI-H, ranging between 30% and 50%. Based on results from the current study, most MSI tumors [793 (91%) of 868] demonstrated instability, with at least 50% or more of the markers tested. Only approximately 3.5% of the cases showed instability in the range of 40% to 49% and approximately 3% in the range of 30% to 39%, the two lowest points of overall MSI distribution. Based on the MSI results alone, the distribution of cases suggests a cutoff in the range of 30% to 50% for accurately identifying true MSI. However, the inclusion of IHC results for four of the MMR proteins adds additional information that can be used to establish an appropriate cutoff.45,46 With the use of this information, a cutoff of 30% or greater minimized the number of false-positive and false-negative results using the IHC results as the standard. With the use of this cutoff, there were only two MMR-deficient tumors classified as MSI-L compared with the 21 tumors at the 40% cutoff (see Supplemental Table S1 at http://jmd.amjpathol.org). Unfortunately, this analysis does not account for those cases potentially having dMMR, in which the protein showed normal expression by IHC but MSI was not available; this might have shifted the cut point in one direction or the other.45,47 Based on available data, we define MSI-H as tumors with 30% or greater of markers showing instability.
As expected, the cases identified by MSI and IHC were highly concordant when using the cutoff of 30% or greater, consistent with observations made by others.48,49 In the current series, two MSI-L cases (20% and 22% instability) presented with loss of MMR protein expression, one with MSH2/MSH6 loss and the other with MLH1/PMS loss. Given that discordances are still present, an absolute cutoff for MSI-H will not have 100% sensitivity and specificity for defining dMMR with the current marker panel. Another possible reason for discordances is an unusually low rate of instability because of technical problems, such as a low percentage tumor in the extracted DNA. Furthermore, there were a few cases (n = 84) that were MSI-H, but the IHC testing showed no loss of protein expression. Approximately 2.7% of the 3964 cases with available IHC data would have been missed had IHC alone been used for the assessment.
There has been much discussion on the common working reference panel of microsatellite markers that best recognize MSI phenotypes.6,47 Distinct performance characteristics for each of the markers used for MSI testing vary. The marker set used in this study included four of the five markers originally recommended for the Bethesda panel. The fifth marker, D2S123, was excluded in the current work because of its poor performance in the early phase of the CFR study. A total of 10 markers were tested on CFR cases in an effort to define the presence of MSI-L cases as well. Finally, four mononucleotide repeats were included to compare the performance characteristics with those of the dinucleotide markers in general. Based on the data presented, the mononucleotide markers outperformed the dinucleotide markers. The choice of mononucleotide markers to define the MSI phenotype has also been highlighted in the literature.47 In our findings, mononucleotide markers generally had a lower frequency of unequivocal results and technical failures and they demonstrated a higher sensitivity and specificity for the detection of the MSI-H group of tumors. The sensitivity and specificity of individual MSI mononucleotide markers were 92% and 98%, respectively; these markers performed better in predicting the IHC cases correctly, along with the MSI-H cases, as discussed in an earlier study.36 The sensitivity and specificity of the Bethesda panel (two mononucleotide and three dinucleotide markers)6 were 77% and 97%, respectively. In addition, there was a greater degree of variability with the dinucleotide markers, with MYCL being the least productive.
The mononucleotide marker BAT26 has been specific and sensitive in identifying MSI-H cases.8,45,50,51 Among all samples, 91% of the MSI-H cases demonstrated instability at this locus. With 94% sensitivity and 98% specificity for the identification of tumors with MMR deficiency, BAT26 is the best single marker to distinguish MSI-H. However, the use of this locus alone has limitations. Initially, Pastrello et al52 reported that 68% of the tumors from 10 HNPCC/Lynch families showed stability of BAT26, even though all developed unstable tumors. Their findings concluded that stability of BAT26 was because of the large intragenic MSH2 deletion in exon 5, causing complete absence of BAT26 sequences in the tumors. The association between BAT26 stability and MSH2 deletion was confirmed by Jaskowski et al.53 Our findings support these earlier studies showing that screening HNPCC/Lynch syndrome tumors with BAT26 has significant limitations. Therefore, running other or additional mononucleotide markers has been recommended to correctly detect such cases.7
The importance of MSI and IHC status of CRC tumors in correlation with age, sex, and site has been reported in several previous studies.8,16,27,34 Results presented in the current study are consistent with these other reports. MSI-H tumors were more frequent in older population-based cases and in younger clinic-based cases. Among all patients, MSI-H tumors were more likely to occur in the proximal colon in both the population- and clinic-based cases. Sex differences were more pronounced in population-based cases, in which MSI-H tumors were much more common in female than in male patients.
The heterogeneity of the population studied, the heterogeneity of mutations occurring in the MLH1 gene,54 the presence of large deletions in MSH2,52,53 and technical issues (eg, quality and quantity of the biospecimen and weak antibody staining)38 are important factors affecting the quality, sensitivity, and specificity of both MSI and IHC testing. MSI markers performed equally well in clinic- and population-based cases.
There are several strengths to this study that add significantly to what is already understood about MSI and MMR immunostaining analysis in patients with CRC. The Colon CFR is the world's largest CRC biospecimen collection with existing baseline testing for MSI and IHC. Both population- and clinic-based patient samples were tested with standardized protocols across CFR sites. The weaknesses of the study include case-only study design and missing information that led to exclusion of some valuable samples. Finally, the frequency of PMS2-only loss is likely to be underestimated because staining for this protein was not performed by one of the sites.
In summary, the present study reports overall performance of MSI markers in determining colon dMMR phenotype among both population- and clinic-based cases in the large Colon CFR registry. The current data provide strong evidence that a cutoff of 30% of the markers should be used to classify colon tumors as MSI-H. The sensitivity and specificity of the mononucleotide markers were higher than those of the dinucleotide markers, and mononucleotide markers alone identified 97% of the MSI-H cases correctly.
Footnotes
Supported by the National Cancer Institute, National Institutes of Health (RFA CA-95-011) and through cooperative agreements with members of the Colon Cancer Family Registry (CFR). Collaborating centers include the Australian Colorectal Cancer Family Registry (UO1 CA097735), the University of Southern California Familial Colorectal Neoplasia Collaborative Group (UO1 CA074799), the Mayo Clinic Cooperative Family Registry for Colon Cancer Studies (UO1 CA074800), the Ontario Registry for Studies of Familial Colorectal Cancer (UO1 CA074783), the Seattle Colorectal Cancer Family Registry (UO1 CA074794), the University of Hawaii Colorectal Cancer Family Registry (UO1 CA074806), and the University of California, Irvine, Informatics Center (UO1 CA078296).
The content of this manuscript does not necessarily reflect the views or policies of the National Cancer Institute or any of the collaborating centers in the CFRs nor does mention of trade names, commercial products, or organizations imply endorsement by the US government or the CFR.
Supplemental material for this article can be found at http://jmd.amjpathol.org or at doi: 10.1016/j.jmoldx.2010.12.004.
Supplemental data
Sensitivity and specificity of each MSI marker in identifying MMR protein deficiency. Sensitivity is the proportion of tumors with instability in a specific marker among the tumors with MMR protein deficiency. Specificity is the proportion of tumors without instability in a specific marker among the tumors without MMR protein deficiency.
References
- 1.Lengauer C., Kinzler K.W., Vogelstein B. Genetic instability in colorectal cancers. Nature. 1997;386:623–627. doi: 10.1038/386623a0. [DOI] [PubMed] [Google Scholar]
- 2.Popat S., Hubner R., Houlston R.S. Systematic review of microsatellite instability and colorectal cancer prognosis. J Clin Oncol. 2005;23:609–618. doi: 10.1200/JCO.2005.01.086. [DOI] [PubMed] [Google Scholar]
- 3.Peltomaki P. Deficient DNA mismatch repair: a common etiologic factor for colon cancer. Hum Mol Genet. 2001;10:735–740. doi: 10.1093/hmg/10.7.735. [DOI] [PubMed] [Google Scholar]
- 4.Bellizzi A.M., Frankel W.L. Colorectal cancer due to deficiency in DNA mismatch repair function: a review. Adv Anat Pathol. 2009;16:405–417. doi: 10.1097/PAP.0b013e3181bb6bdc. [DOI] [PubMed] [Google Scholar]
- 5.Marra G., Boland C.R. Hereditary nonpolyposis colorectal cancer: the syndrome, the genes, and historical perspectives. J Natl Cancer Inst. 1995;87:1114–1125. doi: 10.1093/jnci/87.15.1114. [DOI] [PubMed] [Google Scholar]
- 6.Boland C.R., Thibodeau S.N., Hamilton S.R., Sidransky D., Eshleman J.R., Burt R.W., Meltzer S.J., Rodriguez-Bigas M.A., Fodde R., Ranzani G.N., Srivastava S. A National Cancer Institute Workshop on Microsatellite Instability for cancer detection and familial predisposition: development of international criteria for the determination of microsatellite instability in colorectal cancer. Cancer Res. 1998;58:5248–5257. [PubMed] [Google Scholar]
- 7.Laghi L., Bianchi P., Malesci A. Differences and evolution of the methods for the assessment of microsatellite instability. Oncogene. 2008;27:6313–6321. doi: 10.1038/onc.2008.217. [DOI] [PubMed] [Google Scholar]
- 8.Thibodeau S.N., French A.J., Cunningham J.M., Tester D., Burgart L.J., Roche P.C., McDonnell S.K., Schaid D.J., Vockley C.W., Michels V.V., Farr G.H., Jr, O'Connell M.J. Microsatellite instability in colorectal cancer: different mutator phenotypes and the principal involvement of hMLH1. Cancer Res. 1998;58:1713–1718. [PubMed] [Google Scholar]
- 9.Cunningham J.M., Kim C.Y., Christensen E.R., Tester D.J., Parc Y., Burgart L.J., Halling K.C., McDonnell S.K., Schaid D.J., Walsh Vockley C., Kubly V., Nelson H., Michels V.V., Thibodeau S.N. The frequency of hereditary defective mismatch repair in a prospective series of unselected colorectal carcinomas. Am J Hum Genet. 2001;69:780–790. doi: 10.1086/323658. [DOI] [PMC free article] [PubMed] [Google Scholar]
- 10.Kane M.F., Loda M., Gaida G.M., Lipman J., Mishra R., Goldman H., Jessup J.M., Kolodner R. Methylation of the hMLH1 promoter correlates with lack of expression of hMLH1 in sporadic colon tumors and mismatch repair-defective human tumor cell lines. Cancer Res. 1997;57:808–811. [PubMed] [Google Scholar]
- 11.Cunningham J.M., Christensen E.R., Tester D.J., Kim C.Y., Roche P.C., Burgart L.J., Thibodeau S.N. Hypermethylation of the hMLH1 promoter in colon cancer with microsatellite instability. Cancer Res. 1998;58:3455–3460. [PubMed] [Google Scholar]
- 12.Poynter J.N., Siegmund K.D., Weisenberger D.J., Long T.I., Thibodeau S.N., Lindor N., Young J., Jenkins M.A., Hopper J.L., Baron J.A., Buchanan D., Casey G., Levine A.J., Le Marchand L., Gallinger S., Bapat B., Potter J.D., Newcomb P.A., Haile R.W., Laird P.W. Molecular characterization of MSI-H colorectal cancer by MLHI promoter methylation, immunohistochemistry, and mismatch repair germline mutation screening. Cancer Epidemiol Biomarkers Prev. 2008;17:3208–3215. doi: 10.1158/1055-9965.EPI-08-0512. [DOI] [PMC free article] [PubMed] [Google Scholar]
- 13.Aaltonen L.A., Peltomaki P. Genes involved in hereditary nonpolyposis colorectal carcinoma. Anticancer Res. 1994;14:1657–1660. [PubMed] [Google Scholar]
- 14.Peltomaki P.T. Genetic basis of hereditary nonpolyposis colorectal carcinoma (HNPCC) Ann Med. 1994;26:215–219. doi: 10.3109/07853899409147893. [DOI] [PubMed] [Google Scholar]
- 15.Lynch H.T., de la Chapelle A. Hereditary colorectal cancer. N Engl J Med. 2003;348:919–932. doi: 10.1056/NEJMra012242. [DOI] [PubMed] [Google Scholar]
- 16.Thibodeau S.N., Bren G., Schaid D. Microsatellite instability in cancer of the proximal colon. Science. 1993;260:816–819. doi: 10.1126/science.8484122. [DOI] [PubMed] [Google Scholar]
- 17.Sinicrope F.A., Rego R.L., Foster N., Sargent D.J., Windschitl H.E., Burgart L.J., Witzig T.E., Thibodeau S.N. Microsatellite instability accounts for tumor site-related differences in clinicopathologic variables and prognosis in human colon cancers. Am J Gastroenterol. 2006;101:2818–2825. doi: 10.1111/j.1572-0241.2006.00845.x. [DOI] [PubMed] [Google Scholar]
- 18.Wright C.M., Dent O.F., Barker M., Newland R.C., Chapuis P.H., Bokey E.L., Young J.P., Leggett B.A., Jass J.R., Macdonald G.A. Prognostic significance of extensive microsatellite instability in sporadic clinicopathological stage C colorectal cancer. Br J Surg. 2000;87:1197–1202. doi: 10.1046/j.1365-2168.2000.01508.x. [DOI] [PubMed] [Google Scholar]
- 19.Samowitz W.S., Curtin K., Ma K.N., Schaffer D., Coleman L.W., Leppert M., Slattery M.L. Microsatellite instability in sporadic colon cancer is associated with an improved prognosis at the population level. Cancer Epidemiol Biomarkers Prev. 2001;10:917–923. [PubMed] [Google Scholar]
- 20.Chang E.Y., Dorsey P.B., Johnson N., Lee R., Walts D., Johnson W., Anadiotis G., Kiser K., Frankhouse J. A prospective analysis of microsatellite instability as a molecular marker in colorectal cancer. Am J Surg. 2006;191:646–651. doi: 10.1016/j.amjsurg.2006.02.015. [DOI] [PubMed] [Google Scholar]
- 21.Jensen L.H., Lindebjerg J., Byriel L., Kolvraa S., Cruger D.G. Strategy in clinical practice for classification of unselected colorectal tumours based on mismatch repair deficiency. Colorectal Dis. 2008;10:490–497. doi: 10.1111/j.1463-1318.2007.01378.x. [DOI] [PubMed] [Google Scholar]
- 22.Vilar E., Gruber S.B. Microsatellite instability in colorectal cancer: the stable evidence. Nat Rev Clin Oncol. 2010;7:153–162. doi: 10.1038/nrclinonc.2009.237. [DOI] [PMC free article] [PubMed] [Google Scholar]
- 23.Carethers J.M., Chauhan D.P., Fink D., Nebel S., Bresalier R.S., Howell S.B., Boland C.R. Mismatch repair proficiency and in vitro response to 5-fluorouracil. Gastroenterology. 1999;117:123–131. doi: 10.1016/s0016-5085(99)70558-5. [DOI] [PMC free article] [PubMed] [Google Scholar]
- 24.Ribic C.M., Sargent D.J., Moore M.J., Thibodeau S.N., French A.J., Goldberg R.M., Hamilton S.R., Laurent-Puig P., Gryfe R., Shepherd L.E., Tu D., Redston M., Gallinger S. Tumor microsatellite-instability status as a predictor of benefit from fluorouracil-based adjuvant chemotherapy for colon cancer. N Engl J Med. 2003;349:247–257. doi: 10.1056/NEJMoa022289. [DOI] [PMC free article] [PubMed] [Google Scholar]
- 25.Carethers J.M., Smith E.J., Behling C.A., Nguyen L., Tajima A., Doctolero R.T., Cabrera B.L., Goel A., Arnold C.A., Miyai K., Boland C.R. Use of 5-fluorouracil and survival in patients with microsatellite-unstable colorectal cancer. Gastroenterology. 2004;126:394–401. doi: 10.1053/j.gastro.2003.12.023. [DOI] [PubMed] [Google Scholar]
- 26.Jover R., Zapater P., Castells A., Llor X., Andreu M., Cubiella J., Balaguer F., Sempere L., Xicola R.M., Bujanda L., Rene J.M., Clofent J., Bessa X., Morillas J.D., Nicolas-Perez D., Pons E., Paya A., Alenda C. The efficacy of adjuvant chemotherapy with 5-fluorouracil in colorectal cancer depends on the mismatch repair status. Eur J Cancer. 2009;45:365–373. doi: 10.1016/j.ejca.2008.07.016. [DOI] [PubMed] [Google Scholar]
- 27.Lothe R.A., Peltomäki P., Meling G.I., Aaltonen L.A., Nyström-Lahti M., Pylkkanen L., Heimdal K., Andersen T.I., Møller P., Rognum T.O. Genomic instability in colorectal cancer: relationship to clinicopathological variables and family history. Cancer Res. 1993;53:5849–5852. [PubMed] [Google Scholar]
- 28.Kim H., Jen J., Vogelstein B., Hamilton S.R. Clinical and pathological characteristics of sporadic colorectal carcinomas with DNA replication errors in microsatellite sequences. Am J Pathol. 1994;145:148–156. [PMC free article] [PubMed] [Google Scholar]
- 29.Ward R., Meagher A., Tomlinson I., O'Connor T., Norrie M., Wu R., Hawkins N. Microsatellite instability and the clinicopathological features of sporadic colorectal cancer. Gut. 2001;48:821–829. doi: 10.1136/gut.48.6.821. [DOI] [PMC free article] [PubMed] [Google Scholar]
- 30.Halford S., Sasieni P., Rowan A., Wasan H., Bodmer W., Talbot I., Hawkins N., Ward R., Tomlinson I. Low-level microsatellite instability occurs in most colorectal cancers and is a nonrandomly distributed quantitative trait. Cancer Res. 2002;62:53–57. [PubMed] [Google Scholar]
- 31.Laiho P., Launonen V., Lahermo P., Esteller M., Guo M., Herman J.G., Mecklin J.P., Jarvinen H., Sistonen P., Kim K.M., Shibata D., Houlston R.S., Aaltonen L.A. Low-level microsatellite instability in most colorectal carcinomas. Cancer Res. 2002;62:1166–1170. [PubMed] [Google Scholar]
- 32.Tomlinson I., Halford S., Aaltonen L., Hawkins N., Ward R. Does MSI-low exist? J Pathol. 2002;197:6–13. doi: 10.1002/path.1071. [DOI] [PubMed] [Google Scholar]
- 33.Graham T., Halford S., Page K., Tomlinson I. Most low-level microsatellite instability in colorectal cancers can be explained without an elevated slippage rate. J Pathol. 2008;215:204–210. doi: 10.1002/path.2351. [DOI] [PubMed] [Google Scholar]
- 34.Bapat B., Lindor N.M., Baron J., Siegmund K., Li L., Zheng Y., Haile R., Gallinger S., Jass J.R., Young J.P., Cotterchio M., Jenkins M., Grove J., Casey G., Thibodeau S.N., Bishop D.T., Hopper J.L., Ahnen D., Newcomb P.A., Le Marchand L., Potter J.D., Seminara D. The association of tumor microsatellite instability phenotype with family history of colorectal cancer. Cancer Epidemiol Biomarkers Prev. 2009;18:967–975. doi: 10.1158/1055-9965.EPI-08-0878. [DOI] [PMC free article] [PubMed] [Google Scholar]
- 35.Hatch S.B., Lightfoot H.M., Garwacki C.P., Moore D.T., Calvo B.F., Woosley J.T., Sciarrotta J., Funkhouser W.K., Farber R.A. Microsatellite instability testing in colorectal carcinoma: choice of markers affects sensitivity of detection of mismatch repair-deficient tumors. Clin Cancer Res. 2005;11:2180–2187. doi: 10.1158/1078-0432.CCR-04-0234. [DOI] [PubMed] [Google Scholar]
- 36.Xicola R.M., Llor X., Pons E., Castells A., Alenda C., Pinol V., Andreu M., Castellvi-Bel S., Paya A., Jover R., Bessa X., Giros A., Duque J.M., Nicolas-Perez D., Garcia A.M., Rigau J., Gassull M.A. Performance of different microsatellite marker panels for detection of mismatch repair-deficient colorectal tumors. J Natl Cancer Inst. 2007;99:244–252. doi: 10.1093/jnci/djk033. [DOI] [PubMed] [Google Scholar]
- 37.Newcomb P.A., Baron J., Cotterchio M., Gallinger S., Grove J., Haile R., Hall D., Hopper J.L., Jass J., Le Marchand L., Limburg P., Lindor N., Potter J.D., Templeton A.S., Thibodeau S., Seminara D. Colon Cancer Family Registry: an international resource for studies of the genetic epidemiology of colon cancer. Cancer Epidemiol Biomarkers Prev. 2007;16:2331–2343. doi: 10.1158/1055-9965.EPI-07-0648. [DOI] [PubMed] [Google Scholar]
- 38.Lindor N.M., Burgart L.J., Leontovich O., Goldberg R.M., Cunningham J.M., Sargent D.J., Walsh-Vockley C., Petersen G.M., Walsh M.D., Leggett B.A., Young J.P., Barker M.A., Jass J.R., Hopper J., Gallinger S., Bapat B., Redston M., Thibodeau S.N. Immunohistochemistry versus microsatellite instability testing in phenotyping colorectal tumors. J Clin Oncol. 2002;20:1043–1048. doi: 10.1200/JCO.2002.20.4.1043. [DOI] [PubMed] [Google Scholar]
- 39.Aaltonen L.A., Peltomaki P., Leach F.S., Sistonen P., Pylkkanen L., Mecklin J.P., Jarvinen H., Powell S.M., Jen J., Hamilton S.R., Petersen G.M., Kinzler K.W., Vogelstein B., De la Chapelle A. Clues to the pathogenesis of familial colorectal cancer. Science. 1993;260:812–816. doi: 10.1126/science.8484121. [DOI] [PubMed] [Google Scholar]
- 40.Ionov Y., Peinado M.A., Malkhosyan S., Shibata D., Perucho M. Ubiquitous somatic mutations in simple repeated sequences reveal a new mechanism for colonic carcinogenesis. Nature. 1993;363:558–561. doi: 10.1038/363558a0. [DOI] [PubMed] [Google Scholar]
- 41.Peltomaki P., Aaltonen L.A., Sistonen P., Pylkkanen L., Mecklin J.P., Jarvinen H., Green J.S., Jass J.R., Weber J.L., Leach F.S., Petersen G.M., Hamilton S.R., De la Chapelle A., Vogelstein B. Genetic mapping of a locus predisposing to human colorectal cancer. Science. 1993;260:810–812. doi: 10.1126/science.8484120. [DOI] [PubMed] [Google Scholar]
- 42.Cawkwell L., Li D., Lewis F.A., Martin I., Dixon M.F., Quirke P. Microsatellite instability in colorectal cancer: improved assessment using fluorescent polymerase chain reaction. Gastroenterology. 1995;109:465–471. doi: 10.1016/0016-5085(95)90334-8. [DOI] [PubMed] [Google Scholar]
- 43.Samowitz W.S., Slattery M.L., Kerber R.A. Microsatellite instability in human colonic cancer is not a useful clinical indicator of familial colorectal cancer. Gastroenterology. 1995;109:1765–1771. doi: 10.1016/0016-5085(95)90742-4. [DOI] [PubMed] [Google Scholar]
- 44.Bocker T., Diermann J., Friedl W., Gebert J., Holinski-Feder E., Karner-Hanusch J., von Knebel-Doeberitz M., Koelble K., Moeslein G., Schackert H.K., Wirtz H.C., Fishel R., Ruschoff J. Microsatellite instability analysis: a multicenter study for reliability and quality control. Cancer Res. 1997;57:4739–4743. [PubMed] [Google Scholar]
- 45.Dietmaier W., Wallinger S., Bocker T., Kullmann F., Fishel R., Ruschoff J. Diagnostic microsatellite instability: definition and correlation with mismatch repair protein expression. Cancer Res. 1997;57:4749–4756. [PubMed] [Google Scholar]
- 46.Thibodeau S.N., French A.J., Roche P.C., Cunningham J.M., Tester D.J., Lindor N.M., Moslein G., Baker S.M., Liskay R.M., Burgart L.J., Honchel R., Halling K.C. Altered expression of hMSH2 and hMLH1 in tumors with microsatellite instability and genetic alterations in mismatch repair genes. Cancer Res. 1996;56:4836–4840. [PubMed] [Google Scholar]
- 47.Umar A., Boland C.R., Terdiman J.P., Syngal S., De la Chapelle A., Rüschoff J., Fishel R., Lindor N.M., Burgart L.J., Hamelin R., Hamilton S.R., Hiatt R.A., Jass J., Lindblom A., Lynch H.T., Peltomaki P., Ramsey S.D., Rodriguez-Bigas M.A., Vasen H.F., Hawk E.T., Barrett J.C., Freedman A.N., Srivastava S. Revised Bethesda Guidelines for hereditary nonpolyposis colorectal cancer (Lynch syndrome) and microsatellite instability. J Natl Cancer Inst. 2004;96:261–268. doi: 10.1093/jnci/djh034. [DOI] [PMC free article] [PubMed] [Google Scholar]
- 48.Shia J. Immunohistochemistry versus microsatellite instability testing for screening colorectal cancer patients at risk for hereditary nonpolyposis colorectal cancer syndrome, part I: the utility of immunohistochemistry. J Mol Diagn. 2008;10:293–300. doi: 10.2353/jmoldx.2008.080031. [DOI] [PMC free article] [PubMed] [Google Scholar]
- 49.Zhang L. Immunohistochemistry versus microsatellite instability testing for screening colorectal cancer patients at risk for hereditary nonpolyposis colorectal cancer syndrome, part II: the utility of microsatellite instability testing. J Mol Diagn. 2008;10:301–307. doi: 10.2353/jmoldx.2008.080062. [DOI] [PMC free article] [PubMed] [Google Scholar]
- 50.Hoang J.M., Cottu P.H., Thuille B., Salmon R.J., Thomas G., Hamelin R. BAT-26, an indicator of the replication error phenotype in colorectal cancers and cell lines. Cancer Res. 1997;57:300–303. [PubMed] [Google Scholar]
- 51.Zhou X.P., Hoang J.M., Cottu P., Thomas G., Hamelin R. Allelic profiles of mononucleotide repeat microsatellites in control individuals and in colorectal tumors with and without replication errors. Oncogene. 1997;15:1713–1718. doi: 10.1038/sj.onc.1201337. [DOI] [PubMed] [Google Scholar]
- 52.Pastrello C., Baglioni S., Tibiletti M.G., Papi L., Fornasarig M., Morabito A., Agostini M., Genuardi M., Viel A. Stability of BAT26 in tumours of hereditary nonpolyposis colorectal cancer patients with MSH2 intragenic deletion. Eur J Hum Genet. 2006;14:63–68. doi: 10.1038/sj.ejhg.5201517. [DOI] [PubMed] [Google Scholar]
- 53.Jaskowski L., Young J., Jackson L., Arnold S., Barker M.A., Walsh M.D., Buchanan D.D., Holman S., Mensink K.A., Jenkins M.A., Hopper J.L., Thibodeau S.N., Jass J.R., Spurdle A.B. Stability of BAT26 in Lynch syndrome colorectal tumours. Eur J Hum Genet. 2007;15:139–141. doi: 10.1038/sj.ejhg.5201740. author reply, 141–142. [DOI] [PubMed] [Google Scholar]
- 54.Wahlberg S.S., Schmeits J., Thomas G., Loda M., Garber J., Syngal S., Kolodner R.D., Fox E. Evaluation of microsatellite instability and immunohistochemistry for the prediction of germ-line MSH2 and MLH1 mutations in hereditary nonpolyposis colon cancer families. Cancer Res. 2002;62:3485–3492. [PubMed] [Google Scholar]
Associated Data
This section collects any data citations, data availability statements, or supplementary materials included in this article.
Supplementary Materials
Sensitivity and specificity of each MSI marker in identifying MMR protein deficiency. Sensitivity is the proportion of tumors with instability in a specific marker among the tumors with MMR protein deficiency. Specificity is the proportion of tumors without instability in a specific marker among the tumors without MMR protein deficiency.