

Abstract
The Ewing's family of tumors (EFTs) are characterized by chimeric transcripts generated by specific chromosomal rearrangements. The most common fusions are between the EWSR1 gene on chromosome 22 and the ETS family of transcription factors; rarely, FUS (on chromosome 16) substitutes for EWSR1. The detection of specific translocations using molecular analysis is now a routine part of the pathological examination of EFT. Here, we report our experience with molecular diagnosis of EFT during the 4 years (2006–2009) at the Rizzoli Institute. We analyzed 222 consecutive tumors with a presumptive diagnosis of EFT using molecular techniques and IHC. We found five distinct types of EWSR1-FLI1 fusion transcripts resulting from translocation t(11;22), three types of EWSR1-ERG transcripts resulting from t(21;22), and one type of t(2;22) resulting in EWSR1-FEV fusion. Molecular investigation validated 92% of cases ultimately diagnosed as EFT; IHC validated 76% of the cases. Thus, despite the difficulties and limitations associated with both molecular and IHC analysis on fresh and formalin-fixed, paraffin-embedded tissue, a combination of these techniques is the best approach to enhancing the accuracy of EFT diagnosis. We also present our method for choosing which molecular techniques to apply. Finally, we collected the most prevalent breakpoints reported in the literature, indicating which exons are involved, the sequence breakpoints, and the NCBI reference sequences.
Ewing's sarcoma (ES) is a highly malignant small round cell tumor (SRCT) that can arise in both bone and soft tissues of children and young adults. Rarely, it occurs also in adults.1,2 It is the second most common pediatric bone tumor after osteosarcoma, accounting for ∼30% of all primary bone tumors in this age group.1,3,4 Based on their shared immunophenotypes and molecular parameters, several diagnostic entities that were previously considered distinct are now assembled as a single entity, the Ewing's sarcoma family of tumors (EFTs). These include bone and extraskeletal Ewing's sarcoma, primitive neuroectodermal tumor (PNET), and Askin tumor of the thoracopulmonary region.1,5–7
The histological evaluation of EFT is based on morphological, immunophenotypic, and molecular features. The morphology of ES is variable. These tumors are frequently composed of uniform small round cells with round nuclei containing fine chromatin, scanty clear or eosinophilic cytoplasm, and indistinct cytoplasmic membranes. In less differentiated cases, tumor cells are larger, with prominent nucleoli and irregular contours. The cytoplasm frequently contains PAS-positive diastase-resistant glycogen. PNET is characterized by Homer-Wright rosettes, which are typical of neuroectodermic differentiation.6,8,9
Immunohistochemical analysis (IHC), the first ancillary technique used in pathology to confirm the diagnosis of EFT, can distinguish among different variants. The immunohistochemical features of ES are positivity for CD99, FLI1, and caveolin 1 antigens, whereas PNET also shows immunoreactivity for S100 protein, chromogranin, and synaptophysin antigens. These positive reactions, along with negative reactions for a panel of other markers (including muscular and lymphoid markers), support the diagnosis of EFT.9
The EFTs are characterized genetically by specific chromosomal translocations resulting in a fusion of the EWSR1 (22q12) gene with one of the members of the ETS family of transcription factors: the FLI1 gene (11q24) in 85% of cases and the ERG gene (21q22) in 5%–10% of cases. Less frequently, EWSR1 is fused with FEV (2q36), ETV1 (7p21), or ETV4 (alias E1AF; 17q21).4,10–14 There are also rare variants involving the FUS (16p11) gene juxtaposed to the ERG (21q22) gene, a t(16;21) rearrangement.14,15 In addition, the FUS-FEV fusion gene has been described, resulting from the t(2;16)(q36;p11) rearrangement.16 Finally, two new translocations were recently identified: t(20;22), involving EWSR1 and NFATC2 (20q13), and t(4;22), involving EWSR1 and SMARCA5 (4q31).17,18
Establishing the correct diagnosis of EFT (as opposed to other small round cell tumors) has particular clinical relevance.19,20 The diagnosis is based on the evaluation of clinical, radiological, and pathological features. The determination of a chimeric transcript by RT-PCR and/or the gene rearrangement involved in a translocation by fluorescence in situ hybridization (FISH) is often required for validation of the diagnosis.21,22
In the present study, we analyzed 222 tumors with a presumptive diagnosis of EFT. We characterized the fusion transcripts and the gene rearrangement using RT-PCR and FISH, and compared the utility of the different ancillary techniques used to support a diagnosis of EFT. We also reviewed the literature to summarize the most frequent breakpoints found to date.
Materials and Methods
We evaluated 222 consecutive patients with a presumptive diagnosis of EFT who underwent surgery during a 4-year period (2006–2009). The majority of the cases were tumors biopsied or excised at our hospital and processed locally; 61 cases were consultations from outside institutions, sent to us for a second diagnostic opinion.
Of the 222 patients, 149 were male and 73 were female. For each case, either the biopsy specimen or the surgical specimen was analyzed. Part of each sample was used for histological and immunohistochemical characterization, and another portion was frozen for molecular analysis. When frozen tissue was not available or if the amount was too small (eg, from consultations or fine-needle aspiration biopsies), the molecular analysis was performed on formalin-fixed paraffin-embedded (FFPE) tissue.
In our laboratory, the protocol for molecular analysis was determined as follows. Fresh tissue or FFPE tissue was first analyzed by RT-PCR. FISH analysis was used if the material was inadequate for RT-PCR [ie, <1000 tumor cells, poor RNA quality (A260/280 < 1.6)] or if the RT-PCR results were negative (Figure 1). To evaluate fresh tissue tumor cellularity under light microscopy, frozen sections were stained with hematoxylin-eosin. Regarding FFPE tissue, >1000 tumors cells corresponds to a tissue section area of approximately 1–2 mm2. In our experience, <1000 tumor cells (eg, in small samples such as from fine-needle aspiration biopsies) is too little for RT-PCR analysis, but is suitable and adequate for a good FISH analysis, for which a minimum of 100 tumor cell nuclei with intact morphology are necessary.
Figure 1.
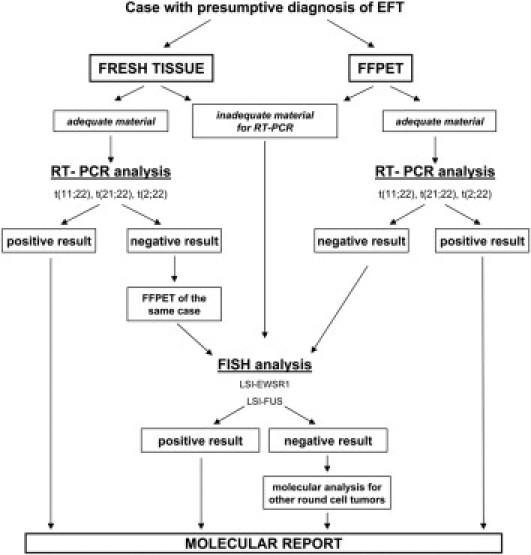
Algorithm showing the protocol used in our laboratory to evaluate the presence of gene rearrangements in tumors with presumptive diagnosis of EFT. FISH, fluorescence in situ hybridization; LSI, locus-specific identifier (probe); FFPET, formalin-fixed paraffin-embedded tissue.
RT-PCR
RNA was extracted from fresh tissue using a modified method including TRIzol reagent (Invitrogen, Carlsbad, CA) and the column of an RNeasy mini kit (Qiagen, Hilden Germany; Valencia, CA). To extract RNA from FFPE tissue, sections 6–8 μm in thickness were cut from the representative paraffin block, deparaffinized with xylene, rinsed in ethanol, and digested by proteinase K. The extraction was performed using a Pinpoint slide RNA isolation System II kit (Zymo Research, Glasgow, Scotland, UK). Special attention was paid to the cutting step, and the blade was changed for each paraffin block to avoid any potential contamination.
Further quantification of RNA was done spectrophotometrically by measuring the absorbance at 260 nm (1 optical density unit = 40 μg/mL of RNA). The purity of RNA was determined by the ratio of its readings at 260 and 280 nm (A260/A280); a ratio of >1.6 was considered acceptable.
The RNA (2 μg) was then reverse-transcribed to cDNA using a high-capacity cDNA archive kit (Applied Biosystems, Foster City, CA). The PCR was performed in a total volume of 25 μL; each reaction mixture contained 2.5 μL of 10× PCR buffer (Invitrogen), 1.2 mmol/L magnesium chloride, 0.2 mmol/L of each deoxynucleotide triphosphate, 0.4 mmol/L of each sense and antisense primer, 0.5 U of Taq DNA polymerase (Invitrogen), and 3 μL of the cDNA template.
PCR was performed for detection of the t(11;22) EWSR1-FLI1, t(21;22) EWSR1-ERG, and t(2;22) EWSR1-FEV translocations. The primers used for PCR amplification of EFT translocations are listed in Table 1, rows 1–6) and have been previously reported.3,11,21,23–26 On fresh tissue, we used the EWS 22ex7-FLI1 11ex9 primers to evaluate t(11;22), and to evaluate t(21;22) we used primers EWSB-ERGB, designed for us with Primer Express Software version 2.0 (Applied Biosystems). To our knowledge, the primer pair EWSB-ERGB has not been used in previous studies (Table 1, rows 7 and 8). On RNA extracted from FFPE tissue, we were able to obtain satisfactory PCR fragments with PCR primers that generate relatively small PCR products (<250 bp). To evaluate t(11;22), we used the EWS 22ex7-PARA FLI1 primers to detect type 1 (129 bp) and type 2 (195 bp), and to evaluate t(21;22) on FFPE tissue we used the EWS 22ex7-ERG Q primers to detect type 1 (137 bp). The primer pair EWS 22ex7-FEV 2ex3 was used for the detection of t(2;22) on fresh tissue; on FFPE tissue, the EWS 22ex7-FEV F1 primer pair was used to detect t(2;22) type 1 (235 bp). When indicated, we performed RT-PCR for diagnostic exclusion of other small round cell tumors using the previously reported primers listed in Table 1 (rows 9–20),27–31 according to the pathologist's request.
Table 1.
Primer Sequences for Fusion Transcripts in Small Round Cell Tumors
| Tumor | Primer | Sequence | |
|---|---|---|---|
| 1 | EFT | F-EWS 22ex7 | 5′-TCCTACAGCCAAGCTCCAAGTC-3′ |
| 2 | EFT | R-FLI1 11ex9 | 5′-ACTCCCCGTTGGTCCCCTCC-3′ |
| 3 | EFT | R-PARA FLI1 | 5′-GGACTTTTGTTGAGGCCAGA-3′ |
| 4 | EFT | R-ERG Q | 5′-GGTTGAGCAGCTTTCGACTG-3′ |
| 5 | EFT | R-FEV 2ex3 | 5′-TAGCGCTTGCCATGCACCTT-3′ |
| 6 | EFT | R-FEV F1 | 5′-GCTTGAACTCGCCGTGACCG-3′ |
| 7 | EFT | F-EWSB | 5′-ACCCACCCCAAACTGGATCC-3′ |
| 8 | EFT | F-ERGB | 5′-CGAACTTGTAGGCGTAGCGC-3′ |
| 9 | SS | F-SYT | 5′-GGACAAGGTCAGCAGTATGGA-3′ |
| 10 | SS | R-SSX1 | 5′-TTGGGTCCAGATCTCTTATT-3′ |
| 11 | SS | R-SSX2 | 5′-TTGGGTCCAGATCTCTCGTG-3′ |
| 12 | ARMS | F-PAX3 | 5′-GCACTGTACACCAAAGCACG-3′ |
| 13 | ARMS | F-PAX7 | 5′-CCGACACCAGCTCTGCCTAC-3′ |
| 14 | ARMS | R-FKHR | 5′-ATGAACTTGCTGTGTAGGGACAG-3′ |
| 15 | IFS | F-ETV6 (TEL 971) | 5′-ACCACATCATGGTCTCTGTCTCC-3′ |
| 16 | IFS | R-NTRK3 1838 | 5′-CCGCACACTCCATAGAACTTGAC-3′ |
| 17 | DSRCT | F-EWS 22ex7 | 5′-TCCTACAGCCAAGCTCCAAGTC-3′ |
| 18 | DSRCT | R-WT1 ex8 | 5′-ACCTTCGTTCACAGTCCTTG-3′ |
| 19 | MLS | F-FUS ex5 | 5′-CAGCCAGCAGCCTAGCTATG-3′ |
| 20 | MLS | F-EWS ex7 | 5′-CTGGATCCTACAGCCAAGCTCCAAG-3′ |
| 21 | MLS | R-CHOP ex3 | 5′-TGTCCCGAAGGAGAAAGGCAATG-3′ |
ARMS, alveolar rhabdomyosarcomas; DSRCT, desmoplastic small round cell tumor; EFT, Ewing's sarcoma family tumors; ex, exon; IFS, infantile fibrosarcoma; MLS, myxoid liposarcoma; SS, synovial sarcoma. CHOP is an alias of DDIT3; FKHR is a previous gene symbol for FOXO1; SYT is an alias of SS18.
RNA integrity was assessed with primers for the housekeeping gene β-actin. Positive case controls consisted of a Ewing's sarcoma, which was analyzed by sequencing to confirm the specific translocation. We used the positive controls of the types previously identified in our laboratory. For t(11;22) EWSR1-FLI1, we have type 1 (exon 7/6 fusion), type 2 (exon 7/5 fusion), type 3 (exon 10/6 fusion), type 4 (exon 10/5 fusion), type 8 (exon 7/8 fusion), and exon 7/7 fusion positive controls. For t(21;22), we have type 1 (exon 7/6 fusion) positive control, exon 7/10 fusion positive control, and the controls corresponding to EWS-ERG exon 7/13 fusion and EWS-ERG exon 10/10 fusion. For t(2;22), we have the positive control corresponding to EWSR1-FEV exon 7/2 fusion. In addition, negative controls (RNA from normal tissue or from other types of tumors and a water blank) were included in each RT-PCR reaction.
PCR Products
The PCR products were resolved on 2% agarose gel electrophoresis, followed by Gel Star (Lonza, Rockland, ME) staining. The RT-PCR assay was considered suitable for interpretation when the β-actin control product was present, when the positive control for the fusion gene was positive, and when the negative and water controls showed no amplified product (Figure 2).
Figure 2.
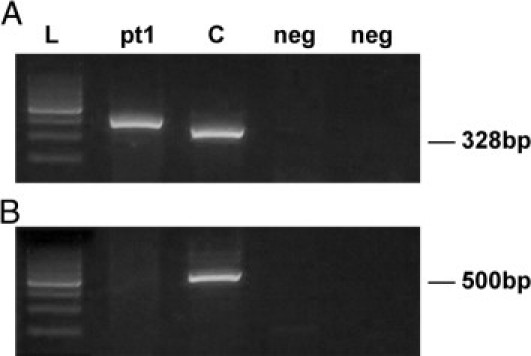
RT-PCR for detection of EWSR1-FLI1 transcript (A) and EWSR1-ERG transcript (B) in the same patient. Lane pt1 is the RT-PCR product obtained from patient's tumor RNA. In A, the band corresponds to a type 2 EWSR1-FLI1 fusion transcript; in B, no band is present, denoting a negative result for the EWSR1-ERG fusion. Lane C is the t(11;22) positive control; the band represents type 1 fusion. Lanes marked neg are negative controls, and the size marker (lane L) is a 100-bp DNA ladder (Promega).
Sequencing of RT-PCR Products
The cases in which an unexpected band size was detected were analyzed by automatic sequencing (Figure 3). The sequencing allowed us to typify new types, which were used as positive controls in further analyses. PCR products were separated by electrophoresis on 2% agarose gel and were purified using an Agencourt AMPure magnetic beads kit (Beckman Coulter, Fullerton, CA). Sequencing analysis was then performed on a CEQ2000 XL automatic DNA sequencer (Beckman Coulter). The strands were screened using the same PCR forward and reverse primers as previously described.
Figure 3.
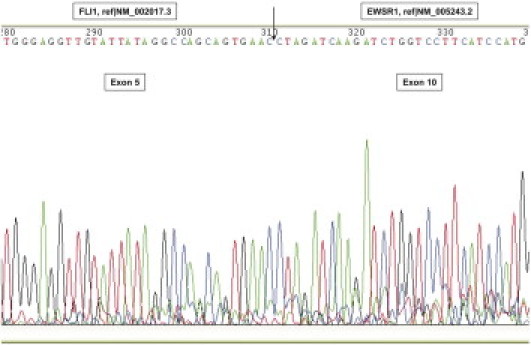
Sequence analysis of an EWSR1-FLI1 fusion transcript at the breakpoint region, confirming the fusion of EWSR1 exon 10 to FLI1 exon 5 resulting in t(11;22) type 4.
The sequencing of some cases was performed by Bio-Fab Research (Rome, Italy), because the number of samples we needed to process was too great for us to process alone.
Computer analysis of sequences was conducted with Basic Local Alignment Search Tool (BLAST) sequence similarity searches using the National Center of Biotechnology Information Database, NCBI (http://www.ncbi.nlm.nih.gov/BLAST, last accessed June 17, 2009).
FISH
FISH was performed using Vysis LSI (locus-specific identifier) dual-color, break-apart DNA probes (Abbott Molecular, Des Plaines, IL) for EWSR1 (22q12) and FUS (16p11) according to the manufacturer's protocol. Tissue sections (4 μm thick) were mounted on positively charged slides (Dako, Glostrup, Denmark), a hematoxylin-stained section from each tumor was prepared, and areas of representative non-necrotic neoplasm were marked. Slides were heated overnight (60°C), dewaxed in xylene, and treated with a graded ethanol-to-water series. This was followed by incubation in TE solution (Tris/l-EDTA, 5 mmol/L:1 mmol/L) at 96°C for 15 minutes, then a rinse in distilled water, and digestion with pepsin (0.04%) in 0.01N HCl at 37°C for 5 to 15 minutes, then a wash again in distilled water.
Slides were finally dehydrated in ethanol (96%) and air-dried. Next, the LSI probe was applied to the target area and the slides were coverslipped and sealed with rubber cement.
The samples and probe were co-denatured in Dako Hybridizer (Dako, Glostrup, Denmark) at 85°C for 1 minute and incubated overnight at 37°C.
The following day, the coverslips were removed and the slides were washed for 2 minutes at 75 ± 1°C in 0.4× standard saline citrate/0.3% NP40 and for 1 minute at room temperature in 2× standard saline citrate/0.1% NP40.The slides were then left to dry in the dark at room temperature; the nuclei were subsequently counterstained in Vectashield antifade solution with DAPI (Vector Laboratories, Burlingame CA).
Fluorescence signals were counted using an Olympus BX41 fluorescence microscope (Olympus, Hamburg Germany), at ×100 magnification under oil immersion using an appropriate filter set. Representative cells were captured using a Color View III CCD camera interfaced with the Soft Imaging System CellP software package version 2.2 (Olympus).
A minimum of 100 tumor cell nuclei with intact morphology as determined by DAPI counterstaining were counted in the previously marked neoplastic area. Cells with nuclear overlap and indistinguishable separate nuclei were excluded from analysis. In normal cells without a translocation, two fused or very close red-green signals were observed (Figure 4A). A positive result was defined as the presence of a visible translocation (separation of red and green signals >3 signal diameters) in >10% of the cells (Figure 4B). In cells with a translocation involving EWSR1, different types of signal patterns were observed in accordance with previous report.22
Figure 4.
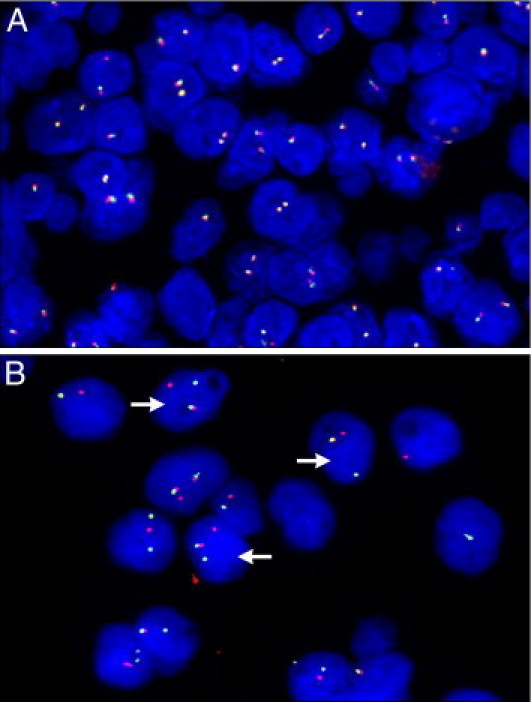
A: Negative FISH analysis of FUS showing two normal fusion signals. B: Positive FISH analysis of EWSR1 for the same patient; arrows indicate the normal fusion signal and split red and green signals, indicating a rearrangement of one copy of the EWSR1 region.
Immunohistochemistry
IHC was performed in all of the cases studied. Formalin-fixed, paraffin-embedded sections, 4 μm thick, were immunostained using an automated immunostainer (Dako, Glostrup, Denmark). The various antibodies used are listed in Table 2. The CD99 antibody was used in all cases; the other antibodies were used according to the pathologist's request.
Table 2.
Antibodies for Immunohistochemical Analysis
| Antibody | Clone | Source | Dilution | Pretreatment | Distribution |
|---|---|---|---|---|---|
| CD99 | 12E7 | Dako | 1:200 | None | membranous and cytoplasmic |
| FLI1 | G146-222 | Becton Dickinson | 1:100 | Citrate buffer pH 8.0/95°C/30 minutes | Nuclear |
| Caveolin 1 | N-20 | Santa Cruz Biotechnology | 1:300 | Citrate buffer pH 8.0/95°C/30 minutes | Cytoplasmic |
| S100 | Polyclonal | Dako | 1:5000 | Proteinase K | Nuclear and cytoplasmic |
| Terminal deoxynucleotidyl transferase | Polyclonal | Dako | 1:40 | Citrate buffer pH 8.0/95°C/30 minutes | Nuclear |
| Leukocyte common antigen | CD45 | Dako | Prediluted | None | Cytoplasmic |
| Epithelial membrane antigen | E-29 | Dako | Prediluted | None | Cytoplasmic |
| Cytokeratin | MNF-116 | Dako | 1:1200 | Proteinase K | Cytoplasmic |
| Chromogranin A | Polyclonal | Dako | Prediluted | None | Cytoplasmic |
| Synaptophysin | Polyclonal | Dako | Prediluted | None | Cytoplasmic |
| Desmin | D-33 | Dako | Prediluted | None | Cytoplasmic |
| Muscle actin | HHF-35 | Dako | Prediluted | None | Cytoplasmic |
| Smooth muscle actin | 1A4 | Dako | Prediluted | None | Cytoplasmic |
| Myogenic factor 4 (MYF4) | LO-26 | Dako | 1:40 | Citrate buffer pH 8.0/95°C/30 minutes | Nuclear |
| Myogenin | F5D | Dako | 1:40 | Citrate buffer pH 8.0/95°C/30 minutes | Nuclear |
The slides were deparaffined in xylene and then rehydrated in graded alcohols and water. If necessary, endogenous tissue peroxidase was blocked by treating the sections with 0.3% H2O2; if necessary, a pretreatment was applied. To reduce nonspecific binding, sections were incubated with normal serum.
Antibody detection was performed using a Dako REAL detection system: streptavidin-biotin alkaline phosphatase/red, rabbit-mouse for cytoplasmic antigens and peroxidase/DAB, rabbit-mouse for nuclear antigens. The slides were stained with hematoxylin and then rehydrated and coverslipped. Appropriate positive and negative controls were included in each run.
In the cases in which histopathological and immunohistochemical features were not suggestive of EFT, nor of SRCT, the IHC analysis of specific markers of other round cell tumors was performed based on differential diagnosis and following the requirements of the pathologist (Table 2).
Results
Many authors have reported sequences that result from the linkage of the EWSR1 gene to the FLI1, ERG, FEV, ETV1, ETV4 (alias E1AF), and NFATC2 genes, as well as those involving the FUS gene in Ewing's sarcoma.14–17,23,25,26,32–35 In Figures 5, 6, 7, and 8, we summarize the most prevalent types of exon fusion described in the literature to date and indicate the sequence breakpoint and the NCBI reference sequences. To our knowledge, the present report is the first to present a single summary of all the most prevalent breakpoint sequences of EFTs.
Figure 5.
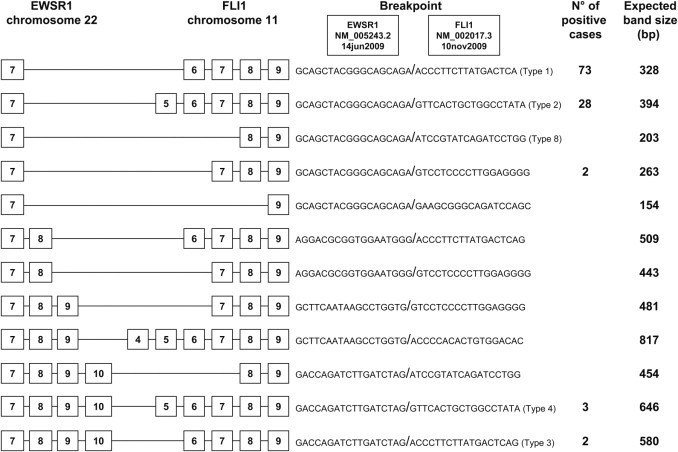
The most prevalent types of exon breakpoints (indicated by boxed numbers) for the t(11;22) EWSR1-FLI1 translocation in EFT, with the number of positive cases identified in our series and the expected band size of the products, using primer pair EWS 22ex7-FLI1 11ex9.
Figure 6.
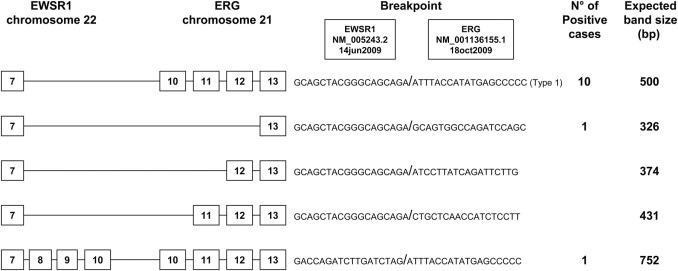
The most prevalent types of exon breakpoints (indicated by boxed numbers) for the t(21;22) EWSR1-ERG translocation in EFT, with the number of positive cases identified in our series and the expected band size of the products, using primer pair EWSB-ERGB.
Figure 7.
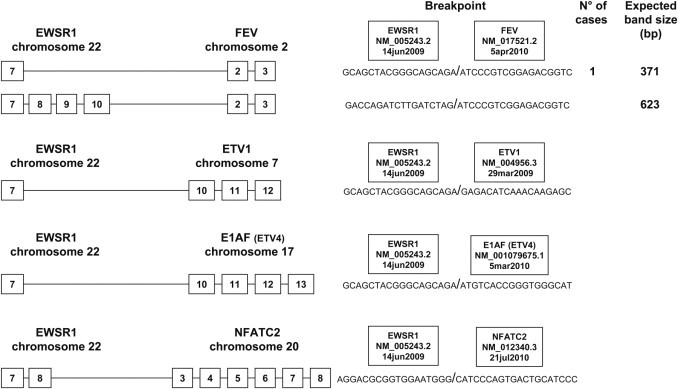
The most prevalent types of exon breakpoints (indicated by boxed numbers) for the rare translocations of EFT, with the expected band size of the products, using primer pair EWS 22ex7-FEV 2ex3. In the present study, we detected 1 case with t(2;22) EWSR1-FEV translocation. Translocations t(7;22), t(17;22), and t(20;22) are not yet routinely assessed in our laboratory.
Figure 8.
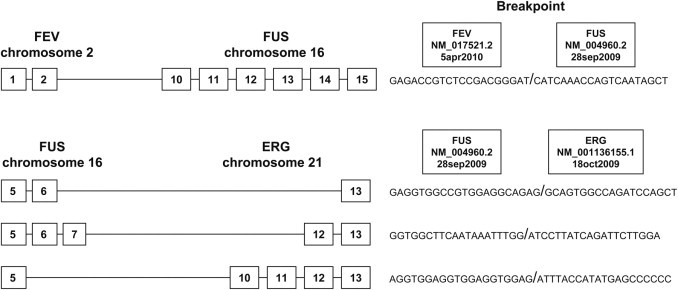
The types of exon breakpoints (indicated by boxed numbers) of the rare variants in which the gene FUS is involved. The translocations t(2;16) and t(16;21) are not yet routinely assessed in our laboratory.
Of the 222 total cases analyzed, 188 cases (85%) had interpretable results by FISH or RT-PCR (or both techniques) and were thus considered informative from a molecular point of view. For the remaining 34 cases (15%), the molecular results were considered noninformative; these were samples without adequate FISH results (absent and/or weak fluorescence signal) and without acceptable RT-PCR results (absence of expression of the housekeeping gene β-actin).
Out of the 188 cases informative for molecular results (Table 3), 144 cases were positive for the EWSR1 translocation. Of these, 108 cases were positive for the t(11;22) EWSR1-FLI1 translocation, 12 cases were positive for the EWSR1-ERG gene fusion, and 1 case was positive for the EWSR1-FEV gene fusion. The remaining 23 cases had insufficient RNA quality for RT-PCR but FISH analysis revealed the EWSR1 rearrangement (Table 4).
Table 3.
Molecular Results and Diagnosis
| RT-PCR/FISH | EFT | SRCT | Non-EFT/SRCT | Total cases |
|---|---|---|---|---|
| Positive for EWS translocation | 144 | 0 | 0 | 144 |
| Negative for EWS and FUS translocation | 12 | 4 | 28 | 44 |
| Total cases | 156 | 4 | 28 | 188 |
EFT, Ewing's sarcoma family tumors; FISH, fluorescence in situ hybridization; SRCT, small round-cell tumors.
Table 4.
Summary of the 144 Positive Cases
| Transcript variants | No. of cases detected | % |
|---|---|---|
| Detectable transcripts with RT-PCR (n = 121) | ||
| EWSR1-FLI1 t(11;22) (n = 108) | ||
| 7/6 (type 1) | 73 | 67.8 |
| 7/5 (type 2) | 28 | 25.9 |
| 10/6 (type 3) | 2 | 1.8 |
| 10/5 (type 4) | 3 | 2.7 |
| 7/7 | 2 | 1.8 |
| EWSR1-ERG t(21;22) (n = 12) | ||
| 7/13 | 10 | 83.3 |
| 7/10 | 1 | 8.3 |
| 10/10 | 1 | 8.3 |
| EWSR1-FEV t(2;22) | ||
| 7/2 | 1 | |
| FISH analysis (n = 23) | ||
| EWSR1 rearrangement | 23 | |
| FUS rearrangement | 0 | |
| 144 | ||
FISH, fluorescence in situ hybridization.
Negative molecular results were obtained in 44 cases (Table 5); in these cases the EWSR1-FLI1, EWSR1-ERG, and EWSR1-FEV transcripts were not observed by RT-PCR technique. These same cases were also negative for the EWSR1 and FUS rearrangements on FISH analysis. According to the pathologist's requests, which differed according to the various differential diagnoses, RT-PCR and/or FISH was performed on the 44 negative cases to exclude or diagnose other small round cell tumors. For synovial sarcoma, we tested for t(X;18) SSX-SS18 (previously SSX-SYT) by RT-PCR and/or LSI probe for SS18 by FISH. For rhabdomyosarcoma, we tested for t(1;13) PAX7-FOXO1 (previously PAX7-FKHR) and t(2;13) PAX3-FOXO1 by RT-PCR and/or LSI probe for FOXO1 by FISH. For congenital fibrosarcoma, we tested for t(12;15) ETV6-NTRK3 by RT-PCR. For desmoplastic round cell tumor, we tested for t(11;22) EWSR1-WT1 by RT-PCR. Finally, for round cell myxoid liposarcoma, we tested for t(12;16) DDIT3-FUS (alias CHOP-TLS) and t(12;22) EWSR1-DDIT3 by RT-PCR and/or LSI probe for DDIT3 by FISH analysis.
Table 5.
Summary of 44 Negative Cases
| Case no. | RT-PCR t(11;22), t(21;22) t(2;22) | FISH LSI-EWSR1 (22q12) | FISH LSI-FUS (16p11) | Additional Analysis |
|---|---|---|---|---|
| Final diagnosis: EFT (n = 12) | ||||
| 1 | Neg | Neg | Neg | IHC |
| 2 | Neg | Neg | Neg | IHC and MA |
| 3 | Neg | Neg | Neg | IHC and MA |
| 4 | Neg | Neg | Neg | IHC |
| 5 | Neg | Neg | Neg | IHC |
| 6 | Neg | Neg | Neg | IHC |
| 7 | Neg | Neg | Neg | IHC |
| 8 | Neg | Neg | Neg | IHC |
| 9 | Neg | Neg | Neg | IHC and MA |
| 10 | Neg | Neg | Neg | IHC and MA |
| 11 | Neg | Neg | Neg | IHC |
| 12 | Neg | Neg | Neg | IHC and MA |
| Final diagnosis: SRCT (n = 4) | ||||
| 13 | Neg | Neg | Neg | IHC and MA |
| 14 | Neg | Neg | Neg | IHC and MA |
| 15 | Neg | Neg | Neg | IHC and MA |
| 16 | Neg | Neg | Neg | IHC and MA |
| Final diagnosis: non-EFT/SRCT (n = 28)⁎ | ||||
| 17–44 | Neg | Neg | Neg | IHC and MA |
EFT, Ewing's sarcoma family tumors; FISH, fluorescence in situ hybridization; IHC, immunohistochemical analysis; LSI, locus-specific identifier (probe); MA, molecular analysis; SRCT, small round-cell tumors.
Non-EFT/SRCT: 7 lymphomas, 10 osteosarcomas, 1 myxoid liposarcoma, 1 synovial sarcoma, 1 malignant peripheral nerve sheath tumor, 2 undifferentiated cancers, 3 spindle cell sarcomas and 3 bone metastases from carcinoma.
On the basis of the clinical, radiological, pathological, immunohistochemical, and molecular data, the 188 informative cases were ultimately diagnosed as follows. Of the 188 cases, 156 were EFTs, of which 144 (92%) had an EWSR1 translocation and 12 (8%) did not, and 4 were undifferentiated SRCT, all negative for an EWSR1 and FUS rearrangement; 28 cases were not EFT/SRCT and were subsequently diagnosed as 7 lymphomas, 10 osteosarcomas, 1 myxoid liposarcoma, 1 synovial sarcoma, 1 malignant peripheral nerve sheath tumor, 2 undifferentiated cancers, 3 spindle cell sarcomas, and 3 bone metastases from carcinoma (Table 5). After molecular analysis, these 28 cases were negative for EFT translocations. The 7 lymphomas were positive for specific antibodies [leukocyte common antigen (LCA), terminal deoxynucleotidyl transferase (TdT)] after IHC analysis; moreover lymphocyte immunophenotyping confirmed lymphoma in these 7 tumors. The morphology of the 10 osteosarcomas was characterized by the production of osteoid tissue. The synovial sarcoma was positive for the SS18-SSX translocation (previously SYT-SSX) and the myxoid liposarcoma was positive for the FUS-DDIT3 translocation (alias TLS-CHOP). The case ultimately diagnosed as a malignant peripheral nerve sheath tumor was positive for a specific antibody (S100 focally positive). Regarding the remaining two undifferentiated cancers and the three spindle cell sarcomas, the morphology and the IHC analysis guided the diagnosis of these entities, after excluding diagnoses on molecular analyses. The three bone metastases from carcinoma were positive for specific antibodies (cytokeratins).
The 12 cases negative for translocation that were ultimately diagnosed as EFT are summarized in Table 6. To exclude lymphoma, the IHC analysis of some specific antibodies (LCA, TdT) was performed. Out of these cases, 10 were finally diagnosed as ES (8 of bone and 2 extraskeletal), and 2 cases as PNET. Cases 1, 4, 5, 7, and 8 were diagnosed as ES because they were positive for CD99, FLI1, and/or caveolin 1 antigens and showed a classic morphology composed of sheets of monotonous round or oval cells with nuclei with smooth contours, finely dispersed chromatin, and a moderate amount of clear glycogen-rich cytoplasm. Cases 6 and 11 were diagnosed as PNET because they were positive for chromogranin and synaptophysin antigens and presented the classic Homer-Wright rosettes that are usually present in neuroectodermal tumors. Cases 2, 3, 9, 10, and 12 showed atypical morphology with poorly differentiated cells, round-to-ovoid pleomorphic nuclei, and, in some cases, appeared similar to poorly differentiated synovial sarcoma. For these cases, we performed additional molecular analyses to exclude other entities. They were negative on molecular analysis for t(X;18) and/or t(12;16), t(12;22), and/or t(1;13) or t(2;13) translocations, but were positive for CD99, FLI1, and/or caveolin 1 antigens. In these cases, the pathologist's experience allowed the final diagnosis of ES to be determined, based on IHC results, clinical features, and imaging.
Table 6.
Summary of the 12 Translocation-Negative Cases Ultimately Diagnosed as EFT
| Negative cases | Final EFT diagnosis | Age (years) | Site | RT-PCR t(11;22) t(21;22) t(2;22) | FISH LSI-EWSR1 (22q12) | FISH LSI-FUS (16p11) | Additional RT-PCR analysis | Additional FISH analysis | IHC analysis |
|---|---|---|---|---|---|---|---|---|---|
| 1 | ES of bone | 14 | Vertebra | Neg | Neg | Neg | + CD99, FLI1. − S100, LCA, TdT | ||
| 2 | ES of bone | 34 | Pelvis | Neg | Neg | Neg | Neg t(X;18) | Neg LSISS18 | + CD99, FLI1, caveolin 1. − S100, LCA, TdT, cytokeratin, EMA |
| 3 | Extraskeletal ES | 40 | Dorsum | Neg | Neg | Neg | Neg LSISS18 | + CD99, FLI1, caveolin 1. − LCA, TdT, S100, cytokeratin, chromogranin A, synaptophysin | |
| 4 | ES of bone | 45 | Pelvis | Neg | Neg | Neg | + CD99, caveolin 1. − LCA, TdT, cytokeratin, chromogranin A, synaptophysin | ||
| 5 | Extraskeletal ES | 51 | Pancreas | Neg | Neg | Neg | + CD99, FLI1, caveolin 1. − S100, LCA, TdT | ||
| 6 | PNET | 4 | Cranium | Neg | Neg | Neg | + FLI1, caveolin 1, chromogranin A, synaptophysin. − CD99, cytokeratin, LCA, TdT, desmin, smooth muscle actin, muscle actin, MYF4, myogenin | ||
| 7 | ES of bone | 60 | Vertebra | Neg | Neg | Neg | + CD99, caveolin 1. | ||
| 8 | ES of bone | 23 | Pelvis | Neg | Neg | Neg | + CD99, FLI1. − S100, LCA, TdT | ||
| 9 | ES of bone | 7 | Chest | Neg | Neg | Neg | Neg LSISS18 | + CD99, FLI1, caveolin 1. − S100, LCA, TdT | |
| 10 | ES of bone | 19 | Tibia | Neg | Neg | Neg | Neg t(X;18), Neg t(1;13), Neg t(2;13) | Neg LSISS18, LSI-FKHR | + CD99, FLI1. − LCA, TdT, desmin, smooth muscle actin, muscle actin, EMA, cytokeratin |
| 11 | PNET | 23 | Scapula | Neg | Neg | Neg | + CD99, FLI1, caveolin 1, chromogranin A, synaptophysin. − LCA, TdT | ||
| 12 | ES of bone | 23 | Femur | Neg | Neg | Neg |
|
|
+ CD99, FLI1. − S100, LCA, TdT, smooth muscle actin, muscle actin, desmin, MYF4, myogenin |
EFT, Ewing's sarcoma family tumors; EMA, epithelial membrane antigen; ES, Ewing's sarcoma; FISH, fluorescence in situ hybridization; IHC, immunohistochemical analysis; LCA, leukocyte common antigen; PNET, primitive neuroectodermal tumor; TdT, terminal deoxynucleotidyl transferase; +, positive results; −, negative results.
Of the four cases ultimately diagnosed as SRCT, three were positive for the CD99 antigen and the remaining case was negative. Morphologically, these four tumors could have been undifferentiated ES or poorly differentiated synovial sarcoma, but the diagnosis of undifferentiated SRCT was ultimately confirmed because these tumors were negative for the t(X;18) translocation performed by RT-PCR and FISH and because the complete IHC analysis did not confirm the undifferentiated ES (CD99 was positive in three cases, but FLI1 and caveolin 1 were not). In general, the category of SRCT was assigned based on the pathologist's experience when the morphological, antigenic, and molecular features were not diagnostic for any single established entity. All results are summarized in Figure 9 and in Tables 5 and 6.
Figure 9.

Schematic of results. EFT, Ewing sarcoma family tumors; FISH, fluorescence in situ hybridization; SRCT, small round-cell tumors; +, positive results; −, negative results.
Discussion
The gold standard for making a diagnosis of EFT is based on the complete set of clinical data, including imaging, histological, immunohistochemical, and molecular features. From a pathological point of view, the diagnosis of EFT is based on the application of specific immunohistochemical panel. The IHC panel should include vimentin, CD99, FLI1, caveolin 1, S-100, synaptophysin, chromogranin, and specific antibodies used to exclude others round cell tumors [TdT, CD45, LCA, epithelial membrane antigen (EMA), cytokeratin, desmin, actin, myogenin, MYF4]. Positivity for the CD99 antigen is a feature that is sensitive but not specific for EFT,36,37 so it is important to test for CD99 together with other IHC markers. A further validation of the diagnosis is based on molecular analysis, because the Ewing's family of tumors is largely defined by the presence of specific translocations (because a very high percentage of these tumors are found to have the EWSR1 rearrangement and/or EWSR1/ETS fusion transcripts). In the last few years, a better understanding of the molecular basis of these tumors has resulted in the greater use of molecular techniques. Molecular diagnosis, using either FISH to detect the gene rearrangement and RT-PCR to detect the fusion transcript, is now a routine part of the pathological examination of EFT38 and has allowed for more precise diagnoses.
In the present study, we reviewed the available scientific data3,4,7,11,12,15,16,18,24–26,33–35,39–56 to collect the most prevalent chimeric types found for EFT to date (Figures 5, 6, 7, and 8). We also report the experience of the Department of Pathology at the Rizzoli Institute from 2006 to 2009. In this 4-year period, we analyzed 222 consecutive tumors with a presumptive diagnosis of EFT; 188 cases (85%) had sufficient information for interpretation. Of these, 77% (144/188) had an EWSR1 translocation and 23% (44/188) did not (Figure 9).
Of the tumors determined to have a translocation according to RT-PCR, 89% (108/121) had the t(11;22) EWSR1-FLI1 translocation, and the fusion transcript EWSR1-ERG was found in 10% (12/121) of the cases; one case (1%) was positive for t(2;22) EWSR1-FEV (Table 4). FISH was performed on 23 cases in which there was insufficient RNA quality for RT-PCR or in which a translocation was not identified by RT-PCR; all 23 cases, FISH analysis revealed the EWSR1 rearrangement. These tumors might contain rare translocations, such as t(17;22) or t(7;22) or t(20;22), that could not be detected by the primer combinations we used for RT-PCR, but that were revealed by FISH analysis. Of the remaining cases, 44/188 (23%) were negative for EWSR1 translocations by both RT-PCR and FISH (Table 5). To evaluate whether these tumors might contain the translocations t(2;16) or t(16;21), FISH was performed for the FUS gene. It has been reported that, before giving a diagnosis of SRCT with a Ewing-like phenotype, it is necessary to exclude the presence of rearrangements of FUS as well as EWSR1.40 Nonetheless, a negative molecular result should not preclude the diagnosis of EFT in the context of typical morphological, clinical, radiological, and immunophenotypic features.7 Molecular techniques sometimes require modifications to detect rare variants,16 and there may be variants not yet discovered. In fact, 12 cases were diagnosed as EFT even though the molecular analysis was negative (Table 6). In these cases, the pathologist's experience was critical in determining the final EFT diagnosis based on IHC results, clinical features, and radiological data, and after molecular exclusion of other entities.
In the present study, five distinct EWSR1-FLI1 fusion transcripts were identified, representing different combinations of exons from EWSR1 and FLI1. The most common was EWSR1-FLI1 exon 7/6 fusion (type 1) (67.8%) followed by EWSR1-FLI1 exon 7/5 fusion (type 2) (25.9%), EWSR1-FLI1 exon 10/5 fusion (type 4) (2.7%), EWSR1-FLI1 exon 10/6 fusion (type 3) (1.8%), and EWSR1-FLI1 exon 7/7 fusion (1.8%). Of the 12 tumors positive for EWSR1-ERG, three transcript variants were found: 10 cases with EWSR1-ERG exon 7/13 fusion, 1 case with EWSR1-ERG exon 7/10 fusion, and 1 case with EWSR1-ERG exon 10/10 fusion.
Retrospective studies indicate a relationship between prognostic value and the specific exons involved in the translocation,38,44,57–59 but the results are often contradictory. Prognostic relevance of the transcripts in our series was outside the scope of the present study.
Regarding IHC analysis, of the 156 tumors ultimately diagnosed as EFT, 118 cases (76%) showed moderate to strong CD99, FLI1, and/or caveolin 1 antibody positivity, whereas in 38/156 (24%) cases the CD99, FLI1, and/or caveolin 1 expression was focally inadequate for interpretation or was negative. These 38 cases were, however, positive for an EWSR1 translocation. Previous report has confirmed the existence of CD99-negative EFT in a limited number of cases.9 Our data reveal that IHC analysis validated 76% (118/156 cases positive for CD99, FLI1 and/or caveolin 1 with moderate to strong expression) of the cases ultimately diagnosed as EFT. This technique may, however, be limited in cases with low cellularity or uninterpretable results.
In our 4-year series, molecular analysis with RT-PCR and FISH validated approximately 92% (144/156) of the cases ultimately diagnosed as EFT. Our results are in accord with those of previous studies.22,32
Nonetheless, molecular techniques have their limits, as evidenced by the 15% (34/222) of cases with uninformative molecular results. Some samples were performed at different institutions, which likely have different methods of sample processing. The main problems we observed were related to fixation, excessive decalcification, and insufficient tissue. Other problems were fresh tissue kept at room temperature for too long (often in the operating room), resulting in RNA degradation. Some tissues had excessive necrosis (Bologna system 2–3)60 induced by neoadjuvant chemotherapy.61,62 These same problems have been also described in previous studies.21,45
Based on the present data, we recommend the use of both RT-PCR and FISH as complementary analyses; had we only used one or the other for each patient, the number of uninformative cases would have been higher. In our laboratory, we routinely perform RT-PCR first, because it is a rapid method and with lower costs; FISH is used secondarily whenever necessary.
In conclusion, the present study of a large series of 222 cases confirms that ancillary techniques are necessary to reach an accurate diagnosis of EFT. The optimal combination of these techniques depends on clinical and histological parameters. All three analyses (ie, IHC, RT-PCR, and FISH) are necessary in routine practice and should be performed wherever applicable, because together they provide molecular confirmation of the diagnosis of EFT.
Acknowledgments
We thank Cristina Ghinelli for graphic support and Patrizia Bersani, Antonella Cervellati, Monica Contoli, Elena Fabretti, Rosangela Fortunato, Cristina Marraccini, Monica Stevanin, Rosa Vasta, and Stefano Zagnoni (Rizzoli Institute, Bologna, Italy) for technical support.
Footnotes
Supported in part by Istituto Ortopedico Rizzoli Research Fund, Bologna, Italy.
References
- 1.Khoury J.D. Ewing sarcoma family of tumors. Adv Anat Pathol. 2005;12:212–220. doi: 10.1097/01.pap.0000175114.55541.52. [DOI] [PubMed] [Google Scholar]
- 2.Llombart-Bosch A. Small round cell tumors of bone and soft tissue: introduction. Semin Diagn Pathol. 1996;13:149–152. [PubMed] [Google Scholar]
- 3.Delattre O., Zucman J., Plougastel B., Desmaze C., Melot T., Peter M., Kovar H., Joubert I., de Jong P., Rouleau G., Aurias A., Thomas G. Gene fusion with an ETS DNA-binding domain caused by chromosome translocation in human tumours. Nature. 1992;359:162–165. doi: 10.1038/359162a0. [DOI] [PubMed] [Google Scholar]
- 4.Delattre O., Zucman J., Melot T., Garau X.S., Zucker J.M., Lenoir G.M., Ambros P.F., Sheer D., Turc-Carel C., Triche T.J., Aurias A., Thomas G. The Ewing family of tumors—a subgroup of small-round-cell tumors defined by specific chimeric transcripts. N Engl J Med. 1994;331:294–299. doi: 10.1056/NEJM199408043310503. [DOI] [PubMed] [Google Scholar]
- 5.O'Sullivan M.J., Perlman E.J., Furman J., Humphrey P.A., Dehner L.P., Pfeifer J.D. Visceral primitive peripheral neuroectodermal tumors: a clinicopathologic and molecular study. Hum Pathol. 2001;32:1109–1115. doi: 10.1053/hupa.2001.28247. [DOI] [PubMed] [Google Scholar]
- 6.Folpe A.L., Goldblum J.R., Rubin B.P., Shehata B.M., Liu W., Dei Tos A.P., Weiss S.W. Morphologic and immunophenotypic diversity in Ewing family tumors: a study of 66 genetically confirmed cases. Am J Surg Pathol. 2005;29:1025–1033. [PubMed] [Google Scholar]
- 7.Pinto A., Dickman P., Parham D. Pathobiologic markers of the Ewing sarcoma family of tumors: state of the art and prediction of behaviour. Sarcoma. 2011 doi: 10.1155/2011/856190. [Epub ahead of press] [DOI] [PMC free article] [PubMed] [Google Scholar]
- 8.Ushigome S., Machinami R., Sorensen P.H. Ewing sarcoma/primitive neuroectodermal tumour (PNET): Pathology and Genetics of Tumours of Soft Tissue and Bone. In: Fletcher C.D.M., Unni K.K., Mertens F., editors. World Health Organization Classification of Tumours 5. ed 2. IARC Press; Lyon: 2002. pp. 297–300. ch 14. [Google Scholar]
- 9.Llombart-Bosch A., Machado I., Navarro S., Bertoni F., Bacchini P., Alberghini M., Karzeladze A., Savelov N., Petrov S., Alvarado-Cabrero I., Mihaila D., Terrier P., Lopez-Guerrero J.A., Picci P. Histological heterogeneity of Ewing's sarcoma/PNET: an immunohistochemical analysis of 415 genetically confirmed cases with clinical support. Virchows Arch. 2009;455:397–411. doi: 10.1007/s00428-009-0842-7. [DOI] [PubMed] [Google Scholar]
- 10.Kaneko Y., Kobayashi H., Handa M., Satake N., Maseki N. EWS-ERG fusion transcript produced by chromosomal insertion in a Ewing sarcoma. Genes Chromosomes Cancer. 1997;18:228–231. [PubMed] [Google Scholar]
- 11.Peter M., Couturier J., Pacquement H., Michon J., Thomas G., Magdelenat H., Delattre O. A new member of the ETS family fused to EWS in Ewing tumors. Oncogene. 1997;14:1159–1164. doi: 10.1038/sj.onc.1200933. [DOI] [PubMed] [Google Scholar]
- 12.Jeon I.S., Davis J.N., Braun B.S., Sublett J.E., Roussel M.F., Denny C.T., Shapiro D.N. A variant Ewing's sarcoma translocation (7;22) fuses the EWS gene to the ETS gene ETV1. Oncogene. 1995;10:1229–1234. [PubMed] [Google Scholar]
- 13.Urano F., Umezawa A., Yabe H., Hong W., Yoshida K., Fujinaga K., Hata J. Molecular analysis of Ewing's sarcoma: another fusion gene: EWS-E1AF, available for diagnosis. Jpn J Cancer Res. 1998;89:703–711. doi: 10.1111/j.1349-7006.1998.tb03274.x. [DOI] [PMC free article] [PubMed] [Google Scholar]
- 14.Shing D.C., McMullan D.J., Roberts P., Smith K., Chin S.F., Nicholson J., Tillman R.M., Ramani P., Cullinane C., Coleman N. FUS/ERG gene fusions in Ewing's tumors. Cancer Res. 2003;63:4568–4576. [PubMed] [Google Scholar]
- 15.Berg T., Kalsaas A.H., Buechner J., Busund L.T. Ewing sarcoma-peripheral neuroectodermal tumor of the kidney with a FUS-ERG fusion transcript. Cancer Genet Cytogenet. 2009;194:53–57. doi: 10.1016/j.cancergencyto.2009.06.002. [DOI] [PubMed] [Google Scholar]
- 16.Ng T.L., O'Sullivan M.J., Pallen C.J., Hayes M., Clarkson P.W., Winstanley M., Sorensen P.H., Nielsen T.O., Horsman D.E. Ewing sarcoma with novel translocation t(2;16) producing an in-frame fusion of FUS and FEV. J Mol Diagn. 2007;9:459–463. doi: 10.2353/jmoldx.2007.070009. [DOI] [PMC free article] [PubMed] [Google Scholar]
- 17.Szuhai K., Ijszenga M., de Jong D., Karseladze A., Tanke H.J., Hogendoorn P.C. The NFATc2 gene is involved in a novel cloned translocation in a Ewing sarcoma variant that couples its function in immunology to oncology. Clin Cancer Res. 2009;15:2259–2268. doi: 10.1158/1078-0432.CCR-08-2184. [DOI] [PubMed] [Google Scholar]
- 18.Sumegi J., Nishio J., Nelson M., Frayer R.W., Perry D., Bridge J.A. A novel t(4;22)(q31;q12) produces an EWSR1-SMARCA5 fusion in extraskeletal Ewing sarcoma/primitive neuroectodermal tumor. Mod Pathol. 2010 doi: 10.1038/modpathol.2010.201. [Epub ahead of press] [DOI] [PubMed] [Google Scholar]
- 19.Grier H.E. The Ewing family of tumors: Ewing's sarcoma and primitive neuroectodermal tumors. Pediatr Clin North Am. 1997;44:991–1004. doi: 10.1016/s0031-3955(05)70541-1. [DOI] [PubMed] [Google Scholar]
- 20.Pohar-Marinsek Z. Difficulties in diagnosing small round cell tumours of childhood from fine needle aspiration cytology samples. Cytopathology. 2008;19:67–79. doi: 10.1111/j.1365-2303.2008.00555.x. [DOI] [PubMed] [Google Scholar]
- 21.Barr F.G., Chatten J., D'Cruz C.M., Wilson A.E., Nauta L.E., Nycum L.M., Biegel J.A., Womer R.B. Molecular assays for chromosomal translocations in the diagnosis of pediatric soft tissue sarcomas. JAMA. 1995;273:553–557. [PubMed] [Google Scholar]
- 22.Machado I., Noguera R., Pellin A., Lopez-Guerrero J.A., Piqueras M., Navarro S., Llombart-Bosch A. Molecular diagnosis of Ewing sarcoma family of tumors: a comparative analysis of 560 cases with FISH and RT-PCR. Diagn Mol Pathol. 2009;18:189–199. doi: 10.1097/PDM.0b013e3181a06f66. [DOI] [PubMed] [Google Scholar]
- 23.Mangham D.C., Williams A., McMullan D.J., McClure J., Sumathi V.P., Grimer R.J., Davies A.M. Ewing's sarcoma of bone: the detection of specific transcripts in a large, consecutive series of formalin-fixed, decalcified, paraffin-embedded tissue samples using the reverse transcriptase-polymerase chain reaction. Histopathology. 2006;48:363–376. doi: 10.1111/j.1365-2559.2006.02318.x. [DOI] [PubMed] [Google Scholar]
- 24.Qian X., Jin L., Shearer B.M., Ketterling R.P., Jalal S.M., Lloyd R.V. Molecular diagnosis of Ewing's sarcoma/primitive neuroectodermal tumor in formalin-fixed paraffin-embedded tissues by RT-PCR and fluorescence in situ hybridization. Diagn Mol Pathol. 2005;14:23–28. doi: 10.1097/01.pdm.0000140192.27878.97. [DOI] [PubMed] [Google Scholar]
- 25.Yoshino N., Kojima T., Asami S., Motohashi S., Yoshida Y., Chin M., Shichino H., Nemoto N., Kaneko M., Mugishima H., Suzuki T. Diagnostic significance and clinical applications of chimeric genes in Ewing's sarcoma. Biol Pharm Bull. 2003;26:585–588. doi: 10.1248/bpb.26.585. [DOI] [PubMed] [Google Scholar]
- 26.Kojima T., Asami S., Chin M., Yoshida Y., Mugishima H., Suzuki T. Detection of chimeric genes in Ewing's sarcoma and its clinical applications. Biol Pharm Bull. 2002;25:991–994. doi: 10.1248/bpb.25.991. [DOI] [PubMed] [Google Scholar]
- 27.Sun Y., Gao D., Liu Y., Huang J., Lessnick S., Tanaka S. IGF2 is critical for tumorigenesis by synovial sarcoma oncoprotein SYT-SSX1. Oncogene. 2006;25:1042–1052. doi: 10.1038/sj.onc.1209143. [DOI] [PubMed] [Google Scholar]
- 28.Antonescu C.R., Elahi A., Healey J.H., Brennan M.F., Lui M.Y., Lewis J., Jhanwar S.C., Woodruff J.M., Ladanyi M. Monoclonality of multifocal myxoid liposarcoma: confirmation by analysis of TLS-CHOP or EWS-CHOP rearrangements. Clin Cancer Res. 2000;6:2788–2793. [PubMed] [Google Scholar]
- 29.Bourgeois J.M., Knezevich S.R., Mathers J.A., Sorensen P.H. Molecular detection of the ETV6-NTRK3 gene fusion differentiates congenital fibrosarcoma from other childhood spindle cell tumors. Am J Surg Pathol. 2000;24:937–946. doi: 10.1097/00000478-200007000-00005. [DOI] [PubMed] [Google Scholar]
- 30.Murphy A.J., Bishop K., Pereira C., Chilton-MacNeill S., Ho M., Zielenska M., Thorner P.S. A new molecular variant of desmoplastic small round cell tumor: significance of WT1 immunostaining in this entity. Hum Pathol. 2008;39:1763–1770. doi: 10.1016/j.humpath.2008.04.019. [DOI] [PubMed] [Google Scholar]
- 31.Cerveira N., Torres L., Ribeiro F.R., Henrique R., Pinto A., Bizarro S., Ferreira A.M., Lopes C., Teixeira M.R. Multimodal genetic diagnosis of solid variant alveolar rhabdomyosarcoma. Cancer Genet Cytogenet. 2005;163:138–143. doi: 10.1016/j.cancergencyto.2005.06.020. [DOI] [PubMed] [Google Scholar]
- 32.Gautam U., Srinivasan R., Rajwanshi A., Bansal D., Marwaha R.K., Vasishtha R.K. Reverse transcriptase-polymerase chain reaction as an ancillary molecular technique in the diagnosis of small blue round cell tumors by fine-needle aspiration cytology. Am J Clin Pathol. 2010;133:633–645. doi: 10.1309/AJCPPJJ0PY4XZOEC. [DOI] [PubMed] [Google Scholar]
- 33.Zucman J., Melot T., Desmaze C., Ghysdael J., Plougastel B., Peter M., Zucker J.M., Triche T.J., Sheer D., Turc-Carel C., Ambros P., Combaret V., Lenoir G., Aurias A., Thomas G., Delattre O. Combinatorial generation of variable fusion proteins in the Ewing family of tumours. EMBO J. 1993;12:4481–4487. doi: 10.1002/j.1460-2075.1993.tb06137.x. [DOI] [PMC free article] [PubMed] [Google Scholar]
- 34.Giovannini M., Biegel J.A., Serra M., Wang J.Y., Wei Y.H., Nycum L., Emanuel B.S., Evans G.A. EWS-erg and EWS-Fli1 fusion transcripts in Ewing's sarcoma and primitive neuroectodermal tumors with variant translocations. J Clin Invest. 1994;94:489–496. doi: 10.1172/JCI117360. [DOI] [PMC free article] [PubMed] [Google Scholar]
- 35.Obata K., Hiraga H., Nojima T., Yoshida M.C., Abe S. Molecular characterization of the genomic breakpoint junction in a t(11;22) translocation in Ewing sarcoma. Genes Chromosomes Cancer. 1999;25:6–15. [PubMed] [Google Scholar]
- 36.Ramani P., Rampling D., Link M. Immunocytochemical study of 12E7 in small round-cell tumours of childhood: an assessment of its sensitivity and specificity. Histopathology. 1993;23:557–561. doi: 10.1111/j.1365-2559.1993.tb01243.x. [DOI] [PubMed] [Google Scholar]
- 37.Folpe A.L., Hill C.E., Parham D.M., O'Shea P.A., Weiss S.W. Immunohistochemical detection of FLI-1 protein expression: a study of 132 round cell tumors with emphasis on CD99-positive mimics of Ewing's sarcoma/primitive neuroectodermal tumor. Am J Surg Pathol. 2000;24:1657–1662. doi: 10.1097/00000478-200012000-00010. [DOI] [PubMed] [Google Scholar]
- 38.Balamuth N.J., Womer R.B. Ewing's sarcoma. Lancet Oncol. 2010;11:184–192. doi: 10.1016/S1470-2045(09)70286-4. [DOI] [PubMed] [Google Scholar]
- 39.Burchill S.A. Ewing's sarcoma: diagnostic, prognostic, and therapeutic implications of molecular abnormalities. J Clin Pathol. 2003;56:96–102. doi: 10.1136/jcp.56.2.96. [DOI] [PMC free article] [PubMed] [Google Scholar]
- 40.Wang L., Bhargava R., Zheng T., Wexler L., Collins M.H., Roulston D., Ladanyi M. Undifferentiated small round cell sarcomas with rare EWS gene fusions: identification of a novel EWS-SP3 fusion and of additional cases with the EWS-ETV1 and EWS-FEV fusions. J Mol Diagn. 2007;9:498–509. doi: 10.2353/jmoldx.2007.070053. [DOI] [PMC free article] [PubMed] [Google Scholar]
- 41.Lee J., Hopcus-Niccum D.J., Mulvihill J.J., Li S. Cytogenetic and molecular cytogenetic studies of a variant of t(21;22), ins(22;21)(q12;q21q22), with a deletion of the 3′ EWSR1 gene in a patient with Ewing sarcoma. Cancer Genet Cytogenet. 2005;159:177–180. doi: 10.1016/j.cancergencyto.2004.11.003. [DOI] [PubMed] [Google Scholar]
- 42.Zoubek A., Pfleiderer C., Salzer-Kuntschik M., Amann G., Windhager R., Fink F.M., Koscielniak E., Delattre O., Strehl S., Ambros P.F., Gadner H., Kovar H. Variability of EWS chimaeric transcripts in Ewing tumours: a comparison of clinical and molecular data. Br J Cancer. 1994;70:908–913. doi: 10.1038/bjc.1994.419. [DOI] [PMC free article] [PubMed] [Google Scholar]
- 43.Plougastel B., Zucman J., Peter M., Thomas G., Delattre O. Genomic structure of the EWS gene and its relationship to EWSR1, a site of tumor-associated chromosome translocation. Genomics. 1993;18:609–615. doi: 10.1016/s0888-7543(05)80363-5. [DOI] [PubMed] [Google Scholar]
- 44.Zoubek A., Dockhorn-Dworniczak B., Delattre O., Christiansen H., Niggli F., Gatterer-Menz I., Smith T.L., Jurgens H., Gadner H., Kovar H. Does expression of different EWS chimeric transcripts define clinically distinct risk groups of Ewing tumor patients? J Clin Oncol. 1996;14:1245–1251. doi: 10.1200/JCO.1996.14.4.1245. [DOI] [PubMed] [Google Scholar]
- 45.Barr F.G., Womer R.B. Molecular diagnosis of Ewing family tumors: too many fusions? J Mol Diagn. 2007;9:437–440. doi: 10.2353/jmoldx.2007.070080. [DOI] [PMC free article] [PubMed] [Google Scholar]
- 46.Barr F.G., Meyer W.H. Role of fusion subtype in Ewing sarcoma. J Clin Oncol. 2010;28:1973–1974. doi: 10.1200/JCO.2009.27.2161. [DOI] [PubMed] [Google Scholar]
- 47.Bhagirath T., Abe S., Nojima T., Yoshida M.C. Molecular analysis of a t(11;22) translocation junction in a case of Ewing's sarcoma. Genes Chromosomes Cancer. 1995;13:126–132. doi: 10.1002/gcc.2870130209. [DOI] [PubMed] [Google Scholar]
- 48.Ida K., Kobayashi S., Taki T., Hanada R., Bessho F., Yamamori S., Sugimoto T., Ohki M., Hayashi Y. EWS-FLI-1 and EWS-ERG chimeric mRNAs in Ewing's sarcoma and primitive neuroectodermal tumor. Int J Cancer. 1995;63:500–504. doi: 10.1002/ijc.2910630407. [DOI] [PubMed] [Google Scholar]
- 49.Hisaoka M., Tsuji S., Morimitsu Y., Hashimoto H., Shimajiri S., Komiya S., Ushijima M. Molecular detection of EWS-FLI1 chimeric transcripts in Ewing family tumors by nested reverse transcription-polymerase chain reaction: application to archival paraffin-embedded tumor tissues. APMIS. 1999;107:577–584. doi: 10.1111/j.1699-0463.1999.tb01595.x. [DOI] [PubMed] [Google Scholar]
- 50.Dunn T., Praissman L., Hagag N., Viola M.V. ERG gene is translocated in an Ewing's sarcoma cell line. Cancer Genet Cytogenet. 1994;76:19–22. doi: 10.1016/0165-4608(94)90063-9. [DOI] [PubMed] [Google Scholar]
- 51.Selleri L., Giovannini M., Romo A., Zucman J., Delattre O., Thomas G., Evans G.A. Cloning of the entire FLI1 gene, disrupted by the Ewing's sarcoma translocation breakpoint on 11q24, in a yeast artificial chromosome. Cytogenet Cell Genet. 1994;67:129–136. doi: 10.1159/000133813. [DOI] [PubMed] [Google Scholar]
- 52.Dockhorn-Dworniczak B., Schäfer K.L., Dantcheva R., Blasius S., van Valen F., Burdach S., Winkelmann W., Jürgens J., Böcker W. [Detection of EWS-/FLI-1 gene fusion transcripts by RT-PCR as a tool in the diagnosis of tumors of the Ewing sarcoma group] German. Verh Dtsch Ges Pathol. 1994;78:214–219. [PubMed] [Google Scholar]
- 53.Kovar H., Jugovic D., Melot T., Zoubek A., Lenoir G., Fink F.M., Philip I., Turc-Carel C., Thomas G., Zucman-Rossi J. Cryptic exons as a source of increased diversity of Ewing tumor-associated EWS-FLI1 chimeric products. Genomics. 1999;60:371–374. doi: 10.1006/geno.1999.5919. [DOI] [PubMed] [Google Scholar]
- 54.Mastrangelo T., Modena P., Tornielli S., Bullrich F., Testi M.A., Mezzelani A., Radice P., Azzarelli A., Pilotti S., Croce C.M., Pierotti M.A., Sozzi G. A novel zinc finger gene is fused to EWS in small round cell tumor. Oncogene. 2000;19:3799–3804. doi: 10.1038/sj.onc.1203762. [DOI] [PubMed] [Google Scholar]
- 55.Noguera R., Pellin A., Navarro S., Carda C., Llombart-Bosch A. Translocation (10;11:22)(p14;q24;q12) characterized by fluorescence in situ hybridization in a case of Ewing's tumor. Diagn Mol Pathol. 2001;10:2–8. doi: 10.1097/00019606-200103000-00002. [DOI] [PubMed] [Google Scholar]
- 56.Sorensen P.H., Triche T.J. Gene fusions encoding chimaeric transcription factors in solid tumours. Semin Cancer Biol. 1996;7:3–14. doi: 10.1006/scbi.1996.0002. [DOI] [PubMed] [Google Scholar]
- 57.de Alava E., Kawai A., Healey J.H., Fligman I., Meyers P.A., Huvos A.G., Gerald W.L., Jhanwar S.C., Argani P., Antonescu C.R., Pardo-Mindan F.J., Ginsberg J., Womer R., Lawlor E.R., Wunder J., Andrulis I., Sorensen P.H., Barr F.G., Ladanyi M. EWS-FLI1 fusion transcript structure is an independent determinant of prognosis in Ewing's sarcoma. J Clin Oncol. 1998;16:1248–1255. doi: 10.1200/JCO.1998.16.4.1248. [Erratum appeared in J Clin Oncol 1998, 16:2895] [DOI] [PubMed] [Google Scholar]
- 58.van Doorninck J.A., Ji L., Schaub B., Shimada H., Wing M.R., Krailo M.D., Lessnick S.L., Marina N., Triche T.J., Sposto R., Womer R.B., Lawlor E.R. Current treatment protocols have eliminated the prognostic advantage of type 1 fusions in Ewing sarcoma: a report from the Children's Oncology Group. J Clin Oncol. 2010;28:1989–1994. doi: 10.1200/JCO.2009.24.5845. [DOI] [PMC free article] [PubMed] [Google Scholar]
- 59.Le Deley M.C., Delattre O., Schaefer K.L., Burchill S.A., Koehler G., Hogendoorn P.C., Lion T., Poremba C., Marandet J., Ballet S., Pierron G., Brownhill S.C., Nesslböck M., Ranft A., Dirksen U., Oberlin O., Lewis I.J., Craft A.W., Jürgens H., Kovar H. Impact of EWS-ETS fusion type on disease progression in Ewing's sarcoma/peripheral primitive neuroectodermal tumor: prospective results from the Cooperative Euro-E.W.I.N.G. 99 Trial. J Clin Oncol. 2010;28:1982–1988. doi: 10.1200/JCO.2009.23.3585. [DOI] [PubMed] [Google Scholar]
- 60.Picci P., Böhling T., Bacci G., Ferrari S., Sangiorgi L., Mercuri M., Ruggieri P., Manfrini M., Ferraro A., Casadei R., Benassi M.S., Mancini A.F., Rosito P., Cazzola A., Barbieri E., Tienghi A., Brach del Prever A., Comandone A., Bacchini P., Bertoni F. Chemotherapy-induced tumor necrosis as a prognostic factor in localized Ewing's sarcoma of the extremities. J Clin Oncol. 1997;15:1553–1559. doi: 10.1200/JCO.1997.15.4.1553. [DOI] [PubMed] [Google Scholar]
- 61.Bacci G., Ferrari S., Longhi A., Donati D., De Paolis M., Forni C., Versari M., Setola E., Briccoli A., Barbieri E. Therapy and survival after recurrence of Ewing's tumors: the Rizzoli experience in 195 patients treated with adjuvant and neoadjuvant chemotherapy from 1979 to 1997. Ann Oncol. 2003;14:1654–1659. doi: 10.1093/annonc/mdg457. [DOI] [PubMed] [Google Scholar]
- 62.Bacci G., Mercuri M., Longhi A., Bertoni F., Barbieri E., Donati D., Giacomini S., Bacchini P., Pignotti E., Forni C., Ferrari S. Neoadjuvant chemotherapy for Ewing's tumour of bone: recent experience at the Rizzoli Orthopaedic Institute. Eur J Cancer. 2002;38:2243–2251. doi: 10.1016/s0959-8049(02)00148-x. [DOI] [PubMed] [Google Scholar]