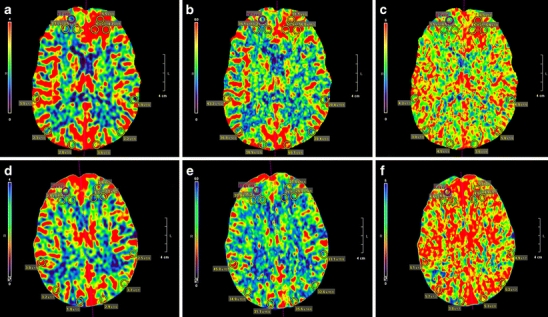
Fig. 1.

Three ROIs measuring 8 mm in diameter and 0.5 mm thickness were placed 3 mm apart in a triangular pattern within the affected hemisphere and mirrored in the unaffected hemisphere (case 1 in the upper row; a, b, c). An identical ROI template was used for each control (control 1 in lower row d, e, f) to facilitate comparisons of absolute values and relative CTP percentages for regional CBV (a, d), regional CBF (b, e), and MTT (c, f)
