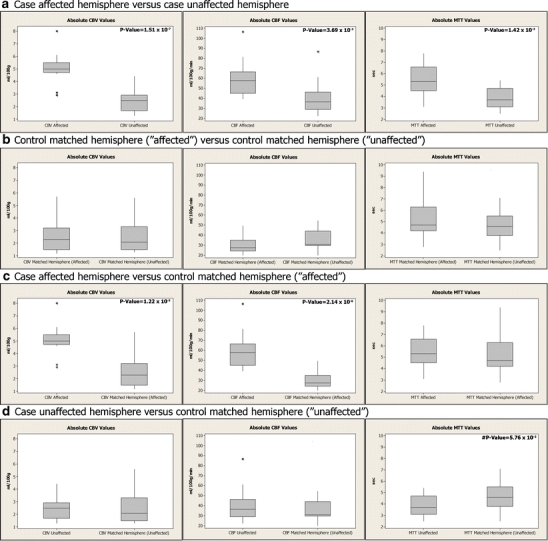
Fig. 2.

Box plots of absolute hemispheric values for three ROIs of CBV, CBF, and MTT for each case and control group included: a case-affected hemisphere versus case-unaffected hemisphere, b control-matched affected versus control-matched hemisphere unaffected, (c) case-affected versus control affected, and (d) case-unaffected versus control unaffected. Outlier values (asterisk) are depicted in the CTP parameter group as applicable. Significant p values are listed in the upper right corners and near statistical significance is preceded by a pound sign
