

Abstract
A database of thermodynamic properties is developed, which extends a previous database of glycolysis and tricarboxylic acid cycle by adding the reactions of the pentose phosphate pathway. The raw data and documented estimations of solution properties are made electronically available. The database is determined by estimation of a set of parameters representing species-level free energies of formation. The resulting calculations provide thermodynamic and network-based estimates of thermodynamic properties for six reactions of the pentose phosphate pathway for which estimates are not available in the preexisting literature. Optimized results are made available in ThermoML format. Because calculations depend on estimated hydrogen and metal cation dissociation constants, an uncertainty and sensitivity analysis is performed, revealing 23 critical dissociation constants to which the computed thermodynamic properties are particularly sensitive.
Database URL: http://www.biocoda.org/thermo
Introduction
Reliable and self-consistent databases of thermodynamic properties for biochemical reactions are necessary for accurate analysis of biochemical systems (1–6). A recently developed database of thermodynamic properties for the reactions of glycolysis and the tricarboxylic acid cycle that was constituted from measured equilibrium data (7) represents a refinement to the Alberty database (8) in that it accounts for the ionic strength and interactions of biochemical reactants and metal cations (Mg2+, Ca2+, Na+ and K+) in estimating the derived properties from the raw data. The database of Li et al. (7) is a framework that can be extended and refined by adding the underlying raw experimental data in the database and/or refining the underlying model assumptions. Here an updated database is developed by adding the reactions of the pentose phosphate pathway into the original database.
As in Li et al. (7), thermodynamic properties (reference  and
and  ) values are estimated by minimizing the difference between model predictions and experimental data. Apparent equilibrium constants for biochemical reactions are estimated by these derived thermodynamic properties and compared to experimental data measured under non-standard conditions. The basic formulae described in Li et al. (7) are used here, which account for temperature, ionic interactions and ion binding (8–13) effects to convert standard-state reference quantities to experimental state quantities.
Input data
Database of measured equilibrium constants
Raw experimental data are obtained from original reports (14–19). As in Li et al. (7), we preferentially select studies rated as A- and B-quality by Goldberg et al. (20–22). Free cation concentrations and ionic strength associated with these original studies are estimated based on the conditions reported in the original sources. All data and calculations are explicitly documented in the database. As we have previously established (7), each measurement entry in the raw-data database provides the following information: (i) enzyme name (EC number); (ii) experimental temperature, pH, ionic strength, apparent equilibrium constant, free metal cation concentrations, buffer and experimental method; (iii) quality rating from Goldberg et al. (20–22); (iv) notes on experiments and strategies of estimations and approximations applied in calculations; and (v) reference information. Up-to-date versions of the experimental database are made available at the URL http://www.biocoda.org/thermo, or by contacting the authors.
Database of reactions and estimated standard reaction enthalpies
There are eight reactions in the pentose phosphate pathway: glucose 6-phosphate dehydrogenase (EC 1.1.1.49, G6PD), 6-phosphogluconolactonase (EC 3.1.1.31, PGL), 6-phosphogluconate dehydrogenase (EC 1.1.1.44, PGD), ribose-5-phosphate isomerase (EC 5.3.1.6, R5PI), ribulose-phosphate 3-epimerase (EC 5.1.3.1, RUPE), transketolase (EC 2.2.1.1, TKL), transaldolase (EC 2.2.1.2, TAL) and transketolase 2 (EC 2.2.1.1, TKL2). The first three reactions are the oxidative pentose phosphate pathway, and the rest are the reductive pentose phosphate pathway (23). After adding these reactions into our original database, there are 33 reactions in total, which are shown in the Table 1 (first 33 reactions). Table 1 lists EC numbers, reaction names and the abbreviations employed, the reference reaction stoichiometries, and estimated standard reaction enthalpies at T = 298.15 K, I = 0 M. In the reference reaction, a superscript is used to indicate the charge of chemical species. For example, the abbreviation for references species for glucose (GLC0) is distinguished from the abbreviation for the biochemical reactant GLC.
Table 1.
Reactions with standard reaction enthalpies  estimated for I = 0
| EC No. | Reaction name | Reaction abbreviation | Reference reaction |
 (kJ/mol) (kJ/mol) |
|---|---|---|---|---|
| EC 2.7.1.1 | Glucokinase | GLK | GLC0 + ATP4− = G6P2− + ADP3− + H+ | −23.8a |
| EC 5.3.1.9 | Phosphoglucose isomerase | PGI | G6P2− = F6P2− | 11.53b |
| EC 2.7.1.11 | Phosphofructokinase | PFK | F6P2− + ATP4− = F16P4− + ADP3− + H+ | −9.5c |
| EC 4.1.2.13 | Fructose-1,6-biphosphatate aldolase | FBA | F16P4− = DHAP2− + GAP2− | 48.97b |
| EC 5.3.1.1 | Triosphosphate isomerase | TPI | GAP2− = DHAP2− | 2.73d |
| EC 4.1.2.13 | Fructose-1,6-biphosphatate aldolase 2 | FBA2 | F16P4− = 2DHAP2− | 51.70b |
| EC 1.2.1.12 | Glyceraldyde-3-P dehydrogenase | GAP | GAP2− + HPO42− + NADox− = BPG4− + NADred2− + H+ | #e |
| EC 2.7.2.3 | Phosphoglycerate kinase | PGK | GAP2− + HPO42− + NADox− + ADP3− = PG33− + NADred2− + ATP4− + H+ | #e |
| EC 5.4.2.1 | Phosphoglycerate mutase | PGYM | PG23− = PG33− | 28.05b |
| EC 4.2.1.11 | Enolase | ENO | PG23− = PEP3− + H2O0 | 15.1b |
| EC 2.7.1.40 | Pyruvate kinase | PYK | PYR− + ATP4− = PEP3− + ADP3− + H+ | 5.415a |
| EC 4.1.3.7 | Citrate synthase | CITS | OAA2− + ACoA0 + H2O0 = CIT3− + COAS− + 2H+ | #e |
| EC 4.2.1.3 | Aconitrate hydratese | ACON | ISCIT3− = CIT3− | −20.0b |
| EC 1.1.1.42 | Isocitrate dehydrogenase | IDH | ISCIT3− + NADPox3− + H2O0 = AKG2− + NADPred4− + CO32− + 2H+ | −22.17b |
| EC 6.2.1.4 | Auccinate-CoA ligase | SCS | GTP4- + SUC2− + COAS− + H+ = GDP3− + HPO42− + SUCCoA− | −30.9b |
| EC 4.2.1.2 | Fumarate hydratase | FUM | FUM2− + H2O0 = MAL2− | −13.18b |
| EC 1.1.1.37 | Malate dehydrogenase | MDH | MAL2− + NADox− = OAA2− + NADred2− + H+ | 51.29b |
| EC 2.7.4.6 | Nucleoside-diphosphate kinase | NDK | ATP4− + GDP3− = ADP3− + GTP4− | #e |
| EC 1.6.1.1 | NADP transhydrogenase | NPTH | NADox− + NADPred4− = NADred2− + NADPox3− | −4.1c |
| EC 1.1.1.40 | Malic enzyme | MLE | MAL2− + NADPox3− + H2O0 = PYR− + NADPred4− + CO32- + 2H+ | #e |
| EC 1.1.1.37 | Malate dehydrogenase 2 | MDH2 | MAL2− + ACoA0 + NADox− + H2O0 = CIT3− + COAS− + NADred2− + 3H+ | #e |
| EC 2.7.1.23 | NAD+ kinase | NADK | ATP4− + NADox− = ADP3− + NADPox3− + H+ | #e |
| EC 3.6.1.32 | ATPase | ATPS | ATP4− + H2O0 = ADP3− + HPO42− + H+ | −20.5a |
| EC 3.1.3.1 | Alkaline phosphatase/G6P hydrolysis | G6PH | G6P2− + H2O0 = GLC0 + Pi2− | 0.91a |
| EC 6.4.1.1 | Pyruvate carboxylase | PCL | PYR− + ATP4− + CO32− = OAA2− + ADP3− + Pi2− | #e |
| EC 1.1.1.49 | Glucose 6-phosphate dehydrogenase | G6PD | G6P2− + NADPox3− = PGLT2− + NADPred4− + H+ | #e |
| EC 3.1.1.31 | 6-Phosphogluconolactonase | PGL | G6P2− + NADPox3− + H2O0 = PGN3− + NADPred4− + 2H+ | #e |
| EC 1.1.1.44 | 6-Phosphogluconate dehydrogenase | PGD | PGN3− + NADPox3− + H2O0 = RU5P2− + NADPred4− + CO32− + 2H+ | 37.47b |
| EC 5.3.1.6 | Ribose-5-phosphate isomerase | R5PI | R5P2− = RU5P2− | 12.86b |
| EC 5.1.3.1 | Ribulose-phosphate 3-epimerase | RUPE | RU5P2− = X5P2− | #e |
| EC 2.2.1.1 | Transketolase | TKL | S7P2− + GAP2− = R5P2− + X5P2− | #e |
| EC 2.2.1.2 | Transaldolase | TAL | S7P2− + GAP2− = E4P2− + F6P2− | #e |
| EC 2.2.1.1 | Transketolase 2 | TKL2 | F6P2− + GAP2− = E4P2− + X5P2− | #e |
| EC 1.2.4.1+EC 2.3.1.12+EC 1.8.1.4 | Pyruvate dehydrogenase complex | PDH | PYR− + COAS− + NADox− + H2O = CO32− + ACoA0 + NADred2− + H+ | #e |
| EC 1.1.1.41 | Isocitrate dehydrogenase | IDH2 | ISCIT3− + NADox− + H2O0 = AKG2- + NADred2− + CO32− + 2H+ | −26.27d |
| EC 1.2.1.52 | α-Ketoglutarate dehydrogenase | AKGDH | AKG2− + NADox− + COAS− + H2O0 = SUCCoA− + NADred2− + CO32- + H+ | #e |
| EC 1.3.5.1 | Succinate dehydrogenase | SDH | SUC2− + CoQ0 = FUM2− + CoQH20 | #e |
Reaction enthalpies ( ) for two reactions in the pentose phosphate pathway (PGD and R5PI) can be estimated using van't Hoff equation because data on apparent equilibrium constants at different temperatures are available. Neither equilibrium data at different temperatures nor prior values of
  are available for the other six reactions of the pentose phosphate pathway; hence the symbol ‘#’ is used to denote the absence of data. For these cases, the value is set to zero in further calculations.
Database of reactant and dissociation constants
There are seven reactants introduced to the reactant database by adding the pentose phosphate pathway into the thermodynamic database: erythrose 4-phosphate (E4P), 6-phosphoglucono-δ-lactone (PGLT), 6-phospho-d-gluconate (PGN), ribose 5-phosphate (R5P), ribulose 5-phosphate (RU5P), sedoheptulose 7-phosphate (S7P) and xylulose 5-phosphate (X5P). For the five sugar phosphates (E4P, R5P, RU5P, S7P and X5P), cation dissociation constants for only R5P can be found in NIST database. Since E4P, RU5P, S7P and X5P are structurally similar substances to R5P (all have similar near neighbors to the phosphate group), a pragmatic approach to estimate the necessary dissociation constants is to use the values for R5P (24). Specifically, E4P, RU5P, S7P and X5P are assumed to have dissociation properties equal to those for R5P in our calculations. For PGLT, we use the pKH1 value of 5.99 from Alberty (10). For PGN, Casazza et al. (15) report that the hydrogen ion dissociation constant for the carboxylic acid is >1.0E-4, while the constant for the phosphate ester is the same as that of glucose 6-P [pKH1 = 5.99 (10)]. Here we arbitrarily assign the value of 4.995 to the pKH1 for PGN, which is the average of 4 and 5.99. The uncertainties of these assignments are considered in the uncertainty and sensitivity analysis below.
Basic thermodynamic and ion binding data for biochemical reactants and associated reference species are listed in Table 2. Each entry in the table contains the following information: (i) detailed name of reactant; (ii) reference species abbreviation; (iii) reactant abbreviation; (iv) number of protons in reference species; and (v) the dissociation constants (provided as pK) and the corresponding dissociation enthalpies  Dissociation constants and enthalpies are tabulated at 298.15 K and 0.1 M ionic strength. The symbol ‘#’ is used to indicate absence of data. For these cases, the pK's are assumed to be infinite (no binding) with corresponding dissociation constants equal to zero. In the calculations, all the pK and
  values are adjusted to a common reference state of T = 298.15 K and I = 0.
Table 2.
Reactant databasea
| Reactant | Reference species abbreviationb | Reactant abbreviation | NHb | pKH1 |  |
pKH2 |  |
pKMg1 |  |
pKHMg |  |
pKMg2 |  |
pKK1 |  |
pKNa1 |  |
pKHNa |  |
pKCa1 |  |
pKHCa |  |
|---|---|---|---|---|---|---|---|---|---|---|---|---|---|---|---|---|---|---|---|---|---|---|---|
| Acetyl-coenzyme A | ACoA0 | ACoA | 3 | # | # | # | # | # | # | # | # | # | # | # | # | # | # | # | # | # | # | # | # |
| Adenosine diphosphate | ADP3− | ADP | 12 | 6.496 | −2 | 3.87 | 16 | 3.3 | −15 | 1.59 | −7.5 | 1.27 | −11.76 | 1 | # | 1.12 | # | # | # | 2.86 | −9.6 | 1.48 | −6.2 |
| Adenosine triphosphate | ATP4− | ATP | 12 | 6.71 | −2 | 3.99 | 15 | 4.28 | −18 | 2.32 | −9.6 | 1.7 | −17.52 | 1.17 | −1 | 1.31 | 0.8 | # | # | 3.95 | −13 | 2.16 | −7.9 |
| 1,3-Bisphosphoglycerate | BPG4− | BPG | 4 | 7.1c | # | # | # | # | # | # | # | # | # | # | # | # | # | # | # | # | # | # | # |
| Citrate | CIT3− | CIT | 5 | 5.67 | −1.9 | 4.35 | 3.1 | 3.517 | −8 | 1.8 | # | # | # | 0.6 | −3.54 | 0.75 | −1 | # | # | 3.54 | −1.2 | 2.07 | # |
| Coenzyme A-SH | COAS− | COAS | 0 | 8.17c | # | # | # | # | # | # | # | # | # | # | # | # | # | # | # | # | # | # | # |
| Carbon dioxide (total) | CO32− | CO2_tot | 0 | 9.9c | 16.1c | 6.15c | 8.27c | # | # | # | # | # | # | # | # | # | # | # | # | # | # | # | # |
| Dihydroxyacetone phosphate | DHAP2− | DHAP | 5 | 5.9 | # | # | # | 1.57 | # | # | # | # | # | # | # | # | # | # | # | 1.38 | # | # | # |
| d-fructose 6-phosphate | F6P2− | F6P | 11 | 5.89 | −0.559d | 1.1 | # | 1.74e | −9.72d | # | # | # | # | # | # | # | # | # | # | # | # | # | # |
| d-fructose 1,6-phosphate | F16P4− | F16P | 10 | 6.64 | # | 5.92 | # | 2.7 | # | 2.12 | # | # | # | # | # | # | # | # | # | # | # | # | # |
| Fumarate | FUM2− | FUM | 2 | 4.09 | −1.56 | 2.86 | 1.08 | # | # | # | # | # | # | # | # | # | # | # | # | 0.6 | −6.44 | # | # |
| d-glucose 6-phosphate | G6P2− | G6P | 11 | 5.89e | −0.559d | # | # | 1.74b | −9.72d | # | # | # | # | # | # | # | # | # | # | # | # | # | # |
| d-glyceraldehyde 3-phosphate | GAP2− | GAP | 5 | 5.27c | # | # | # | # | # | # | # | # | # | # | # | # | # | # | # | # | # | # | # |
| Guanosine diphosphate | GDP3− | GDP | 12 | 6.505 | −2.14 | 2.8 | # | 3.4 | −7.1 | # | # | # | # | # | # | # | # | # | # | # | # | # | # |
| d-glucose | GLC0 | GLC | 12 | # | # | # | # | # | # | # | # | # | # | # | # | # | # | # | # | # | # | # | # |
| Guanosine triphosphate | GTP4− | GTP | 12 | 6.63 | −3 | 2.93 | 7.1 | 4.31 | −17 | 2.31 | # | # | # | # | # | # | # | # | # | 3.7 | # | # | # |
| Water | H2O0 | H2O | 2 | # | # | # | # | # | # | # | # | # | # | # | # | # | # | # | # | # | # | # | # |
| Isocitrate | ISCIT3− | ISCIT | 5 | 5.765 | # | 4.29 | # | 2.625 | # | 1.43 | # | # | # | # | # | # | # | # | # | 2.54 | # | # | # |
| α-Ketoglutarate | AKG2− | AKG | 4 | # | # | # | # | # | # | # | # | # | # | # | # | # | # | # | # | # | # | # | # |
| Malate | MAL2− | MAL | 4 | 4.715 | −0.58 | 3.265 | 3.4 | 1.71 | −6.16 | 0.9f | # | # | # | 0.18 | −2.86 | 0.28 | 0.4 | # | # | 2.005 | −1.06 | 1.06 | 8 |
| NADox | NADox− | NADox | 26 | # | # | # | # | # | # | # | # | # | # | # | # | # | # | # | # | # | # | # | # |
| NADred | NADred2− | NADred | 27 | # | # | # | # | # | # | # | # | # | # | # | # | # | # | # | # | # | # | # | # |
| NADPox | NADPox3− | NADPox | 25 | 6.255k | # | 3.874k | # | # | # | # | # | # | # | # | # | # | # | # | # | # | # | # | # |
| NADPred | NADPred4− | NADPred | 26 | 6.255l | # | 3.874l | # | # | # | # | # | # | # | # | # | # | # | # | # | # | # | # | # |
| Oxaloacetate | OAA2− | OAA | 2 | 3.9 | 5.24 | 2.26 | 16.62 | 1.02 | # | # | # | # | # | # | # | # | # | # | # | 1.6 | # | # | # |
| Orthophosphate | HPO42− | Pi | 1 | 6.78 | 4.6 | 1.945 | −8.7 | 1.823 | −9.518 | 0.669 | # | # | # | 0.5 | # | 0.61 | # | 0.0856 | # | 1.745 | −9.518 | 0.921 | −10.759 |
| 2-Phospho-d-glycerate | PG23− | PG2 | 4 | 7 | # | 3.55 | # | 2.45 | # | # | # | # | # | 1.18 | # | # | # | # | # | # | # | # | # |
| 3-Phospho-d-glycerate | PG33− | PG3 | 4 | 6.89c | # | 3.64g | # | 2.21h | # | # | # | # | # | 0.87 h | # | # | # | # | # | # | # | # | # |
| Phosphoenolpyruvate | PEP3− | PEP | 2 | 6.245 | # | 3.45 | # | 2.26 | # | # | # | # | # | 1.08 | # | # | # | # | # | # | # | # | # |
| Pyruvate | PYR− | PYR | 3 | 2.26 | 12.8 | # | # | 1.1 | # | # | # | # | # | # | # | # | # | # | # | 0.8 | # | # | # |
| Succinate | SUC2− | SUC | 4 | 5.275 | 0.41 | 4.02 | 3 | 1.355 | # | 0.62 | # | # | # | 0.43 | −2.76 | 0.4212 | −2.759 | # | # | 1.405 | −8.939 | 0.65 | −8 |
| Succinyl-CoA | SUCCoA− | SUCCoA | 4 | 3.99c | # | # | # | # | # | # | # | # | # | # | # | # | # | # | # | # | # | # | # |
| Erythrose 4-phosphate | E4P2− | E4P | 9 | 6.255i | −9.75i | 2i | # | 1.58i | −9.71i | # | # | # | # | # | # | # | # | # | # | 1.48i | # | # | # |
| 6-Phosphoglucono-δ-lactone | PGLT2− | PGLT | 11 | 5.99c | # | # | # | # | # | # | # | # | # | # | # | # | # | # | # | # | # | # | # |
| 6-Phosphogluconate | PGN3− | PGN | 13 | 4.995j | # | # | # | # | # | # | # | # | # | # | # | # | # | # | # | # | # | # | # |
| Ribose 5-phosphate | R5P2− | R5P | 11 | 6.255 | −9.75 | 2 | # | 1.58 | −9.71d | # | # | # | # | # | # | # | # | # | # | 1.48 | # | # | # |
| Ribulose 5-phosphate | RU5P2− | RU5P | 11 | 6.255i | −9.75i | 2i | # | 1.58i | −9.71i | # | # | # | # | # | # | # | # | # | # | 1.48i | # | # | # |
| Sedoheptulose 7-phosphate | S7P2− | S7P | 15 | 6.255i | −9.75i | 2i | # | 1.58i | −9.71i | # | # | # | # | # | # | # | # | # | # | 1.48i | # | # | # |
| Xylulose 5-phosphate | X5P2− | X5P | 11 | 6.255i | −9.75i | 2i | # | 1.58i | −9.71i | # | # | # | # | # | # | # | # | # | # | 1.48i | # | # | # |
aDissociation pK and  are reported for T = 298.15 K and I = 0.1 M. Unless indicated, values are the average number obtained from NIST database (27). Dissociation enthalpies are reported in units of kJ/mol. Subscripts on ‘pK’ and ‘
 ’ entries are defined as follows: ‘H’: hydrogen, ‘Mg’: magnesium, ‘K’: potassium, ‘Na’: sodium, ‘Ca’: calcium, ‘1’: first ion dissociation, ‘2’: second ion dissociation, ‘HMg’: hydrogen ion binds to the ligand before magnesium ion binds to the ligand. ‘#’ denotes value is not available.
bAlberty (8).
dTewari et al. (35).
eG6P and F6P are assumed to have equivalent H+ and Mg2+-dissociation properties.
fFrom NIST database (36) at T = 293.15 K.
gLarsson-Raźnikiewicz (37).
hMerrill et al. (38).
iE4P, RU5P, S7P and X5P are assumed to have equivalent dissociation properties as R5P (24).
jCasazza et al. (15).
kBriggs et al. (39).
lNADPred is assumed to have equivalent dissociation properties as NADPox.
Estimation of standard-state thermodynamic quantities
Given the compiled raw experimental data on the reactions and reactants, the thermodynamic model is used to estimate reference  and
and  values for the reference reactions and species. Note that in our thermodynamic model the
  values are adjustable parameters estimated to obtain the best fit to the biochemical equilibrium data. As in previous studies (8), values of
  for oxidized species of certain redox pairs are arbitrarily set to zero. Thus, these values are not true free energies of the reactions of formation for these chemical species; instead, they are parameters for which the thermodynamic model makes optimal predictions for these interdependent biochemical reactions.
Because the calculated  are interrelated [e.g. in the reductive pentose phosphate pathway, five carbon sugars (X5P and R5P) are converted into three carbon (GAP) and six carbon (F6P) sugars which can then be utilized by the pathway of glycolysis], the database of
  may be rigorously extended only by recalculating the entire database using all of the raw data. Therefore, model fitting is based on total 686 data entries for the network of all 33 reactions (the first 33 reactions listed in Table 1). Standard free energies of formation for all the reference species are unable to be estimated independently because there are 29 stoichiometrically independent reactions and in total 40 reactants in our system. There are four reactions PDH, IDH2, AKGDH and SDH (last four reactions in Tables 1 and 4) in the TCA cycle for which direct measurements are not available in the literature. For these reactions,
  values are calculated using Alberty's database (8) and set as constraints to perform the optimization of the thermodynamic model. IDH2 is not an independent reaction in the overall network of 33 reactions. Therefore, values of
  for 32 references species may be estimated from data on the 29 reactions with the three constraints. The values of
  for eight species are set to fixed values which are obtained from Alberty (8), as shown in Table 3 (values of
  for CoQ0 and CoQH20 do not come into these calculations). A constrained nonlinear optimization procedure with the fmincon solver (Mathworks, Inc.) is used to analyze the whole data set. By weighting in inverse proportion to the number of data points available for a given reaction and minimizing the difference between model predictions and experimental data, a simultaneous solution of standard reaction Gibbs energies is obtained for the entire data set.
Table 4.
Optimal reaction free energies for reference chemical reactions ( ) and for biochemical reactions (
 ) under physiological conditionsa
| EC No. | Reaction |
 b b
|
 b b
|
 |
 |
Non-standard element contributionsc |
|||
|---|---|---|---|---|---|---|---|---|---|
| T | I | pH | P | ||||||
| EC 2.7.1.1 | GLK | 16.19 | 16.03 | −19.22 | −35.41 | 1.61 | 1.57 | −41.56 | 2.97 |
| EC 5.3.1.9 | PGI | 3.12 | 3.13 | 2.78 | −0.34 | −0.34 | 0 | 0 | 0 |
| EC 2.7.1.11 | PFK | 26.79 | 26.79 | −15.62 | −42.41 | 1.46 | −4.70 | −41.56 | 2.40 |
| EC 4.1.2.13 | FBA | 18.79 | 18.80 | 24.64 | 5.85 | −1.21 | 6.26 | 0 | 0.81 |
| EC 5.3.1.1 | TPI | −7.01 | −7.01 | −7.57 | −0.56 | −0.39 | 0 | 0 | −0.17 |
| EC 4.1.2.13 | FBA2 | 11.79 | 11.79 | 17.07 | 5.28 | −1.61 | 6.26 | 0 | 0.64 |
| EC 1.2.1.12 | GAP | 51.37 | 51.37 | 2.60 | −48.77 | 2.07 | −9.39 | −41.56 | 0.12 |
| EC 2.7.2.3 | PGK | 34.37 | 34.37 | −19.00 | −53.37 | 1.38 | −9.39 | −41.56 | −3.79 |
| EC 5.4.2.1 | PGYM | −5.89 | −5.90 | −6.35 | −0.46 | −1.37 | 0 | 0 | 0.91 |
| EC 4.2.1.11 | ENO | −4.54 | −4.53 | −4.47 | 0.07 | −0.79 | 0 | 0 | 0.86 |
| EC 2.7.1.40 | PYK | 66.91 | 66.90 | 27.18 | −39.73 | 2.48 | −1.57 | −41.56 | 0.92 |
| EC 4.1.3.7 | CITS | 60.16 | 60.32 | −36.60 | −96.76 | 2.42 | −6.26 | −83.13 | −9.80 |
| EC 4.2.1.3 | ACON | −5.75 | −5.76 | −7.58 | −1.83 | 0.57 | 0 | 0 | −2.41 |
| EC 1.1.1.42 | IDH | 97.05 | 97.06 | −3.29 | −100.34 | 4.80 | −6.26 | −83.13 | −15.76 |
| EC 6.2.1.4 | SCS | −56.55 | −56.56 | 0.07 | 56.62 | −1.03 | 6.26 | 41.56 | 9.82 |
| EC 4.2.1.2 | FUM | −3.38 | −3.38 | −3.52 | −0.14 | 0.39 | 0 | 0 | −0.53 |
| EC 1.1.1.37 | MDH | 71.41 | 71.09 | 28.04 | −43.37 | 0.81 | −3.13 | −41.56 | 0.52 |
| EC 2.7.4.6 | NDK | 0.02 | 0.01 | −0.56 | −0.58 | 0 | 0 | 0 | −0.58 |
| EC 1.6.1.1 | NPTH | −3.53 | −3.58 | −0.41 | 3.12 | 0.02 | 3.13 | 0 | −0.03 |
| EC 1.1.1.40 | MLE | 104.53 | 103.45 | 2.00 | −102.53 | 4.21 | −7.83 | −83.13 | −15.78 |
| EC 1.1.1.37 | MDH2 | 131.57 | 131.41 | −6.50 | −138.07 | 5.30 | −9.39 | −124.69 | −9.28 |
| EC 2.7.1.23 | NADK | 29.11 | 26.90 | −9.95 | −39.06 | 1.17 | −1.57 | −41.56 | 2.89 |
| EC 3.6.1.32 | ATPS | 4.99 | 4.67 | −32.42 | −37.41 | 1.03 | 1.57 | −41.56 | 1.56 |
| EC 3.1.3.1 | G6PH | −11.20 | −11.36 | −13.10 | -1.90 | −0.49 | 0 | 0 | −1.41 |
| EC 6.4.1.1 | PCL | −24.60 | −24.12 | −4.57 | 20.03 | −0.99 | 3.13 | 0 | 17.89 |
| EC 1.1.1.49 | G6PD | 38.69 | #d | −7.51 | −46.20 | 1.56 | −6.26 | −41.56 | 0.07 |
| EC 3.1.1.31 | PGL | 69.16 | #d | −21.89 | −91.05 | 2.78 | −10.96 | −83.13 | 0.25 |
| EC 1.1.1.44 | PGD | 104.64 | #d | 1.23 | −103.41 | 2.70 | −6.26 | −83.13 | −16.73 |
| EC 5.3.1.6 | R5PI | 0.99 | 1.2e | 0.52 | −0.47 | −0.47 | 0 | 0 | 0 |
| EC 5.1.3.1 | RUPE | −1.28 | −1.21e | −1.33 | −0.05 | −0.05 | 0 | 0 | 0 |
| EC 2.2.1.1 | TKL | 1.58 | #d | 1.23 | −0.35 | 0.06 | 0 | 0 | −0.41 |
| EC 2.2.1.2 | TAL | 2.72 | #d | 2.63 | −0.09 | 0.11 | 0 | 0 | −0.20 |
| EC 2.2.1.1 | TKL2 | 8.98 | #d | 8.71 | −0.27 | 0.36 | 0 | 0 | −0.63 |
| EC 1.2.4.1+EC 2.3.1.12+EC 1.8.1.4 | PDH | 15.78f | 17.50 | −39.26 | −55.04 | 0.64 | −4.70 | −41.56 | −9.43 |
| EC 1.1.1.41 | IDH2 | 93.52 | 93.48 | −3.70 | −97.22 | 4.82 | −3.13 | −83.13 | −15.79 |
| EC 1.2.1.52 | AKGDH | 15.85f | 15.28 | −37.66 | −53.51 | 0.64 | −3.13 | −41.56 | −9.45 |
| EC 1.3.5.1 | SDH | −1.35f | −3.10 | −0.59 | 0.76 | −0.05 | 0 | 0 | 0.81 |
aThe physiological conditions (26) are as follows: T = 310.15 K, I = 0.18 M, pH = 7, [Mg2+] = 0.8 mM, [K+] = 140 mM, [Na+] = 10 mM, [Ca2+] = 0.0001 mM. The unit of the free energy is kJ/mol.
b is the optimal reaction free energies for reference chemical reactions in this work,
  is the optimal reaction free energies for reference chemical reaction in Li et al. (7).
cThis column lists the actual values of each non-standard physiological condition contribution (in kJ/mol) to the difference between the physiological free energies ( ) and the standard free energies (
 ). T denotes the temperature contribution, I denotes the ionic strength contribution, pH denotes the pH contribution and P denotes the binding polynomial contribution.
dValue is not available.
eCalculated from Goldberg's database (25): the  values for R5P, RU5P and X5P in Goldberg's database are −1582.57, −1581.37 and −1582.58 kJ/mol, respectively.
fValues calculated from Alberty's database (8) are used as model constraints for which there are no equilibrium data in the raw-data database. Since the  values for CoQ and CoQH2 are not predicted here, these values are set to 0 and −89.92 kJ/mol, respectively [from Alberty (8)] to computed
  for the SDH reaction.
Table 3.
Values of  (T = 298.15 K, I = 0) used in this study and that were taken from Alberty (8) (Table 3.2)
| Species |
 (kJ/mol) (kJ/mol) |
|---|---|
| ACoA0 | −188.52 |
| ADP3− | −1906.13 |
| CO32− | −527.81 |
| GTP4− | −2768.1 |
| H2O | −237.19 |
| NADox− | 0a |
| HPO42− | −1096.1 |
| H+ | 0 |
| CoQ0 | 0a |
| CoQH20 | −89.92 |
aProperty value is based on the arbitrary assignment of zero.
Results
Estimated Gibbs free energies of reaction and formation
Figure 1 illustrates model predictions versus experimental data for all data used in the analysis. The predicted  values are obtained based on accounting for the biochemical state associated with a given experimental measurement in the raw-data database. Data points in the pentose phosphate pathway are shown as filled squares. Other data points are shown as open squares. The data span almost 14 orders of magnitude, and reveal good agreement between model predictions and measured data.
Figure 1.

Model-predicted  versus experimental
  . Model predicted apparent equilibrium constants under defined experimental conditions (T, I, [Mg2+], [Ca2+], [Na+], [K+] and pH) are plotted versus experimental measurements for all data used in the analysis. Data points in the pentose phosphate pathway are shown as filled squares.
The optimal estimates of  listed in Table 4 (
 ), compared to the values from Li et al. (7) (
 ).
).  of first 25 reactions are almost the same as the results obtained previously (7). For the remaining eight reactions of the pentose phosphate pathway, since the
  of the reference species for E4P, PGLT, PGN and S7P are not available in the Alberty (8) or Goldberg's database (25), the symbol ‘#’ is used to denote the lack of a value. For reactions R5PI and RUPE, the absolute difference between our current model predictions and the values reported by Goldberg et al. (25) is within a reasonable margin, 0.21 and 0.07 kJ/mol, respectively. Predicted
  versus experimental measures are plotted in Figure 2 for these two reactions (R5PI and RUPE). The current database and the Goldberg database yield similar results. Recall that the dissociation properties of R5P, RU5P and X5P are assumed to be the same; the binding polynomials for the reactants on the left- and right-hand sides of these reactions are identical. Thus, the computed apparent equilibrium constants for these reactions do not depend on the experimental ionic composition. The validity of this assumption will be considered in the uncertainty and sensitivity analysis below. In addition, the predicted thermodynamic properties are not affected by the ionic strength for these reactions.
Figure 2.

Model-predicted  versus experimental
  for the ribose-5-phosphate isomerase and ribuloase-phosphate 3-epimerase reactions. Open circles (GT-based
  ) are computed based on the Goldberg's database (25); filled squares (optimized
  ) are computed based on the optimized values of
  from Table 5.
Optimal predicted  associated with the
  predictions are listed in Table 5, compared to the optimal values of our previous version of the database (7). After the seven reactants of the pentose phosphate pathway and three constraints (
 of reaction PDH, AKGDH and SDH) are introduced, most of the estimated values of
  are shifted substantially. However, from Table 4 we can see that these shifts do not change the predicted
  compared to previous predictions. This is because the shifts in
  do not change the optimized results (apparent
  or
or  ) of our model. Recall that here the estimated
  values represent parameters in a thermodynamic model for this set of interdependent biochemical reactions. Since the number of independent reactions for which data exist (29 reactions) is smaller than the number of
  values to represent the system (40 reactants), values for several reference species are set to either existing values or values reported elsewhere (Table 3). As a result, these
  values are not physical constants. Rather, they are parameters in a thermodynamic network model that together form a self-consistent picture of the thermodynamics of reactions of the set of reactants studied here.
Table 5.
Optimal predicted  for reference species (T = 298.15 K, I = 0 M)
| No. | Species |
 a a
|
 a a
|
 |
Sensitivity |
|---|---|---|---|---|---|
| 1 | GLC0 | −719.37 | −916.39 | 197.02 | 0.33 |
| 2 | ATP4− | −2770.03 | −2769.71 | 0.32 | 56099.52 |
| 3 | F6P2− | −1563.96 | −1760.81 | 196.85 | 1.52 |
| 4 | F16P4− | −2401.08 | −2597.60 | 196.52 | 3.55 |
| 5 | DHAP2− | −1194.65 | −1292.91 | 98.26 | 3.51 |
| 6 | GAP2− | −1187.64 | −1285.90 | 98.26 | 3.49 |
| 7 | BPG4− | −2276.28 | −2354.55 | 78.27 | 19.44 |
| 8 | NADred2− | 43.91 | 23.91 | 20.00 | 0.14 |
| 9 | PG33− | −1429.38 | −1507.96 | 78.58 | 7.83 |
| 10 | PG23− | −1423.49 | −1502.06 | 78.57 | 7.83 |
| 11 | PEP3− | −1190.84 | −1269.40 | 78.56 | 5.54 |
| 12 | PYR− | −393.85 | −472.72 | 78.87 | 0.64 |
| 13 | OAA2− | −714.06 | −792.13 | 78.07 | 2.06 |
| 14 | CIT3− | −1022.44 | −1157.52 | 135.08 | 1.38 |
| 15 | ISCIT3− | −1016.69 | −1151.76 | 135.07 | 1.38 |
| 16 | NADPox3− | −834.79 | −836.68 | 1.89 | 1837.57 |
| 17 | AKG2− | −676.45 | −791.57 | 115.12 | 0.83 |
| 18 | SUC2− | −589.56 | −685.56 | 96.00 | 0.91 |
| 19 | GDP3− | −1904.22 | −1904.53 | 0.31 | 9560.62 |
| 20 | FUM2− | −500.99 | −598.74 | 97.75 | 0.67 |
| 21 | MAL2− | −741.56 | −839.30 | 97.74 | 1.44 |
| 22 | G6P2− | −1567.08 | −1763.94b | 196.86 | 1.52 |
| 23 | COAS0 | −57.17 | 0b | 57.17 | 0.03 |
| 24 | NADPred4− | −787.35 | −809.19b | 21.84 | 41.94 |
| 25 | SUCCoA− | −471.06 | −509.59b | 38.53 | 3.47 |
| 26 | E4P2− | −1306.62 | # | # | 2.39 |
| 27 | PGLT2− | −1575.83 | # | # | 1.85 |
| 28 | PGN3− | −1782.55 | # | # | 2.34 |
| 29 | R5P2− | −1435.72 | # | # | 1.86 |
| 30 | RU5P2− | −1434.72 | # | # | 1.86 |
| 31 | S7P2− | −1685.66 | # | # | 1.31 |
| 32 | X5P2− | −1436.00 | # | # | 1.85 |


The robustness of these calculations is checked by repeating the optimization with the  for a single species constrained to a value
  different from the estimated optimal value. The degree to which the experimental data can be matched with one
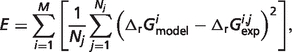
  value 10% different from the optimal values reported in Table 5 provides a measure of the sensitivity of the estimate. We define a sensitivity measure Si for the estimate of
  as
as
 |
(1) |
| (2) |
where  is the optimal value of the error function (for values listed in Table 5) and
  is the error with
  set to a 90% or 110% of its optimal value, M is the number of reactions, and Nj is the number of experimental measures for each reaction. Sensitivity values are listed in Table 5 for each species, revealing that estimates of
  for GLC0, NADred2−, PYR−, AKG2−, SUC2−, FUM2− and COAS0 are not highly sensitive to the data.
Predicted apparent Gibbs free energies under physiology conditions
The fifth column in Table 4 reports the predicted apparent  (
( ) at physiological conditions representative of a muscle cell (26) (T = 310.15 K, I = 0.18 M, pH = 7, [Mg2+] = 0.8 mM, [K+] = 140 mM, [Na+] = 10 mM, [Ca2+] = 0.0001 mM). Differences between the physiological free energies (
 ) and the standard free energies (
 ) are also shown in Table 4. These differences come from the effects of non-standard physiological conditions—temperature (T), ionic strength (I), pH and cation bindings. Therefore, the physiological free energy
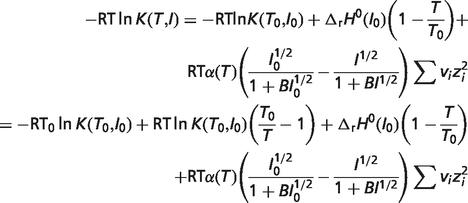
  can be expressed by the summation of the standard free energy
  and the non-standard contributions
  :
:
| (3) |
where T0 = 298.15 K, I0 = 0 M,  is the apparent equilibrium constant for the associated biochemical reaction,
  denotes the temperature contribution,
  denotes the ionic strength contribution,
  denotes the pH contribution and
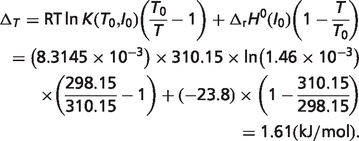
  denotes the binding polynomial contribution. An example calculation [for reaction GLK (EC 2.7.1.1)] is described in the Appendix A.
The contributions of non-standard elements to the differences between the standard free energy for the reference chemical reaction ( ) and the physiological energy values (
 ) are listed in the last four columns of Table 4. The results can be divided to three cases: (i) if the stoichiometric coefficient of H+ is non-zero in the reference chemical reaction (vH ≠ 0), the differences are substantial and pH contributes significantly, accounting for at least 73% of the difference, e.g. reactions GLK, PFK and GAP; (ii) if vH = 0 (
 ) and
) and  (
( ), the differences tend to be relatively small compared with case (i) and temperature and/or binding polynomials contribute most to the differences, e.g. reactions PGI, TPI and ACON; (iii) if vH = 0 (
 ) and
) and  ionic strength and/or binding polynomials contribute most to the differences, e.g. reactions FBA, NPTH and PCL.
For the reactions of the pentose phosphate pathway, only the first three reactions G6PD, PGL and PGD show substantial difference between free energy for the reference chemical reaction ( ) and for biochemical reaction (
 ) under physiological conditions. These three reactions have vH ≠ 0. They are the oxidative portion of the pentose phosphate pathway (15, 23), which produce NADPred and are essentially ‘irreversible’ in vivo (23).
Dissociation constants uncertainty and sensitivity analysis
The pK values listed in Table 2 are taken as the average value when there are several values (≥2) available in NIST database (27). For these pK values, the average value may not represent the best choice to be used in the model, i.e. some value among those available values may be more accurate than others. For some pK values, there exists only one estimate or no direct estimates. In order to predict the impact of uncertainty of these values on the model output, an uncertainty and sensitivity analysis is performed.
The following equation is used as a measure of uncertainty in a pK value when several independent measures are available:
| (4) |
where pKmax and pKmin refer to the maximum and minimum value of pK, respectively. Table 6 shows the computed uncertainties for these pKs.
Table 6.
Dissociation constants uncertainty analysis for reactants with several pK values available in NIST database (27)
| Reactant abbreviation |  |
 |
 |
 |
|---|---|---|---|---|
| ADP | 0.0539 | 0.0545 | 0.01748 | |
| ATP | 0.0849 | 0.1051 | 0.1215 | |
| CIT | 0.0423 | 0.0597 | 0.0480 | |
| GDP | 0.0630 | |||
| GTP | 0.0799 | 0.0835 | ||
| ISCIT | 0.0052 | 0.0571 | ||
| MAL | 0.0148 | 0.0153 | 0.0549 | |
| Pi | 0.0251 | 0.0463 | 0.1975 | 0.1433 |
| PEP | 0.0336 | |||
| SUC | 0.0133 | 0.0149 | 0.1476 | |
| R5P | 0.0016 |
When only one pK value estimate is available, the uncertainty is defined as the average number  of all calculated
  :
:
| (5) |
According to Table 6,  is equal to 0.0609.
The sensitivities of the computed thermodynamic database due to a 10% change of pK values are calculated (28):
| (6) |
where E is shown in equation (1), and xi is the value of the ith pK, Table 7 lists calculated sensitivities >0.1. Sensitivity values for all potassium and sodium ion dissociation constants are <0.1. Calcium ion dissociation constants are not included in these calculations because [Ca2+] = 0 for all reactions in our raw-data database. Thus calculated sensitivities of calcium ion dissociations are equal to 0.
Table 7.
Sensitivity >0.1 in dissociation constants sensitivity analysis
| Reactant abbreviation |  |
 |
 |
 |
|---|---|---|---|---|
| ADP | 0.4936 | 0.3696 | 0.1709 | |
| ATP | 0.2151 | 0.2665 | 0.2210 | |
| CIT | 0.6029 | |||
| COAS | 0.5344 | |||
| DHAP | 0.6591 | 0.3772 | ||
| F16P | 1.1839 | 0.3181 | 1.3545 | |
| G6P | 0.6372 | 0.4524 | ||
| GDP | 0.1873 | |||
| GTP | 0.1310 | |||
| ISCIT | 0.1230 | 0.2245 | ||
| NADPox | 1.7916 | |||
| NADPred | 0.7611 | |||
| Pi | 0.1248 | 0.2015 | ||
| PG2 | 1.2172 | |||
| PG3 | 0.3698 | |||
| PEP | 0.2293 | |||
| R5P | 0.1818 | |||
| RU5P | 0.1007 | |||
| S7P | 0.1433 | |||
| X5P | 0.1597 |
The product (US) combining uncertainty U and sensitivity S can be used to check the overlapping effect of uncertainty and sensitivity. For example, recall that we arbitrarily assign the value of 4.995 to the pKH1 for PGN. Since the value is not available in NIST database, its uncertainty U is set to the average number 0.0609. If we consider the theoretical range of 4–5.99 discussed above, then the calculated uncertainty U is ∼0.4. For this case, because the computed pKH1 sensitivity is 0.0225, the US product is <0.01, which is small enough that the value of pKH1 for PGN has no substantial effect on the model output. Similarly, recall that E4P, RU5P, S7P and X5P are assumed to have dissociation properties equivalent to R5P in our calculations. Although the computed pK sensitivities of E4P, RU5P, S7P and X5P are 3.81E-6, 0.1007, 0.1433 and 0.1597, respectively, all the US products of the pKH1 for these reactants are <0.01. Therefore, the assumption of equivalent dissociation properties for E4P, R5P, RU5P, S7P and X5P does not substantially effect our calculations.
Figure 3A illustrates that US products span eight orders of magnitude. Figure 3B illustrates the detailed distribution of the US products >0.01. All US products are <0.11. There are 23 cases for which US >0.01. These 23 US values belong to 15 reactants and four pKs as listed in Table 8. They are a subset of the pKs with sensitivity >0.1. They demonstrate the most important pKs which can make obvious impact on the model output. The largest four US values are  as indicated in Figure 3B.
Figure 3.

(A) Distribution of the product of uncertainty and sensitivity (US) for all pK values; (B) detailed distribution of the product >0.01.
Table 8.
The product ( ) >0.01 in dissociation constants uncertainty and sensitivity analysis
| Reactant abbreviation |  |
|---|---|
| ADP |  |
| ATP |  |
| CIT |  |
| COAS |  |
| DHAP |
 , ,
|
| F16P |  |
| G6P |  |
| GDP |  |
| GTP |  |
| ISCIT |  |
| Pi |  |
| NADPox |  |
| NADPred |  |
| PG2 |  |
| PG3 |  |
Database dissemination
ThermoML is an extensible markup language (XML)-based approach, which is an IUPAC standard for storage and exchange of thermodynamic property data (29–32). Our optimized results are stored in the standard ThermoML format with two small extensions to the current ThermoML schema (32): (i) adding ‘pseudo-Gibbs free energy of formation, kJ/mol’ in the list of ePropName in BioProperties of PureOrMixtureData; and (ii) adding ‘biochemical network calculation’ in ePredictionType of Prediction. We use the term ‘pseudo-Gibbs free energy of formation’ because in our thermodynamic model the estimated  values represent adjustable parameters for the given set of interdependent biochemical reactions. In our ThermoML data files, the abbreviation name of reactant is also added in sCommonName in Compound. In the ThermoML reaction database, if the value of
  is not available, it is specified in sPredictionMethodDescription, and both nPropValue and nPropDigits are set to 0 in PropertyValue of NumValues. The ThermoML schema and our ThermoML data files are provided in Supplementary Data.
Discussion
We have updated our biochemical thermodynamic database by adding the reactions of the pentose phosphate pathway. To build the new database, each original publication has been studied on a case-by-case basis, case-specific assumptions and approximations determined and documented, and case-specific calculations performed and documented. Raw data and documented estimations of solution properties are made electronically available so that the updated database remains transparent and extensible.
The developed database is optimally self-consistent and consistent with the data available for reactions considered and the constraints. Theoretical predictions of apparent equilibrium constants optimally match experimental data on equilibrium constants. These apparent equilibrium constants are predicted based on the estimated species-level Gibbs free energies of formation and accounting for the effects of temperature, ionic interactions and hydrogen and metal cation binding. The new database provides thermodynamic and network-based estimates of thermodynamic properties for six reactions of the pentose phosphate pathway for which estimates are not available in the pre-existing literature.
These calculations demonstrate how network thermodynamic calculations are effectively extended. Adding raw experimental data on reactions and reactants of the pentose phosphate pathway into corresponding raw-data database, reaction database and reactant database, respectively, a previous thermodynamic network model was extended to include these elements.
Although the new optimal estimates of  for reactants of glycolysis and tricarboxylic acid cycle are equal to previous estimates (7), most of the optimal predicted
  values which are associated with the
  predictions are shifted compared to the previous version. This result demonstrates that reliable and self-consistent extensions require the recalculation of entire set of species-level parameters. Furthermore, sensitivity analysis reveals that some formation energies can vary substantially without changing the optimized objective value significantly. While this set of optimal values represents a self-consistent set, combining these estimated formation energies with independently estimated parameters from other studies would require re-optimizing a combined database.
The uncertainty and sensitivity analysis of dissociation constants reveals 23 pKs most important to the model output. Additional experimental measurements of these parameter values are desirable.
Supplementary Data
Supplementary data are available at Database Online.
Acknowledgements
The authors are grateful to Robert Goldberg for advice and critical comments.
Funding
National Institutes of Health Heart Lung and Blood Institute (grant number HL072011). Funding for open access charge: National Institutes of Health Heart Lung and Blood Institute.
Conflict of interest. None declared.
Appendix A
Calculating the physiological free energy 
The standard free energy  can be calculated based on the equilibrium constant K, for a reference chemical reaction:
| (A.1) |
where T0 = 298.15 K, I0 = 0 M, R = 8.3145 J K−1 mol−1.
The apparent equilibrium constant,  for the associated biochemical reaction can also be calculated based on K:
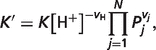 |
(A.2) |
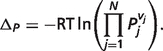
where vH is the stoichiometric coefficient associated with H+ in the reference reaction, Pj is the binding polynomial associated with species j and vj is the stoichiometric coefficient of species j. If assuming that the activity coefficient for hydrogen ion is equal to 1, i.e. pH = −log10([H+]), the physiological free energy  can then be obtained based on equations (A.1) and (A.2):
 |
(A.3) |
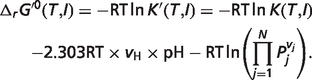
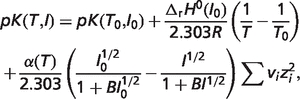
The first term in the right-hand side of equation (A.3) can be separated into four terms as shown in equation (A.6) based on equations (A.4) and (A.5) (7):
 |
(A.4) |
| (A.5) |
 |
(A.6) |
where pK is the negative base-10 logarithm of equilibrium constant K,  is the standard reaction enthalpy at ionic strength I0, zi is the valence of species i, B is an empirical constant taken to be 1.6 M−1/2, and α(T) is the coefficient in the Debye equation
The non-standard element (temperature, ionic strength, pH and binding polynomial) contributions  are defined as follows:
| (A.7) |
 |
(A.8) |
| (A.9) |
 |
(A.10) |
Then the physiological free energy  can be expressed by the summation of the standard free energy
  and the non-standard element contributions
 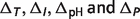 :
:
| (A.11) |
Example
The calculations the physiological free energy  for reaction glucokinase GLK (EC 2.7.1.1) is illustrated as an example. As mentioned in the article, the physiological conditions are T = 310.15 K, I = 0.18 M, pH = 7, [Mg2+] = 0.8 mM, [K+] = 140 mM, [Na+] = 10 mM, [Ca2+] = 0.0001 mM. The optimized standard free energy (
 ) of GLK is 16.19 kJ/mol, as shown in Table 4. Equilibrium constant for the chemical reference reaction can be computed as
  The chemical reference reaction of GLK is
vH = 1 in this reference reaction, and  Thus, the pH and ionic strength contributions can be calculated as follows:
 |
As shown in Table 1 in the article,  kJ/mol. Then temperature contribution can be obtained
 |
In order to calculate binding polynomial contribution  the binding polynomial Pj for each reactant j should be first calculated (7):
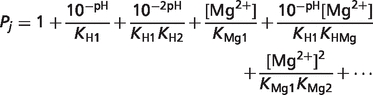 |
(A.12) |
where Kdi is the dissociation constant of cation ion d. The negative base-10 logarithm of dissociation constant pKd ( ) for all reactants are listed in Table 2 in the article. Temperature and ionic strength should be done to transform all the dissociation constants to T = 310.15 K and I = 0.18 M before calculating the binding polynomial Pj. For reaction GLK,
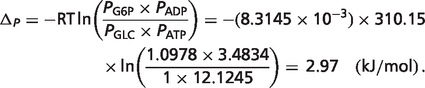 |
Therefore, the physiological free energy for reaction glucokinase GLK is
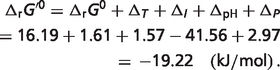 |
The total difference is  The percentages of the contributions of non-standard elements to this difference are
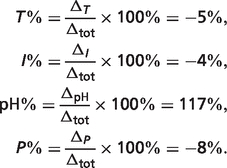 |
Nomenclature
B: an empirical constant taken to be 1.6 M−1/2
E: the minimum squared difference between model simulations and experimental data
 : standard Gibbs free energy of reaction
 : standard Gibbs free energy of formation of species i
 : apparent Gibbs free energy of reaction
 : enthalpy of proton/metal cation dissociation
 : standard enthalpy of reaction
I: ionic strength
K: chemical (reference reaction) equilibrium constant
 : apparent equilibrium constant
Kdi: the dissociation constant of cation ion d
M: the number of reactions
N: the number of pKs which have several values available in NIST database
Nj: the number of experimental data in each reaction
Pj: binding polynomial associated with reactant j
pK: negative logarithm of the dissociation constant
R: gas constant, 8.3145 J K−1 mol−1
S: sensitivity
T: temperature
U: uncertainty
vi: stoichiometric coefficient for species i in a given reaction
zi: valence of species i
 : the ionic strength contribution
 : the pH contribution
 : the binding polynomial contribution
 : the temperature contribution
References
- 1.Vojinović V, von Stockar U. Influence of uncertainties in pH, pMg, activity coefficients, metabolite concentrations, and other factors on the analysis of the thermodynamic feasibility of metabolic pathways. Biotechnol. Bioeng. 2009;103:780–795. doi: 10.1002/bit.22309. [DOI] [PubMed] [Google Scholar]
- 2.Mavrovouniotis ML. Identification of localized and distributed bottlenecks in metabolic pathways. In: Hunter L, Searls DB, Shavlik JW, editors. Proceedings of the First International Conference on Intelligent Systems for Molecular Biology. Bethesda, MD: AAAI Press; 1993. pp. 275–283. [PubMed] [Google Scholar]
- 3.Yang F, Beard DA. Thermodynamically based profiling of drug metabolism and drug-drug metabolic interactions: a case study of acetaminophen and ethanol toxic interaction. Biophys. Chem. 2006;120:121–134. doi: 10.1016/j.bpc.2005.10.013. [DOI] [PubMed] [Google Scholar]
- 4.Kümmel A, Panke S, Heinemann M. Putative regulatory sites unraveled by network-embedded thermodynamic analysis of metabolome data. Mol. Syst. Biol. 2006;2 doi: 10.1038/msb4100074. 2006.0034. [DOI] [PMC free article] [PubMed] [Google Scholar]
- 5.Henry CS, Broadbelt LJ, Hatzimanikatis V. Thermodynamics-based metabolic flux analysis. Biophys. J. 2007;92:1792–1805. doi: 10.1529/biophysj.106.093138. [DOI] [PMC free article] [PubMed] [Google Scholar]
- 6.Vinnakota KC, Wu F, Kushmerick MJ, et al. Multiple ion binding equilibria, reaction kinetics, and thermodynamics in dynamic models of biochemical pathways. Methods Enzymol. 2009;454:29–68. doi: 10.1016/S0076-6879(08)03802-0. [DOI] [PMC free article] [PubMed] [Google Scholar]
- 7.Li X, Dash RK, Pradhan RK, et al. A database of thermodynamic quantities for the reactions of glycolysis and the tricarboxylic acid cycle. J. Phys. Chem. 2010;114:16068–16082. doi: 10.1021/jp911381p. [DOI] [PMC free article] [PubMed] [Google Scholar]
- 8.Alberty RA. Thermodynamics of Biochemical Reactions. Hoboken, NJ: John Wiley; 2003. [Google Scholar]
- 9.Beard DA, Qian H. Chemical Biophysics: Quantitative Analysis of Cellular Systems. Cambridge, UK: Cambridge University Press; 2008. Conventions and calculations for biochemical systems; pp. 24–40. [Google Scholar]
- 10.Alberty RA. Thermodynamic properties of weak acids involved in enzyme-catalyzed reactions. J. Phys. Chem. B. 2006;110:5012–5016. doi: 10.1021/jp0545086. [DOI] [PubMed] [Google Scholar]
- 11.Clarke ECW, Glew DN. Evaluation of Debye–Hückel limiting slopes for water between 0 and 150°C. J. Chem. Soc., Faraday Trans. 1. 1980;76:1911–1916. [Google Scholar]
- 12.Alberty RA. Effect of temperature on standard transformed Gibbs energies of formation of reactants at specified pH and ionic strength and apparent equilibrium constants of biochemical reactions. J. Phys. Chem. B. 2001;105:7865–7870. [Google Scholar]
- 13.Alberty RA. Calculation of thermodynamic properties of species of biochemical reactants using the inverse legendre transform. J. Phys. Chem. B. 2005;109:9132–9139. doi: 10.1021/jp044162j. [DOI] [PubMed] [Google Scholar]
- 14.Glaser L, Brown DH. Purification and properties of D-glucose-6-phosphate dehydrogenase. J. Biol. Chem. 1955;216:67–79. [PubMed] [Google Scholar]
- 15.Casazza JP, Veech RL. The interdependence of glycolytic and pentose cycle intermediates in ad libitum fed rats. J. Biol. Chem. 1986;261:690–698. [PubMed] [Google Scholar]
- 16.Villet RH, Dalziel K. The nature of the carbon dioxide substrate and equilibrium constant of the 6-phosphogluconate dehydrogenase reaction. Biochem. J. 1969;115:633–638. doi: 10.1042/bj1150633. [DOI] [PMC free article] [PubMed] [Google Scholar]
- 17.Axelrod B, Jang R. Purification and Properties of Phosphoriboisomerase from Alfalfa. J. Biol. Chem. 1954;209:847–855. [PubMed] [Google Scholar]
- 18.Hurwitz J, Horecker BL. The purification of phosphoketopentoepimerase from lactobacillus pentosus and the preparation of xylulose 5-phosphate. J. Biol. Chem. 1956;223:993–1008. [PubMed] [Google Scholar]
- 19.Datta AG, Racker E. Mechanism of action of transketolase. J. Biol. Chem. 1961;236:617–623. [PubMed] [Google Scholar]
- 20.Goldberg RN, Tewari YB, Bell D, et al. Thermodynamics of enzyme-catalyzed reactions: Part 1. Oxidoreductases. J. Phys. Chem. Ref. Data. 1993;22:515–82. [Google Scholar]
- 21.Goldberg RN, Tewari YB. Thermodynamics of enzyme-catalyzed reactions: Part 2. Transferases. J. Phys. Chem. Ref. Data. 1994;23:547–617. [Google Scholar]
- 22.Goldberg RN, Tewari YB. Thermodynamics of enzyme-catalyzed reactions: Part 5. Isomerases and ligases. J. Phys. Chem. Ref. Data. 1995;24:1765–1801. [Google Scholar]
- 23.Nelson DL, Cox MM. Lehninger Principle of Biochemistry. New York: W. H. Freeman and Company Press; 2005. Glycolysis, gluconeogenesis, and the pentose phosphate pathway. [Google Scholar]
- 24.Perrin DD, Dempsey B, Serjeant EP. pKa Prediction for Organic Acids and Bases. London and New York: Chapman and Hall; 1981. [Google Scholar]
- 25.Goldberg RN, Tewari YB. Thermodynamic and transport properties of carbohydrates and their monophosphates: the pentoses and hexoses. J. Phys. Chem. Ref. Data. 1989;18:809–880. [Google Scholar]
- 26.Godt RE, Maughan DW. On the composition of the cytosol of relaxed skeletal muscle of the frog. Am. J. Physiol. Cell Physiol. 1988;254:C591–C604. doi: 10.1152/ajpcell.1988.254.5.C591. [DOI] [PubMed] [Google Scholar]
- 27.Smith RM, Martell AE, Motekaitis RJ. NIST Standard Reference Data. Gaithersburg, MD: 2004. NIST standard reference database 46 version 8.0: NIST critically selected stability constants of metal complexes. [Google Scholar]
- 28.Wu F, Yang F, Vinnakota KC, et al. Computer modeling of mitochondrial tricarboxylic acid cycle, oxidative phosphorylation, metabolite transport, and electrophysiology. J. Biol. Chem. 2007;282:24525–24537. doi: 10.1074/jbc.M701024200. [DOI] [PubMed] [Google Scholar]
- 29.Frenkel M, Chirico RD, Diky VV, et al. ThermoML - an XML-based approach for storage and exchange of experimental and critically evaluated thermophysical and thermochemical property data. 1. Experimental data. J. Chem. Eng. Data. 2002;48:2–13. [Google Scholar]
- 30.Chirico RD, Frenkel M, Diky VV, et al. ThermoML - an XML-based approach for storage and exchange of experimental and critically evaluated thermophysical and thermochemical property data. 2. Uncertainties. J. Chem. Eng. Data. 2003;48:1344–1359. [Google Scholar]
- 31.Frenkel M, Chirico RD, Diky VV, et al. ThermoML - an XML-based approach for storage and exchange of experimental and critically evaluated thermophysical and thermochemical property data. 3. Critically evaluated data, predicted data, and equation representation. J. Chem. Eng. Data. 2004;49:381–393. [Google Scholar]
- 32.Chirico RD, Frenkel M, Diky V, et al. ThermoML - an XML-based approach for storage and exchange of experimental and critically evaluated thermophysical and thermochemical property data. 4. Biomaterials. J. Chem. Eng. Data. 2009;55:1564–1572. [Google Scholar]
- 33.Goldberg RN, Tewari YB. Thermodynamics of enzyme-catalyzed reactions. Part 3. Hydrolases. J. Phys. Chem. Ref. Data. 1994;23:1035–1103. [Google Scholar]
- 34.Alberty RA. Standard transformed formation properties of carbon dioxide in aqueous solutions at specified pH. J. Phys. Chem. 1995;99:11028–11034. [Google Scholar]
- 35.Tewari YB, Steckler DK, Goldberg RN, et al. Thermodynamics of hydrolysis of sugar phosphates. J. Biol. Chem. 1988;263:3670–3675. [PubMed] [Google Scholar]
- 36.Martell AE, Smith RM, Motekaitis RJ. NIST Standard Reference Data. Gaithersburg, MD: 2004. NIST standard reference database 46 version 8.0: NIST critically selected stability constants of metal complexes. [Google Scholar]
- 37.Larsson-Raźnikiewicz M. Complex formation between 3-phospho-D-glyceric acid and divalent metal ions. European Journal of Biochemistry. 1972;30:579–583. doi: 10.1111/j.1432-1033.1972.tb02129.x. [DOI] [PubMed] [Google Scholar]
- 38.Merrill DK, McAlexander JC, Guynn RW. Equilibrium constants under physiological conditions for the reactions of -3-phosphoglycerate dehydrogenase and -phosphoserine aminotransferase. Arch. Biochem. Biophys. 1981;212:717–729. doi: 10.1016/0003-9861(81)90416-1. [DOI] [PubMed] [Google Scholar]
- 39.Briggs TN, Stuehr JE. Simultaneous potentiometric determination of precise equivalence points and pK values of two- and three-pK systems. Anal. Chem. 1975;47:1916–1920. [Google Scholar]