

Abstract
Objectives. SLC2A9 gene variants associate with serum uric acid in white populations, but little is known about African American populations. Since SLC2A9 is a transporter, gene variants may be expected to associate more closely with the fractional excretion of urate, a measure of renal tubular transport, than with serum uric acid, which is influenced by production and extrarenal clearance.
Methods. Genotypes of single nucleotide polymorphisms (SNPs) distributed across the SLC2A9 gene were obtained in the Genetic Epidemiology Network of Arteriopathy cohorts. The associations of SNPs with serum uric acid, fractional excretion of urate and urine urate-to-creatinine ratio were assessed with adjustments for age, sex, diuretic use, BMI, homocysteine and triglycerides.
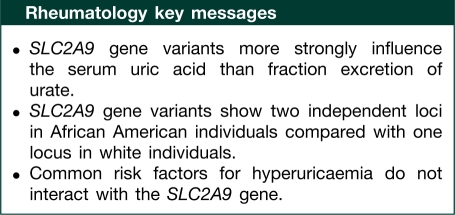
Results. We identified SLC2A9 gene variants that were associated with serum uric acid in 1155 African American subjects (53 SNPs) and 1132 white subjects (63 SNPs). The most statistically significant SNPs in African American subjects (rs13113918) and white subjects (rs11723439) were in the latter half of the gene and explained 2.7 and 2.8% of the variation in serum uric acid, respectively. After adjustment for this SNP in African Americans, 0.9% of the variation in serum uric acid was explained by an SNP (rs1568318) in the first half of the gene. Unexpectedly, SLC2A9 gene variants had stronger associations with serum uric acid than with fractional excretion of urate.
Conclusions. These findings support two different loci by which SLC2A9 variants affect uric acid levels in African Americans and suggest SLC2A9 variants affect serum uric acid level via renal and extrarenal clearance.
Keywords: Uric acid, Fractional excretion of urate, SLC2A9, Race, Genetic epidemiology
Introduction
Uric acid is largely excreted by the kidneys as humans lack a uricase enzyme. Elevated levels of uric acid can lead to painful kidney stones and gout, but most persons with hyperuricaemia are asymptomatic. Of great concern, increased uric acid levels are associated with obesity, hypertension, dyslipidaemia, insulin resistance, cardiovascular disease and chronic kidney disease [1–7]. While dietary factors (purines and alcohol) and medications (diuretics) are important causes of hyperuricaemia, genetic factors also influence uric acid metabolism [8].
Polymorphisms in the SLC2A9 gene, which encodes a renal tubular transporter of uric acid, have been identified as affecting serum uric acid levels and risk of gout in white populations [9–16]. An association of SLC2A9 gene variants with the fractional excretion of urate has also been described [9]. The SLC2A9 transporter has an isoform expressed in apical membrane and another isoform expressed in the basolateral membrane of renal proximal tubules [17]. This transporter exchanges uric acid with glucose and fructose for net reabsorption of uric acid [9]. The mechanism of hyperuricaemia associated with variants in SLC2A9 is thought to be mediated by increased expression of the apical isoform leading to increased reabsorption [17], although rare variants can also cause hypouricaemia [18]. The SLC2A9 single-nucleotide polymorphism (SNP) that is most significantly associated with serum uric acid in whites (rs16890979) is also associated with serum uric acid in African Americans [13]. Besides this single SNP, the association between SLC2A9 gene variants and serum uric acid in African Americans is unknown.
To gain insights into the biology and clinical relevance of the SLC2A9 transporter, we assessed whether SNPs that have been associated with serum uric acid levels were also associated with the fractional excretion of urate (FEU) (a measure of uric acid tubular reabsorption) or the urine urate-to-creatinine ratio (UUCR) (a measure of uric acid production) phenotypes. We hypothesized that SLC2A9 transporter variants would have a stronger association with the FEU phenotype than the serum uric acid or UUCR phenotypes since gene variants affect uric acid via tubular transport not production. We further compared SNPs in the SLC2A9 gene between African Americans and white subjects to characterize race differences in the within-gene loci that associate with serum uric acid levels. Finally, we evaluated gene-by-environment interactions to determine whether SLC2A9 gene variants interact with risk factors for hyperuricaemia that are enriched in hypertensive populations.
Methods
Subjects
The GENOA (Genetic Epidemiology Network of Arteriopathy) cohorts recruited non-Hispanic African American and white participants from two centres between 1996 and 2000 [19]. In Jackson, MS, USA, residents with essential hypertension were identified through the Atherosclerosis Risk in Communities cohort, a general population sample of 45- to 64-year-old non-Hispanic African American residents. In Rochester, MN, USA, the Rochester Epidemiology Project [20] was used to identify non-Hispanic white residents of the Olmsted County general population with a diagnosis of essential hypertension before the age of 60 years. Probands with evident secondary hypertension or advanced chronic kidney disease (serum creatinine >2.0 mg/dl) were not recruited at either site. The hypertensive proband and all siblings were invited to participate if at least one other sibling had essential hypertension. Between 2000 and 2004, 2721 (79%) of the 3434 original GENOA participants (1482 African Americans and 1239 whites) returned for a second clinic visit. All subjects provided consent in accordance with the Declaration of Helsinki and all protocols were approved by the Mayo Clinic and University of Mississippi Medical Center Institutional Review Boards.
Phenotype and covariate measurements
The study visit for both the GENOA cohorts included a blood draw, a spot urine sample, a limited physical exam and an administered survey. Based on a literature review, clinical characteristics (covariates) that associate with hyperuricaemia were identified from a survey, exam findings or laboratory testing at the study visit. This included age, sex, race, diagnosed hypertension, systolic blood pressure, diastolic blood pressure, use of anti-hypertensive therapy, diuretic use, diabetes, history of coronary disease, physical activity, BMI, waist circumference, hip circumference, alcohol intake >30 oz/month, ever smoker, fibrinogen, homocysteine, CRP, total cholesterol, HDL-cholesterol, triglycerides, lipoprotein A, serum creatinine, urine albumin to creatinine ratio; and use of daily aspirin, statins, anti-gout medications, losartan, fenofibrate and warfarin. Use of anti-gout medications was defined as the use of allopurinol, colchicine or probenecid in the last month.
Serum uric acid was measured with a standard uricase enzymatic assay on a Hitachi 911 Chemistry Analyzer (Roche Diagnostics, Indianapolis, IN, USA) [21]. Urine urate and creatinine were measured by standard methods on the same Hitachi 911 Chemistry Analyzer. FEU was calculated by (urine urate × serum creatinine) divided by (serum uric acid × urine creatinine) and urine UUCR was calculated from urine urate divided by urine creatinine.
Genotyping
In the white cohort, subjects were genotyped primarily on the Affymetrix SNP Array 6.0. Samples that failed on the Affymetrix SNP Array 6.0 were run again on the Illumina 660W and Illumina 1M-Duo platforms. Genotype data were merged, and imputed using 60 unrelated CEU samples from HapMap Phase 2 using MACH version 1.01 [22]. A total of 2 543 887 autosomal SNPs were imputed. From those, 419 SNPs were within 5 kb from the 5′- and 3′-ends of the SLC2A9 gene. Fourteen SNPs were removed from the analysis: eight because the minor allele frequency was <0.01 and six because the imputed R2 was <0.6. No SNPs were removed due to deviation from the Hardy–Weinberg equilibrium. Thus, for the analysis, 405 SNPs were used. Findings were similarly limited to the 114 SNPs genotyped from the Affymetrix 6.0 platform (data not shown).
In the African American cohort, subjects were genotyped primarily on the Affymetrix SNP Array 6.0. Samples that failed on the Affymetrix SNP Array 6.0 were run again on the Illumina 1M-Duo platform. Genotypes were imputed using the merged Affymetrix 6.0 and Illumina 1M-Duo genotypes and 60 unrelated Yoruba people of Ibadan, Nigeria (YRI) samples from HapMap Phase 2 using MACH version 1.01 [22]. A total of 2 852 184 autosomal SNPs were imputed. From those, 426 SNPs were within 5 kb from the 5′- and 3′-ends of the SLC2A9 gene. Six SNPs were removed from the analysis: three because the minor allele frequency was <0.01 and three because the imputed R2 was <0.6. None of the SNPs were removed due to deviation from the Hardy–Weinberg equilibrium. Thus, for the analysis, 420 SNPs were used. Findings were similarly limited to the 113 SNPs genotyped from the Affymetrix 6.0 platform or using HapMap imputed genotypes from 45 YRI and 15 CEU samples (data not shown).
Statistical analysis
Subjects on anti-gout medications were excluded since these medications and likely dietary interventions were being used to lower serum uric acid levels. We performed linear mixed-effect regression to account for pedigree structure (R multic package) in modelling of the t-rank transformed phenotypes [23]. A gene-level Bonferroni corrected P-value of <0.01 was considered to be statistically significant. Analyses were stratified on race and were either age–sex adjusted or fully adjusted. Covariates in fully adjusted models were parsimoniously chosen using backwards stepwise selection based on the model fit (R2) for the prediction of serum uric acid in the combined African American and white cohorts. These same covariate adjustments were also used in models for the FEU and UUCR phenotypes. For each SNP, the frequency of the allele associated with higher serum uric acid levels was reported instead of the minor allele frequency. Haploview V4.1 estimated blocks of the linkage disequilibrium pattern were compared between the two race groups [24]. To assess gene-by-environment interactions, each covariate was considered in a model that contained age, sex, SNP, covariate and a covariate-by-SNP interaction term.
Results
Serum uric acid levels were measured in 1468 African Americans and 1238 white subjects who were not on anti-gout medications. Analyses were based on the 1155 African American and 1132 white subjects with SNP information available. Of these, 1154 African American and 1034 white subjects also had urine urate levels. Table 1 describes the phenotypes and other characteristics in these two cohorts.
Table 1.
Characteristics of GENOA cohort
| Characteristics | African Americans (n = 1155) | Whites (n = 1132) |
|---|---|---|
| Phenotypes | ||
| Serum uric acid, mg/dl | 6.09 (1.77) | 6.08 (1.66) |
| Fractional excretion of urate | 0.047 (0.029) | 0.044 (0.019) |
| UUCR | 0.31 (0.18) | 0.30 (0.11) |
| Characteristics associated with serum uric acid levels and used in the full model | ||
| Age | 63.2 (9.5) | 58.9 (10.2) |
| Male sex, n (%) | 326 (28) | 489 (43) |
| BMI, kg/m2 | 31.7 (6.6) | 30.8 (6.3) |
| Diuretic use, n (%) | 529 (46) | 422 (37) |
| Homocysteine | 10.5 (5.3) | 9.8 (2.8) |
| Triglycerides | 118 (65.6) | 158 (96.7) |
| Other characteristics associated with serum uric acid levels | ||
| Waist circumference, cm | 104 (14.5) | 101 (15.8) |
| Hip circumference, cm | 116 (14.9) | 111 (12.1) |
| Systolic blood pressure, mmHg | 139 (21.1) | 131 (17.0) |
| Diastolic blood pressure, mmHg | 79.3 (10.8) | 74 (9.17) |
| Hypertension, n (%) | 919 (80) | 824 (73) |
| Any anti-hypertension medications, n (%) | 818 (71) | 784 (69) |
| Alcohol >30 oz/month, n (%) | 10 (0.9) | 48 (4.2) |
| Serum creatinine, mg/dl | 0.88 (0.32) | 0.89 (0.27) |
| Urine albumin-to-creatinine ratio, mg/g | 59.4 (309) | 9.80 (52.5) |
| Diabetes, n (%) | 342 (30) | 169 (15) |
| History of coronary disease | 74 (6.4) | 93 (8.2) |
| Physical activity scalea | −13.7 (4.7) | −10 (7.7) |
| Ever smoker, n (%) | 471 (41) | 566 (50) |
| CRP, mg/l | 0.63 (1.15) | 0.45 (0.70) |
| Fibrinogen, mg/dl | 369 (86) | 318 (78) |
| HDL cholesterol, mg/dl | 57.5 (17.8) | 51.8 (15.2) |
| Total cholesterol, mg/dl | 202 (41.3) | 197 (34.4) |
| Lipoprotein (A) | 62.4 (51.4) | 29.2 (36.7) |
| Statin use, n (%) | 216 (19) | 331 (29) |
| Losartan use, n (%) | 39 (3.3) | 59 (5.2) |
| Fenofibrate use, n (%) | 3 (0.3) | 15 (1.3) |
| Regular aspirin use, n (%) | 355 (33) | 430 (43) |
| Warfarin use, n (%) | 27 (2.5) | 22 (2.2) |
Values are represented as mean (s.d.), unless otherwise specified.
aPhysical activity scale was based on hours of moderate to heavy physical activity minus hours of sedentary activity.
The final covariates included in the fully adjusted models were age, sex, BMI, diuretic use, homocysteine level and triglycerides. After adjusting for these covariates, there was no significant difference between African American and white subjects in the serum uric acid levels or FEU levels. The UUCR levels in African American subjects were on average 0.13 lower than in white subjects with these adjustments. These covariates explained 31.5% of the variation in serum uric acid levels in African Americans and 42.5% in whites. Addition of any one other characteristic in Table 1 only improved the explained variation by ≤1.4% and addition of all the other characteristics only improved it by 2.3% in African Americans and 3.7% in whites after adjusting for the number of variables in the model (R2adj.).
Figure 1 shows the linkage disequilibrium map and multivariable-adjusted P-values for serum uric acid levels as predicted by 405 SNPs in the gene. The SLC2A9 gene had 24 haplotype blocks in African Americans and 10 haplotype blocks in whites. In the SLC2A9 gene, there were 53 SNPs in African Americans and 63 SNPs in whites that associated with serum uric acid levels in the multivariable-adjusted analyses. The association between SNPs and each phenotype are shown in supplementary table 1 (available as supplementary data at Rheumatology Online) for the 40 SNPs that had a genome-wide Bonferroni-corrected fully adjusted P-value of <0.01 for serum uric acid levels in either race group. The statistical significance of SNP associations with serum uric acid levels increased markedly with multivariable adjustment, but allele effect sizes did not change substantially. The association between these SNPs and FEU was less statistically significant and had a weaker standardized (per s.d.) allele effect size than was seen with serum uric acid. None of the associations between these SNPs and the UUCR phenotype were statistically significant.
Fig. 1.

Statistical significance (−log10 P-value) and linkage disequilibrium map (R2) for the SLC2A9 SNPs in the GENOA African American (blue, +) and white (red, o) cohorts for the serum uric acid phenotype adjusted for age, sex, BMI, diuretic use, homocysteine and triglycerides.
There were racial differences in the SNP alleles associated with serum uric acid levels (Fig. 2). In 67 (88%) of the 76 SNPs with a P-value ≤0.001 for either white or African American subjects, white subjects had a higher frequency of the allele associated with increased serum uric acid levels than African American subjects. The standardized (per s.d.) allele effect sizes in the latter half of the gene were generally larger in white subjects compared with African American subjects. However, the six largest allele effect sizes were in African American subjects. The P-values were also more statistically significant in the latter half of the gene in white subjects compared with the African American subjects. In contrast, in the first half of the gene, statistically significant SNPs were present in African American subjects and not in white subjects (Fig. 1). This finding was highlighted by racial difference in the statistical significance of five SNP haplotypes between the first half and second half of the gene (supplementary figure 1, available as supplementary data at Rheumatology Online).
Fig. 2.

The SLC2A9 gene comparing the position of statistically significant SNPs (fully adjusted P < 0.001 in either race group) to the increased serum uric acid allele frequency (A) and allele effect size (B) in the GENOA African American (blue, +) and white (red, o) cohorts.
The most statistically significant SNPs in African American subjects (rs13113918, Exon 5, synonymous) and white subjects (rs11723439, Intron 7) were in the latter half of the gene and explained 2.7 and 2.8% of the variation in serum uric acid, respectively. After adjustment for this SNP, 0.9% of the variation in serum uric acid in African American subjects was explained by an SNP in the first half of the gene (rs1568318, intron 12, bp 9 480 639) (Fig. 3). The allele associated with increased serum uric acid levels (T) for this SNP had a frequency of 0.642 and a standardized effect size of 0.146 (P = 8.4 × 10⁻⁵) in the fully adjusted model with further adjustment for rs13113918. This SNP was genotyped on the Affymetrics 6.0 platform and remained statistically significant with analysis limited to Affymetrics 6.0 data (P = 3.4 × 10⁻⁵) or with analysis using 45 YRI and 15 CUE samples to impute HapMap genotypes (P = 9.4 × 10⁻⁵).
Fig. 3.

The most statistically significant SNP in the SLC2A9 gene for the serum uric acid phenotype in GENOA African American subjects (blue, +, rs13113918) and white subjects (red, o, rs11723439) is labelled (A). After adjustment for this SNP, only African American subjects had a statistically significant SNP (rs1568318) as is labelled (B). Adjusting for this SNP revealed no further significant SNPs associated with this phenotype.
Gene-by-environment interactions with the two independent SNPs found in African American subjects and the most statistically significant SNP found in white subjects were assessed with the clinical characteristics in Table 1. The Bonferroni corrected P-value required for these interactions to achieve statistical significance in African American subjects was P < 0.0009 (2 SNPS and 29 characteristics) and in white subjects was P < 0.0017 (1 SNP and 29 characteristics). None of the interactions in either race achieved these levels of statistical significance.
Discussion
This study of the SLC2A9 gene variants associated with uric acid phenotypes revealed several important findings. First, SNPs in the SLC2A9 gene that were strongly associated with serum uric acid levels had weaker associations with FEU and no evident association with UUCR. This was surprising as we expected the SLC2A9 transporter gene variants to have the strongest association with the FEU phenotype. Secondly, we provide novel data on the association of SLC2A9 gene variants with serum uric acid levels in African Americans as compared with whites. Thirdly, we found no evident gene-by-environment interaction between SLC2A9 variants across multiple clinical characteristics associated with uric acid metabolism.
Serum uric acid levels reflect both the production and excretion of uric acid. The FEU and UUCR can be used to help distinguish between hyperuricaemia due to underexcretion (low FEU) and overproduction of uric acid (high UUCR). As expected, there was no evident association between a measure of uric acid production (UUCR) and SLC2A9 gene variants. Surprisingly, FEU had weaker standardized effect sizes with SLC2A9 gene variants than did serum uric acid. Vitart et al. [9] found that the most significant SLC2A9 SNPs for serum uric acid in their study were also associated with a low FEU (<0.066). Only a subset of their study cohort had urine urate levels measured and the relative strength of association with serum uric acid and FEU phenotypes was not evaluated [9]. Since SLC2A9 is a renal tubular transporter, we expected its variants to have the strongest association with FEU. There may be extrarenal effects of the SLC2A9 transporter [25]. Expression of SLC2A9 mRNA has been shown to occur in the liver in addition to the kidney [26]. Further, choleretic agents (e.g. secretin) have been shown to affect serum uric acid levels and clearance of urate in the bile of cholecystomized patients [27].
We observed clear differences between African American and white subjects in the localization, allele frequency and allele effect size on serum uric acid levels. The most statistically significant SNPs in both the African American and white subjects in this study were in the latter half of the SLC2A9 gene as previously reported by other investigators [9–13]. Dehghan et al. [13] reported the most significant SNP for serum uric acid to be rs16890979 in white populations. This SNP was the fourth most statistically significant in GENOA white subjects and was in strong linkage disequilibrium with the most statistically significant SNP in GENOA white subjects (R2 = 0.74). This SNP was less statistically significant in GENOA African Americans and was in moderate linkage disequilibrium with the most statistically significant SNP in GENOA African Americans (R2 = 0.23). We also found a novel independent locus within the first part of the SLC2A9 transporter gene that associated with serum uric acid levels in African American subjects but not in white subjects. Further studies are needed to determine whether this locus replicates in other populations of African ancestry.
Recent investigations have identified an SNP (rs3733591) that associates with serum uric acid levels and gout in Asian populations, but has no reported association in white populations [28, 29]. This SNP showed no evident association with serum uric acid levels in either GENOA African American subjects (fully adjusted P = 0.56) or in GENOA white subjects (fully adjusted P = 0.76). This SNP was also not in linkage disequilibrium with rs13113918 (R2 = 0.06) in white subjects or with rs11723439 (R2 = 0.004) and rs1568318 (R2 = 0.01) in African American subjects.
Pronounced effect modification of SLC2A9 variants by sex has been previously reported [10, 13]. We only found the interaction term between the most significant SNP in the SLC2A9 gene and the subject’s sex to be borderline statistically significant in white subjects (P = 0.011). This interaction was in the expected direction (a stronger association in women) and was more statistically significant in white subjects (P = 0.0014) when using the previously reported rs16890979 SNP [13]. This study thoroughly evaluated for evidence of effect modification by SLC2A9 on other clinical characteristics associated with hyperuricaemia. There was no clear evidence of any other gene-by-environment interactions. Other investigators have also reported absence of an interaction with obesity, alcohol intake and hypertension treatment [13], but we also found no evident interaction with homocysteine, lipids, kidney function, coronary disease, physical activity, diabetes, smoking, inflammatory markers and other medications that affect uric acid levels (fenofibrate, aspirin and warfarin). Importantly, dietary purine intake (primarily animal protein) was not available for analysis but this factor primarily influences uric acid production.
In conclusion, our findings further characterize the genetic variants of the SLC2A9 gene that influence uric acid metabolism. The stronger association of SLC2A9 variants with the serum uric acid phenotype than the FEU phenotype suggests that the SLC2A9 transporter could contribute to extrarenal clearance of urates. A novel locus in the first part of the SLC2A9 gene affecting serum uric acid was present in African American but not white subjects. The lack of gene-by-environment interactions with SLC2A9 gene variants suggests that many of the known risk factors for hyperuricaemia are not part of pathways that involve the SLC2A9 transporter.
Supplementary data
Supplementary data are available at Rheumatology Online.
Acknowledgement
Funding: This work was supported by United States Public Health Service Grants from the National Institutes of Health (K23 DK78229, R01 DK73537 and R01 HL 87660).
Disclosure statement: The authors have declared no conflicts of interest.
References
- 1.Forman JP, Choi H, Curhan GC. Plasma uric acid level and risk for incident hypertension among men. J Am Soc Nephrol. 2007;18:287–92. doi: 10.1681/ASN.2006080865. [DOI] [PubMed] [Google Scholar]
- 2.Short RA, Tuttle KR. Clinical evidence for the influence of uric acid on hypertension, cardiovascular disease, and kidney disease: a statistical modeling perspective. Semin Nephrol. 2005;25:25–31. doi: 10.1016/j.semnephrol.2004.09.005. [DOI] [PubMed] [Google Scholar]
- 3.Johnson RJ, Segal MS, Srinivas T, et al. Essential hypertension, progressive renal disease, and uric acid: a pathogenetic link? J Am Soc Nephrol. 2005;16:1909–19. doi: 10.1681/ASN.2005010063. [DOI] [PubMed] [Google Scholar]
- 4.Weiner DE, Tighiouart H, Elsayed EF, Griffith JL, Salem DN, Levey AS. Uric acid and incident kidney disease in the community. J Am Soc Nephrol. 2008;19:1204–11. doi: 10.1681/ASN.2007101075. [DOI] [PMC free article] [PubMed] [Google Scholar]
- 5.Obermayr RP, Temml C, Gutjahr G, Knechtelsdorfer M, Oberbauer R, Klauser-Braun R. Elevated uric acid increases the risk for kidney disease. J Am Soc Nephrol. 2008;19:2407–13. doi: 10.1681/ASN.2008010080. [DOI] [PMC free article] [PubMed] [Google Scholar]
- 6.Rathmann W, Haastert B, Icks A, Giani G, Roseman JM. Ten-year change in serum uric acid and its relation to changes in other metabolic risk factors in young black and white adults: the CARDIA study. Eur J Epidemiol. 2007;22:439–45. doi: 10.1007/s10654-007-9132-3. [DOI] [PubMed] [Google Scholar]
- 7.Mellen PB, Bleyer AJ, Erlinger TP, et al. Serum uric acid predicts incident hypertension in a biethnic cohort: the atherosclerosis risk in communities study. Hypertension. 2006;48:1037–42. doi: 10.1161/01.HYP.0000249768.26560.66. [DOI] [PubMed] [Google Scholar]
- 8.Merriman TR, Dalbeth N. The genetic basis of hyperuricaemia and gout. Joint Bone Spine. Advance Access published May 14, 2010. [DOI] [PubMed] [Google Scholar]
- 9.Vitart V, Rudan I, Hayward C, et al. SLC2A9 is a newly identified urate transporter influencing serum urate concentration, urate excretion and gout. Nat Genet. 2008;40:437–42. doi: 10.1038/ng.106. [DOI] [PubMed] [Google Scholar]
- 10.Doring A, Gieger C, Mehta D, et al. SLC2A9 influences uric acid concentrations with pronounced sex-specific effects. Nat Genet. 2008;40:430–6. doi: 10.1038/ng.107. [DOI] [PubMed] [Google Scholar]
- 11.Wallace C, Newhouse SJ, Braund P, et al. Genome-wide association study identifies genes for biomarkers of cardiovascular disease: serum urate and dyslipidemia. Am J Hum Genet. 2008;82:139–49. doi: 10.1016/j.ajhg.2007.11.001. [DOI] [PMC free article] [PubMed] [Google Scholar]
- 12.McArdle PF, Parsa A, Chang YP, et al. Association of a common nonsynonymous variant in GLUT9 with serum uric acid levels in old order Amish. Arthritis Rheum. 2008;58:2874–81. doi: 10.1002/art.23752. [DOI] [PMC free article] [PubMed] [Google Scholar]
- 13.Dehghan A, Kottgen A, Yang Q, et al. Association of three genetic loci with uric acid concentration and risk of gout: a genome-wide association study. Lancet. 2008;372:1953–61. doi: 10.1016/S0140-6736(08)61343-4. [DOI] [PMC free article] [PubMed] [Google Scholar]
- 14.Li S, Sanna S, Maschio A, et al. The GLUT9 gene is associated with serum uric acid levels in Sardinia and Chianti cohorts. PLoS Genet. 2007;3:e194. doi: 10.1371/journal.pgen.0030194. [DOI] [PMC free article] [PubMed] [Google Scholar]
- 15.Stark K, Reinhard W, Neureuther K, et al. Association of common polymorphisms in GLUT9 gene with gout but not with coronary artery disease in a large case-control study. PLoS One. 2008;3:e(1948). doi: 10.1371/journal.pone.0001948. [DOI] [PMC free article] [PubMed] [Google Scholar]
- 16.Hollis-Moffatt JE, Xu X, Dalbeth N, et al. Role of the urate transporter SLC2A9 gene in susceptibility to gout in New Zealand Maori, Pacific Island, and Caucasian case-control sample sets. Arthritis Rheum. 2009;60:3485–92. doi: 10.1002/art.24938. [DOI] [PubMed] [Google Scholar]
- 17.Augustin R, Carayannopoulos MO, Dowd LO, Phay JE, Moley JF, Moley KH. Identification and characterization of human glucose transporter-like protein-9 (GLUT9): alternative splicing alters trafficking. J Biol Chem. 2004;279:16229–36. doi: 10.1074/jbc.M312226200. [DOI] [PubMed] [Google Scholar]
- 18.Dinour D, Gray NK, Campbell S, et al. Homozygous SLC2A9 mutations cause severe renal hypouricemia. J Am Soc Nephrol. 2010;21:64–72. doi: 10.1681/ASN.2009040406. [DOI] [PMC free article] [PubMed] [Google Scholar]
- 19.Daniels PR, Kardia SL, Hanis CL, et al. Familial aggregation of hypertension treatment and control in the Genetic Epidemiology Network of Arteriopathy (GENOA) study. Am J Med. 2004;116:676–81. doi: 10.1016/j.amjmed.2003.12.032. [DOI] [PubMed] [Google Scholar]
- 20.Melton LJ., III History of the Rochester Epidemiology Project. Mayo Clin Proc. 1996;71:266–74. doi: 10.4065/71.3.266. [DOI] [PubMed] [Google Scholar]
- 21.Rock RC, Walker WG, Jennings CD. Nitrogen metabolites and renal function. In: TIetz NW, editor. Fundamentals of Clinical Chemistry. 3rd edition. Philadelphia: WB Saunders; 1987. pp. 684–6. [Google Scholar]
- 22.Li YA. Mach 1.0: rapid haplotype reconstruction and missing genotype inference. Am J Hum Genet. 2006;S79:2290. [Google Scholar]
- 23.de Andrade M, Atkinson E, Lunde E, Amos C, Chen J. Estimating genetic components of variance for quantitative traits in family studies using the multic routines. Rochester. Minnesota: Department of Health Science Research; 2006. [Google Scholar]
- 24.Barrett JC, Fry B, Maller J, Daly MJ. Haploview: analysis and visualization of LD and haplotype maps. Bioinformatics. 2005;21:263–5. doi: 10.1093/bioinformatics/bth457. [DOI] [PubMed] [Google Scholar]
- 25.So A, Thorens B. Uric acid transport and disease. J Clin Invest. 2010;120:1791–9. doi: 10.1172/JCI42344. [DOI] [PMC free article] [PubMed] [Google Scholar]
- 26.Phay JE, Hussain HB, Moley JF. Cloning and expression analysis of a novel member of the facilitative glucose transporter family, SLC2A9 (GLUT9) Genomics. 2000;66:217–20. doi: 10.1006/geno.2000.6195. [DOI] [PubMed] [Google Scholar]
- 27.Kountouras J, Magoula I, Tsapas G, Liatsis I. The effect of mannitol and secretin on the biliary transport of urate in humans. Hepatology. 1996;23:229–33. doi: 10.1053/jhep.1996.v23.pm0008591845. [DOI] [PubMed] [Google Scholar]
- 28.Urano W, Taniguchi A, Anzai N, et al. Association between GLUT9 and gout in Japanese men. Ann Rheum Dis. 2010;69:932–3. doi: 10.1136/ard.2009.111096. [DOI] [PubMed] [Google Scholar]
- 29.Tu HP, Chen CJ, Tovosia S, et al. Associations of a non-synonymous variant in SLC2A9 with gouty arthritis and uric acid levels in Han Chinese subjects and Solomon Islanders. Ann Rheum Dis. 2010;69:887–90. doi: 10.1136/ard.2009.113357. [DOI] [PubMed] [Google Scholar]