

Abstract
Secondary caries and restoration fracture remain common problems in dentistry. This study tested the hypothesis that combining nano-CaF2 and glass fillers would yield nanocomposites with high mechanical properties and F release. Novel CaF2 nanoparticles (56-nm) were synthesized via spray-drying and incorporated into resin. F release increased with increasing the nano-CaF2 content, or with decreasing pH (p < 0.05). F-release rates at 70-84 days were 1.13 µg/(cm2·day) and 0.50 µg/(cm2·day) for nanocomposites containing 30% and 20% nano-CaF2, respectively. They matched the 0.65 µg/(cm2·day) of resin-modified glass ionomer (p > 0.1). The nanocomposites had flexural strengths of 70-120 MPa, after 84-day immersion at pH 4, pH 5.5, and pH 7. These strengths were nearly three-fold that of resin-modified glass ionomer, and matched/exceeded a composite with little F release. In summary, novel CaF2 nanoparticles produced high F release at low filler levels, thereby making room in resin for reinforcement glass. This yielded nanocomposites with high F-release and stress-bearing properties, which may help reduce secondary caries and restoration fracture.
Keywords: dental nanocomposite, CaF2 nanoparticles, fluoride release, stress-bearing, dental caries
Introduction
Approximately 200 million dental restorations are placed annually in the US (ADA, 2002). Secondary caries and restoration fracture remain the two most common problems in dentistry (Sakaguchi, 2005; Sarrett, 2005). Caries at the restoration margins is a frequent reason for restoration replacement (Mjör et al., 2000), accounting for 50-70% of all restorations (Deligeorgi et al., 2001; Frost, 2002). Replacement dentistry costs $5 billion/year in the US (Jokstad et al., 2001).
Fluoride (F)-releasing materials have been extensively studied (Glasspoole et al., 2001; Kielbassa et al., 2003; Tyas, 2006; Ten Cate et al., 2008; Ling et al., 2009). It is hoped that the F ions can enrich tooth structure, promote remineralization, and inhibit demineralization. Glass ionomers, resin-modified glass ionomers, compomers, and composites (Asmussen and Peutzfeldt, 2002; Itota et al., 2004; Anusavice et al., 2005; Wiegand et al., 2007) have received much attention due to their release of F ions that can be incorporated into tooth mineral, resulting in fluoroapatite or F-enriched hydroxyapatite, both having reduced solubility.
The inferior mechanical properties of glass ionomers have limited their use. For traditional glass ionomers, “the most intractable problem is likely to be lack of strength and toughness” (Wilson and McLean, 1988). Resins were added to the matrix; however, this did not significantly overcome the drawbacks. Besides low strength and toughness, microhardness was not improved with the addition of resins, which was shown when traditional and resin-modified glass ionomers were immersed in water for 12 mos (Ellakuria et al., 2003). Therefore, there has been extensive effort to improve the F-releasing restoratives (Xu et al., 2000; Anusavice et al., 2005; Tyas, 2006; X Xu et al., 2006; Ling et al., 2009).
Composites are increasingly used because of their esthetics, direct-filling capability, and improved longevity. Resins and cure conditions, polymerization shrinkage, and fracture and wear resistance have been improved (Ferracane, 1995; Bayne et al., 1998; Lim et al., 2002; Watts et al., 2003; Lu et al., 2005; Drummond, 2008). Recently, CaF2 nanoparticles were synthesized and incorporated into resins (Sun and Chow, 2008; Xu et al., 2008). It has been determined that the oral plaque-pH after sucrose rinses can decrease to 4.5-4 (Hefferren and Koehler, 1981). A plaque-pH of above 6 is safe, pH of 6-5.5 is potentially cariogenic, and pH of 5.5-4 is cariogenic. However, studies are needed on the solution pH effects on the new CaF2 nanocomposites.
In this study, CaF2 nanoparticles were incorporated into resin with glass-reinforcing co-fillers. The objectives were to investigate the effects of nano-CaF2 filler level and solution pH on F-release and mechanical properties. Three hypotheses were tested: (1) Increasing the nano-CaF2 content will increase the F release, while glass reinforcement will provide the stress-bearing capability; (2) the new nanocomposite will be “smart”, to greatly increase the F release at acidic, cariogenic pH; and (3) the nanocomposite with sustained F release will match/exceed the strength of a commercial composite.
Materials & Methods
To synthesize nano-CaF2, we used a two-liquid nozzle to allow 2 solutions to be mixed during atomization: a calcium solution, Ca(OH)2, and a fluoride solution, NH4F (Sun and Chow, 2008). The solutions were atomized into a heated chamber: Ca(OH)2+NH4F→CaF2+NH4OH. The CaF2 nanoparticles were collected via an electrostatic-precipitator. NH4OH was removed as NH3 and H2O vapors. X-ray diffraction analysis confirmed that the powder was crystalline-CaF2. The CaF2 was examined by transmission electron microscopy (TEM, 3010 HREM, JEOL, Peabody, MA, USA) and multipoint-BET surface analyses (AUTOSORB-1, Quantachrome, Boynton Beach, FL, USA).
We used the CaF2 nanopowder to develop the nanocomposite. A barium-boroaluminosilicate glass (median particle diameter = 1.4 µm, Caulk/Dentsply, Milford, DE, USA) was silanized with 4% 3-methacryloxypropyltrimethoxysilane and 2% n-propylamine (mass%) (Xu, 2000). A monomer consisting of 48.975% Bis-GMA (bisphenol glycidyl dimethacrylate), 48.975% TEGDMA (triethylene glycol dimethacrylate), 0.05% 2,6-di-tert-butyl-4-methylphenol, and 2% benzoyl-peroxide formed part I, the initiator, of a two-part chemically activated resin. Part II, the accelerator resin, consisted of 49.5% Bis-GMA, 49.5% TEGDMA, and 1.0% N,N-dihydroxyethyl-p-toluidine.
Three nanocomposites were fabricated: composite with nano-CaF2 filler level (mass%) of 10% and 55% glass (referred to as Nanocomposite10CaF2); composite with 20% nano-CaF2 and 45% glass (Nanocomposite20CaF2); and composite with 30% nano-CaF2 and 35% glass (Nanocomposite30CaF2). They had the same total filler level of 65% to form a flowable paste. Equal masses of paste I and paste II were mixed and filled into a 2 × 2 × 25 mm3 mold. Specimens were incubated for 24 hrs at 37°C without immersion.
A commercial composite with nano-sized fillers (40-200 nm) and F release served as a control (Heliomolar, Ivoclar, Mississauga, ON, Canada). The fillers consisted of silica and ytterbium-trifluoride (total filler level = 66.7 mass%). Heliomolar is indicated for Classes I-V restorations. A resin-modified glass ionomer (Vitremer, 3M, St. Paul, MN, USA), another control, consisted of fluoroaluminosilicate glass, and a light-sensitive, aqueous polyalkenoic acid. Indications include Classes III and V and root-caries restoration, Classes I and II in primary teeth, and core-build-up. Following the manufacturer’s recommendation (Vitremer), a powder/liquid ratio of 2.5/1 was used (filler mass fraction = 71.4%). Both materials were photo-cured (Triad-2000, Dentsply, York, PA, USA) for 1 min/side in the 2 × 2 × 25 mm3 molds.
Specimens were tested in three-point flexure with a 20-mm span on a Universal Testing Machine (5500R, MTS, Cary, NC, USA). Flexural strength S = 3PmaxL/(2ab2), where Pmax is the maximum load, L is span, a is specimen width, and b is thickness. Elastic modulus E = (P/c)(L3/[4ab3]), where load P divided by displacement c is the slope of the load-displacement curve in the linear elastic region.
Following a previous study (Xu et al., 2009), a NaCl solution (133 mmol/L) was buffered to pH 4 with 50 mmol/L lactic acid, pH 5.5 with 50 mmol/L acetic acid, and pH 7 with 50 mmol/L HEPES. Three specimens of 2 × 2 × 12 mm3 were immersed in 50 mL solution (H Xu et al., 2006, 2007), yielding a specimen volume/solution of 2.9 mm3/mL (volume/volume = 0.29%), similar to the 3.0 mm3/mL used in a previous study (Skrtic et al., 1996). F concentration was measured at 1, 2, 3, 7, 14, 21, 28, 35, 42, 49, 56, 63, 70, 77, and 84 days. At each time, aliquots of 1 mL were removed and replaced by fresh solution. F concentration was measured with a fluoride ion-selective electrode (Orion, Cambridge, MA, USA) (Xu et al., 2008).
We performed one- and two-way ANOVA to detect significant effects. Tukey’s multiple comparison test was used at p = 0.05.
Results
The sizes of 200 nano-CaF2 particles (Fig. 1A) were measured with TEM, yielding a range of 15-335 nm, and a median particle size of 56 nm. This is consistent with BET measurement showing a specific surface area A = 35.5 m2/g. With CaF2 density ρ = 3.18 g/cm3, the equivalent spherical diameter d = 6/(Aρ) = 53 nm.
Figure 1.
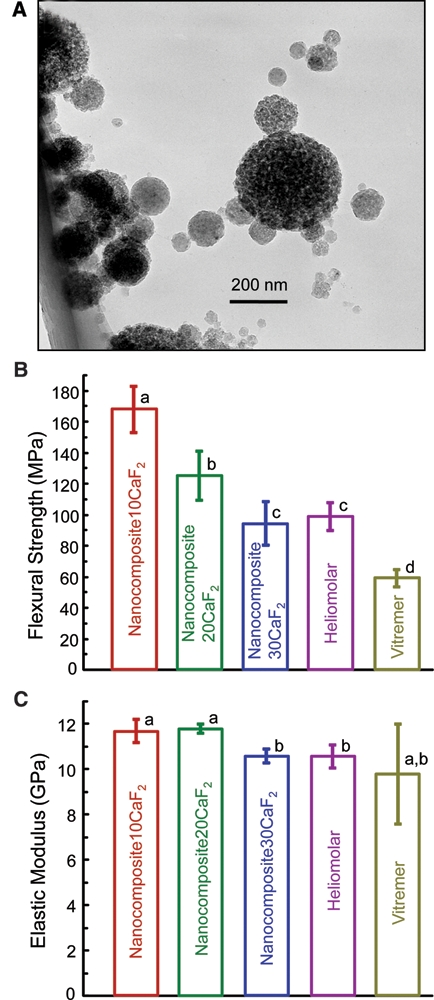
CaF2 nanoparticles and composite mechanical properties before immersion. (A) TEM micrograph of the new CaF2 nanopowder, with median particle size of 56 nm. (B) Flexural strength, and (C) elastic modulus, of nanocomposite, with dry specimens before immersion. Each value is the mean of 6 measurements, with the error bar showing 1 standard deviation (mean ± SD; n = 6). In each plot, bars with dissimilar letters indicate values that are significantly different from each other (p < 0.05).
Flexural strength and elastic modulus (Figs. 1B, 1C) of the nanocomposites before immersion were measured (mean ± SD; n = 6). Nanocomposite10CaF2 had the highest strength (p < 0.05), followed by Nanocomposite20CaF2. Nanocomposite30CaF2 had a strength similar to that of Heliomolar (p > 0.1).
After 84-day immersion at pH 4, pH 5.5, and pH 7 (Fig. 2), nanocomposite10CaF2 and Nanocomposite20CaF2 had similar strengths (p > 0.1); both were higher than those of Nanocomposite30CaF2 and Heliomolar (p < 0.05). Compared with the strengths before immersion (Fig. 1B), immersion for 84 days decreased the strength (p < 0.05). However, solution pH had no significant effect (p > 0.1).
Figure 2.
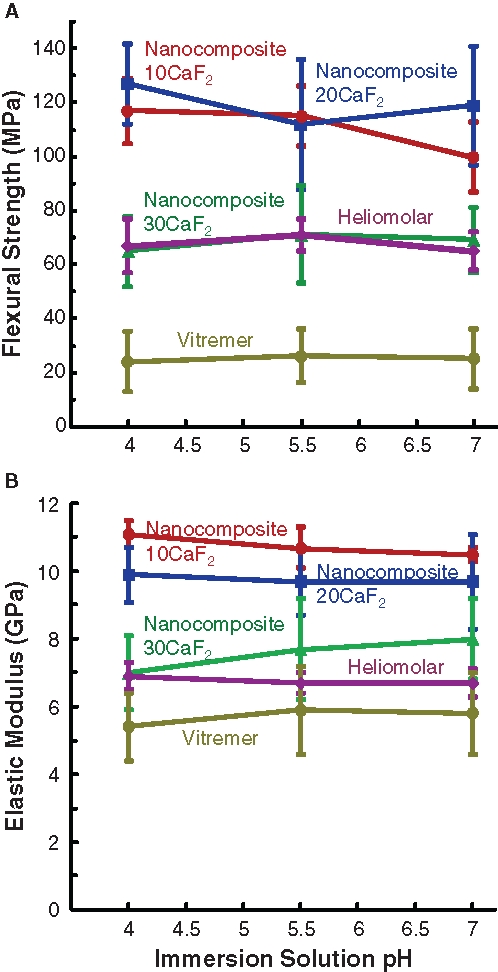
Mechanical properties after immersion. (A) Flexural strength, and (B) elastic modulus, of specimens immersed for 84 days in solutions of pH 4, pH 5.5, and pH 7. Each value is mean ± SD; n = 6. Each error bar shows 1 standard deviation. The nanocomposite with 10% nano-CaF2 + 55% glass (Nanocomposite10CaF2) and the nanocomposite with 20% CaF2 + 45% glass (Nanocomposite20CaF2) had the highest strengths. Heliomolar and the nanocomposite with 30% CaF2 + 35% glass (Nanocomposite30CaF2) had similar strengths, followed by that of Vitremer.
The cumulative F release (Fig. 3) increased with decreasing pH and increasing nano-CaF2 content. At 84 days and pH 4, F release was (327 ± 8) (µg/cm2) for Nanocomposite30CaF2, higher than that (252 ± 8) for Nanocomposite20CaF2 and that (47 ± 2) for Nanocomposite10CaF2 (p < 0.05). Vitremer had the highest (495 ± 42), while Heliomolar had 4.7 ± 0.1.
Figure 3.
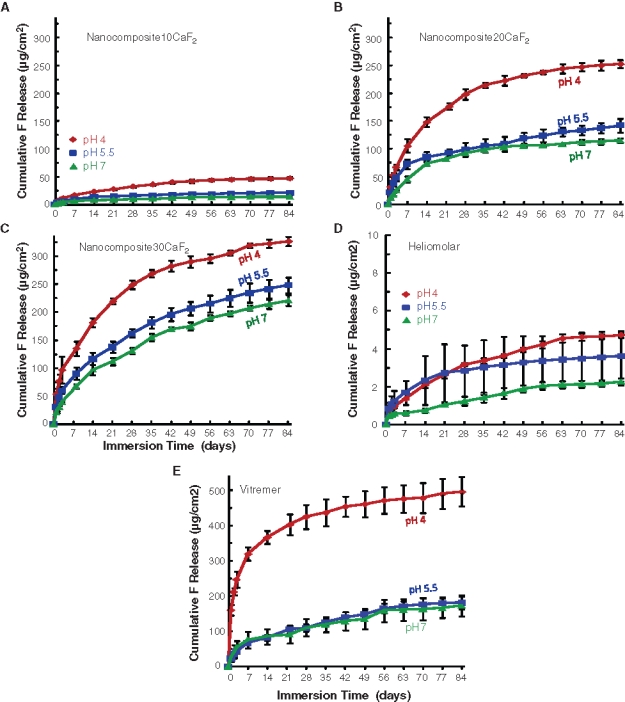
Cumulative fluoride ion (F) release. (A) Nanocomposite10CaF2. (B) Nanocomposite20CaF2. (C) Nanocomposite30CaF2. (D) Heliomolar. (E) Vitremer. Each value is mean ± SD; n = 3. Each error bar shows 1 standard deviation. Decreasing the pH significantly increased the F release (p < 0.05). Increasing the nano-CaF2 filler level from 10% to 30% also significantly increased the F release (p < 0.05).
F-release rates (per specimen surface area per day, µg/[cm2·day]) are shown for Nanocomposite10CaF2 (Fig. 4A) and Nanocomposite30CaF2 (Fig. 4B). The trend was the same for all materials, which showed a high initial F release, followed by a lower, steady-state release. The F-release rate decreased with increasing time for 7-9 wks. After 7-9 wks, the F-release rate plateaued, yielding similar F-release rates at different times (70, 77, and 84 days). Furthermore, the F-release rate at pH 4 was higher (p < 0.05) than those at pH 5.5 and pH 7 for the first 4-6 wks. After 4-6 wks, the release rates at all 3 pHs became similar. In addition, the F-releasing restoratives exhibited a high, initial-burst release, followed by a low long-term release rate. (The initial F-release rates are plotted in Fig. 4C.) Since the first 3 days had relatively high releases, we plotted the release rate at the middle point (day 2) to demonstrate the initial F release (at pH 4). After approximately 2 mos, a steady-state and long-term F-release was achieved, where the release rates became statistically similar at 70, 77, and 84 days (Figs. 4A, 4B). Therefore, for each material, the 9 release rates (at 3 pH values and 70, 77, and 84 days) were averaged and plotted (Fig. 4D). Nanocomposite30CaF2 and Nanocomposite20CaF2 had long-term F-release rates matching that of Vitremer (p > 0.1).
Figure 4.
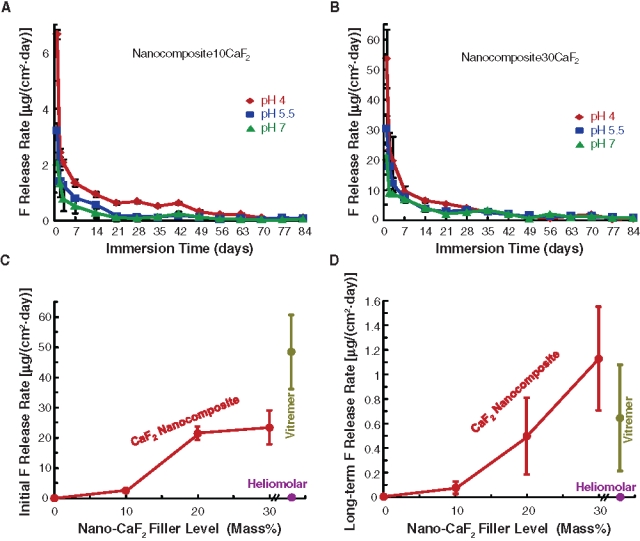
Fluoride release rate, which is the F release per specimen surface area per day (mean ± SD; n = 3). Each error bar shows 1 standard deviation. (A) Nanocomposite10CaF2 and (B) Nanocomposite30CaF2. (C) Initial F-release rates. Vitremer had the highest initial release [48.4 ± 12.3 µg/(cm2·day)], followed by 23.4 ± 5.6 for Nanocomposite30CaF2, 21.5 ± 2.2 for Nanocomposite20CaF2, 2.4 ± 0.2 for Nanocomposite10CaF2, and 0.17 ± 0.04 for Heliomolar (p < 0.05). (D) Long-term F-release rates were 1.13 ± 0.42 for Nanocomposite30CaF2, 0.65 ± 0.43 for Vitremer, and 0.50 ± 0.31 for Nanocomposite20CaF2 (p > 0.1). They were higher than 0.10 ± 0.05 of Nanocomposite10CaF2 and 0.006 ± 0.003 of Heliomolar (p < 0.05).
Discussion
In this study, novel CaF2 nanocomposites with glass reinforcement were developed. For specimens before immersion, the flexural strength decreased with glass fillers from 55% to 35%. This indicates that glass particles had a reinforcing effect. Previous studies showed that calcium-phosphate-releasing fillers did not reinforce the resin (Skrtic et al., 1996). Therefore, it is important to have reinforcing fillers in the resin, to develop caries-inhibiting, stress-bearing composites. As a result, Nanocomposite30CaF2 and Nanocomposite20CaF2 had flexural strengths matching/exceeding that of Heliomolar, and nearly 3-fold that of Vitremer.
After 84-day immersion, the composites had flexural strength losses of about 20-30%, compared with that before immersion. This is consistent with a previous study showing a strength loss of 20% after 56-day immersion (H Xu et al., 2006). These composites are stronger than previously reported ion-releasing composites. For example, the flexural strength of a resin with calcium-phosphate fillers was 30-40 MPa after 90-day immersion (Dickens et al., 2004); that of an amorphous calcium-phosphate composite was 40 MPa after 11-day immersion (Skrtic et al., 1996). In comparison, the nanocomposites of the present study had flexural strengths of 70-120 MPa after 84-day immersion. One reason that the CaF2 nanocomposite was stronger was that the CaF2 nanocomposite relied on glass fillers, not ion-releasing fillers, for reinforcement.
Besides strength and elastic modulus, fracture toughness, KIC, is another important property for dental composites. Therefore, additional bar specimens were made for Nanocomposite20CaF2, Heliomolar, and Vitremer. The specimens were immersed in water at 37ºC for 7 days, and the KIC was measured with a notch of approximately 700-µm depth (Xu, 2000). KIC in MPa·m1/2 (mean ± SD; n = 6) was 1.57 ± 0.15 for Nanocomposite20CaF2, significantly (p < 0.05) higher than 0.82 ± 0.05 for Heliomolar and 0.75 ± 0.20 of Vitremer. While the CaF2 particles might increase the fracture toughness, because they were likely less brittle than their glass counterparts, further study is needed to understand the toughening mechanism and how it affects composite longevity.
The high F release of nanocomposite was likely related to the nano-CaF2 surface area. Nano-CaF2 had a specific surface area of 35.5 m2/g. A traditional 1-µm CaF2 powder would have a surface area of 1.9 m2/g. Therefore, the nano-CaF2 had a nearly 20-fold-higher surface area. This likely contributed to the high F release, at a low CaF2 content of 20-30%, thereby making room in the resin for significant amounts of reinforcing glass fillers. It should be noted that due to some particle agglomeration, the surface area available for F release may be somewhat reduced.
Only a few previous studies investigated the pH effect on F release, while most studies used neutral pH. One study (Carey et al., 2003) showed that a glass ionomer had a higher F release at pH 4 than that at neutral pH in continuous flow. Another study (Anusavice et al., 2005) with commercial CaF2 showed that the initial F release was higher at pH 4 than pH 6; however, the long-term F releases at pH 4 and pH 6 were virtually the same. This is consistent with results from the present study, showing that the F-release rate was initially higher at pH 4. However, after 4-6 wks, the F-release rates at all 3 pHs became similar. A likely reason for this phenomenon is that there are two competing factors: (1) A lower pH would increase the F release from the CaF2 particles; and (2) a composite immersed at pH 4 would lose more F ions and decrease the near-surface F reservoir, compared with the same material immersed at pH 7. Initially, factor (1) would dominate, manifested by a higher F release at pH 4. Gradually, factor (2) would catch up and eventually cancel the effect of factor (1), yielding the net result that pH had little effect on further F release.
Since a plaque pH of 4.5-4 is cariogenic, it is desirable for the restoration to be “smart”, to increase the F release at pH 4, when these ions are most needed for caries inhibition. The materials of this study were smart to greatly increase the F release at pH 4; this happened in the first 4-6 wks. In this study, the material was immersed in a relatively large amount of acid (composite volume/acid volume = 0.29%), and the immersion was continuous. In vivo, the composite volume would be usually larger than the plaque-acid volume, and the acid duration would be short. The Stephan Curve shows that, following a glucose mouthrinse, the plaque pH stays at around 4 for several minutes, then starts to increase to 5 and 6, when the bacteria have completed their metabolism of the glucose, and the saliva has buffered the acid (Hefferren and Koehler, 1981). For the purpose of illustration, assume that the duration at pH 4 was 5 min each time, and this happens 10 times each day in vivo. Then, the six-week continuous immersion at pH 4 in vitro would correspond to 3.3 yrs in vivo. This is a simplified estimate, because it does not consider the potential for recharging the F reservoir, nor does it consider the potential that F release from cyclic low-pH insults might not follow a curve of continuous low pH.
In summary, novel nano-CaF2 composites with glass reinforcement were developed, and the effects of nano-CaF2 filler level and solution pH on F release and mechanical properties were investigated. The nano-CaF2 composites had long-term F-release rates matching that of a commercial resin-modified glass ionomer. The flexural strengths of the nano-CaF2 composites were nearly three-fold that of the resin-modified glass ionomer, and matched/exceeded that of a commercial composite with little F release. Therefore, the nano-CaF2 composites with high strength and sustained F release may have potential to reduce secondary caries and restoration fracture, two current challenges facing restorative dentistry.
Acknowledgments
We thank Esstech (Essington, PA, USA) for providing the monomers, Ivoclar (Mississauga, ON, Canada) and 3M (St. Paul, MN) for kindly providing materials, and Dr. J.M. Antonucci, M. Peltz, C. Ferraris, and B. Hockey at NIST for discussions and help.
Footnotes
This study was supported by NIH R01DE17974 (HX) and R01DE16416 (LC), by a Maryland Nano-Biotechnology Award (HX), by the University of Maryland Dental School, NIST, and the ADAF. Certain commercial materials and equipment are identified to specify experimental procedures. This does not imply recommendation by NIST/ADA.
References
- American Dental Association (ADA) (2002). The 1999 survey of dental services rendered. Chicago, IL: ADA Survey Center [Google Scholar]
- Anusavice KJ, Zhang NZ, Shen C. (2005). Effect of CaF2 content on rate of fluoride release from filled resins. J Dent Res 84:440-444 [DOI] [PubMed] [Google Scholar]
- Asmussen E, Peutzfeldt A. (2002). Long-term fluoride release from a glass ionomer cement, a compomer, and from experimental resin composites. Acta Odontol Scand 60:93-97 [DOI] [PubMed] [Google Scholar]
- Bayne SC, Thompson JY, Swift EJ, Jr, Stamatiades P, Wilkerson M. (1998). A characterization of first-generation flowable composites. J Am Dent Assoc 129:567-577 [DOI] [PubMed] [Google Scholar]
- Carey CM, Spencer M, Gove RJ, Eichmiller FC. (2003). Fluoride release from a resin-modified glass-ionomer cement in a continuous-flow system: effect of pH. J Dent Res 82:829-832 [DOI] [PubMed] [Google Scholar]
- Deligeorgi V, Mjör IA, Wilson NH. (2001). An overview of reasons for the placement and replacement of restorations. Prim Dent Care 8:5-11 [DOI] [PubMed] [Google Scholar]
- Dickens S, Flaim GM, Floyd CJE. (2004). Effect of resin composition on mechanical and physical properties of calcium phosphate filled bonding systems. Polymer Prepr 45:329-330 [Google Scholar]
- Drummond JL. (2008). Degradation, fatigue, and failure of resin dental composite materials. J Dent Res 87:710-719 [DOI] [PMC free article] [PubMed] [Google Scholar]
- Ellakuria J, Triana R, Minguez N, Soler I, Ibaseta G, Maza J, et al. (2003). Effect of one-year water storage on the surface microhardness of resin-modified versus conventional glass-ionomer cements. Dent Mater 19:286-290 [DOI] [PubMed] [Google Scholar]
- Ferracane JL. (1995). Current trends in dental composites. Crit Rev Oral Biol Med 6:302-318 [DOI] [PubMed] [Google Scholar]
- Frost PM. (2002). An audit on the placement and replacement of restorations in a general dental practice. Prim Dent Care 9:31-36 [DOI] [PubMed] [Google Scholar]
- Glasspoole EA, Erickson RL, Davidson CL. (2001). A fluoride-releasing composite for dental applications. Dent Mater 17:127-133 [DOI] [PubMed] [Google Scholar]
- Hefferren JJ, Koehler HM, editors (1981). Foods, nutrition and dental health. Park Forest South, IL: Pathotox Publishers [Google Scholar]
- Itota T, Carrick TE, Yoshiyama M, McCabe JF. (2004). Fluoride release and recharge in giomer, compomer and resin composite. Dent Mater 20:789-795 [DOI] [PubMed] [Google Scholar]
- Jokstad A, Bayne S, Blunck U, Tyas M, Wilson N. (2001). Quality of dental restorations. FDI Commission Projects 2-95. Int Dent J 51:117-158 [DOI] [PubMed] [Google Scholar]
- Kielbassa AM, Schulte-Monting J, García-Godoy F, Meyer-Lueckel H. (2003). Initial in situ secondary caries formation: effect of various fluoride-containing restorative materials. Oper Dent 28:765-772 [PubMed] [Google Scholar]
- Lim BS, Ferracane JL, Sakaguchi RL, Condon JR. (2002). Reduction of polymerization contraction stress for dental composites by two-step light-activation. Dent Mater 18:436-444 [DOI] [PubMed] [Google Scholar]
- Ling L, Xu X, Choi GY, Billodeaux D, Guo G, Diwan RM. (2009). Novel F-releasing composite with improved mechanical properties. J Dent Res 88:83-88 [DOI] [PMC free article] [PubMed] [Google Scholar]
- Lu H, Stansbury JW, Bowman CN. (2005). Impact of curing protocol on conversion and shrinkage stress. J Dent Res 84:822-826 [DOI] [PubMed] [Google Scholar]
- Mjör IA, Moorhead JE, Dahl JE. (2000). Reasons for replacement of restorations in permanent teeth in general dental practice. Int Dent J 50:361-366 [DOI] [PubMed] [Google Scholar]
- Sakaguchi RL. (2005). Review of the current status and challenges for dental posterior restorative composites: clinical, chemistry, and physical behavior considerations. Dent Mater 21:3-6 [DOI] [PubMed] [Google Scholar]
- Sarrett DC. (2005). Clinical challenges and the relevance of materials testing for posterior composite restorations. Dent Mater 21:9-20 [DOI] [PubMed] [Google Scholar]
- Skrtic D, Antonucci JM, Eanes ED. (1996). Improved properties of amorphous calcium phosphate fillers in remineralizing resin composites. Dent Mater 12:295-301 [DOI] [PubMed] [Google Scholar]
- Sun L, Chow LC. (2008). Preparation and properties of nano-sized calcium fluoride for dental applications. Dent Mater 24:111-116 [DOI] [PMC free article] [PubMed] [Google Scholar]
- ten Cate JM, Buijs MJ, Miller CC, Exterkate RA. (2008). Elevated fluoride products enhance remineralization of advanced enamel lesions. J Dent Res 87:943-947 [DOI] [PubMed] [Google Scholar]
- Tyas MJ. (2006). Clinical evaluation of glass-ionomer cement restorations. J Appl Oral Sci 14(Suppl):10-13 [DOI] [PubMed] [Google Scholar]
- Watts DC, Marouf AS, Al-Hindi AM. (2003). Photo-polymerization shrinkage-stress kinetics in resin-composites: methods development. Dent Mater 19:1-11 [DOI] [PubMed] [Google Scholar]
- Wiegand A, Buchalla W, Attin T. (2007). Review on fluoride-releasing restorative materials–fluoride release and uptake characteristics, antibacterial activity and influence on caries formation. Dent Mater 23:343-362 [DOI] [PubMed] [Google Scholar]
- Wilson AD, McLean JW. (1988). Glass-ionomer cement. Chicago, IL: Quintessence Publishing Co [Google Scholar]
- Xu HHK. (2000). Whisker-reinforced heat-cured dental resin composites: effects of filler level and heat-cure temperature and time. J Dent Res 79:1392-1397 [DOI] [PubMed] [Google Scholar]
- Xu HHK, Eichmiller FC, Antonucci JM, Flaim GM. (2000). Single-crystalline ceramic whisker-reinforced carboxylic acid-resin composites with fluoride release. Oper Dent 25:90-97 [PubMed] [Google Scholar]
- Xu HHK, Sun L, Weir MD, Antonucci JM, Takagi S, Chow LC, et al. (2006). Nano DCPA-whisker composites with high strength and Ca and PO4 release. J Dent Res 85:722-727 [DOI] [PMC free article] [PubMed] [Google Scholar]
- Xu HHK, Weir MD, Sun L. (2007). Nanocomposites with Ca-PO4 release: effects of reinforcement, dicalcium phosphate particle size and silanization. Dent Mater 23:1482-1491 [DOI] [PMC free article] [PubMed] [Google Scholar]
- Xu HHK, Moreau JL, Sun L, Chow LC. (2008). Strength and fluoride release characteristics of a calcium fluoride based dental nanocomposite. Biomaterials 29:4261-4267 [DOI] [PMC free article] [PubMed] [Google Scholar]
- Xu HHK, Weir MD, Sun L. (2009). Calcium and phosphate ion releasing composite: effect of pH on release and mechanical properties. Dent Mater 25:535-542 [DOI] [PMC free article] [PubMed] [Google Scholar]
- Xu X, Ling L, Wang R, Burgess JO. (2006). Formation and characterization of a novel fluoride-releasing dental composite. Dent Mater 22:1014-1023 [DOI] [PubMed] [Google Scholar]