Abstract
Background and Aims
At present most process-based models and the majority of three-dimensional models include simplifications of plant architecture that can compromise the accuracy of light interception simulations and, accordingly, canopy photosynthesis. The aim of this paper is to analyse canopy heterogeneity of an explicitly described tomato canopy in relation to temporal dynamics of horizontal and vertical light distribution and photosynthesis under direct- and diffuse-light conditions.
Methods
Detailed measurements of canopy architecture, light interception and leaf photosynthesis were carried out on a tomato crop. These data were used for the development and calibration of a functional–structural tomato model. The model consisted of an architectural static virtual plant coupled with a nested radiosity model for light calculations and a leaf photosynthesis module. Different scenarios of horizontal and vertical distribution of light interception, incident light and photosynthesis were investigated under diffuse and direct light conditions.
Key Results
Simulated light interception showed a good correspondence to the measured values. Explicitly described leaf angles resulted in higher light interception in the middle of the plant canopy compared with fixed and ellipsoidal leaf-angle distribution models, although the total light interception remained the same. The fraction of light intercepted at a north–south orientation of rows differed from east–west orientation by 10 % on winter and 23 % on summer days. The horizontal distribution of photosynthesis differed significantly between the top, middle and lower canopy layer. Taking into account the vertical variation of leaf photosynthetic parameters in the canopy, led to approx. 8 % increase on simulated canopy photosynthesis.
Conclusions
Leaf angles of heterogeneous canopies should be explicitly described as they have a big impact both on light distribution and photosynthesis. Especially, the vertical variation of photosynthesis in canopy is such that the experimental approach of photosynthesis measurements for model parameterization should be revised.
Keywords: 3D functional–structural model, light interception, photosynthesis, tomato, Solanum lycopersicum
INTRODUCTION
Physiological plant models have become an integral tool of plant science research. These models describe, at varying degrees of complexity, plant physiological processes that improve our understanding of plant functioning and help us develop new cultivation strategies (Fourcaud et al., 2008). Physiological models – or process-based models – usually focus on plant production and development, by describing biophysical processes as rates using ordinary differential equations or stochastic processes (Marcelis et al, 1998; Heuvelink, 1999, Gayler et al., 2006). Light interception is one of the most important functions, as it drives photosynthesis and, therefore, growth. Although highly dependent on canopy structure (Vos et al., 2010), light interception is usually computed in process-based models as a function of leaf area index (LAI) and extinction coefficient (Baldocchi et al., 2000; Lai et al., 2000). In most models the extinction coefficient is determined by fitting a Lambert–Beer law relationship to experimental data or is estimated as a function of a certain leaf-angle distribution. Although these approaches give a good estimation of total light interception of a crop, they fail to capture the effect of plant and canopy heterogeneity on light interception and, therefore, on photosynthesis (Vos et al., 2010). Since plant architecture is influenced by a number of processes (such as genotype, water availability, cultivation practices or diseases), models that explicitly describe the impact of these processes on plant architecture can be a useful tool in our understanding of such phenomena, for example the effect of wilting on light capture.
In recent years, techniques have become available for developing functional–structural plant models, which are also called ‘virtual plants’ that combine the modelling of physiological processes with the three-dimensional (3-D) architecture of the plant. This combination boosts the capability of models to simulate the interaction between plants and their environment (Hanan, 1997; Sievänen et al., 2000; Godin and Sinoquet, 2005; Vos et al., 2007). The 3-D plant structure is especially important for the description of light interception and, therefore, the photosynthetic capacity of plants. Three-dimensional models require a detailed quantification of plant structure in space (Vos et al., 2007). Plants are considered as the sum of distinct units called phytomers that are formed repeatedly based on a hierarchical system (Barthélémy and Caraglio, 2007). Static 3-D plants coupled with radiation models have proven to be valuable tools in investigating the effect of single-plant architecture as well as crop structure on light interception and canopy photosynthesis (Vos et al., 2010). Zheng et al. (2008) showed that certain plant types with steeper leaf angles exhibited a higher light penetration of the canopy when sun elevation was high. Therefore, even simple static virtual plants have a great potential for crop-breeding research.
Despite the advantage of virtual plant models over process-based models in their explicit description of plant architecture, in such models there is still often the necessity to approximate 3-D structure. Leaf angle is assumed either as constant (Najla et al., 2009) or to follow a spherical or ellipsoidal distribution (Rakocevic et al., 2000; Farque et al., 2001). This approach is mainly due to the tediousness and the time-consuming nature of the measurements involved (Fourcaud et al., 2008). Such an approach may give robust results in the case of crops that show a particularly regular and co-ordinated development, such as wheat and rice (Evers et al., 2005; Drouet and Pagès, 2007; Zheng et al., 2008). However, to fully understand the light distribution in the plant canopy and explore the full impact of crop architecture on light interception and photosynthesis of row crops with a high canopy (such as tomato), functional–structural models should incorporate a detailed description of all architectural parameters, in general, and leaf angles, in particular.
The aim of this research was to analyse the canopy heterogeneity of an explicitly described tomato canopy on horizontal and vertical light distribution and photosynthesis under direct and diffuse light conditions at different times of the year. To do so, a static functional–structural tomato model was developed and then used as a tool for analysing the impact of canopy heterogeneity.
MATERIALS AND METHODS
Experiment
A tomato (Solanum lycopersicum ‘Aranca’) crop was planted in December 2006 in a commercial greenhouse in Bleiswijk, The Netherlands (52°). Measurements were performed in July and August of 2007 when the plants were 1·75 m tall. During this period, the average temperature in the greenhouse was 17·5 °C, the average daytime CO2 concentration was 371 µmol mol−1 and the relative air humidity was set at 73 %. Daily outside global radiation was 40 MJ during the time of the experiment. Plants were grown in double rows, with rows oriented from north to south. The distance between the double rows was 1·2 m (path), the distance between each row of the double row (within the row distance) was 0·4 m and the distance between plants within the row was 0·3 m, resulting in a plant density of 4·1 stems m−2.
Measurements of architectural development
Each week for 6 weeks, angle, length, width, internode length and azimuth orientation of all leaves of five plants were manually measured weekly with a ruler and a protractor. Measurements were made during the morning (0900–1300 h). Leaf angle was determined as the angle of the leaf petiole with the horizontal at the leaf insertion point on the stem. The first leaf longer than 2 cm was defined as leaf number 1. Azimuth angle was determined as the leaf horizontal angle measured clockwise from a constant point defined as ‘north’. North (or 0 degrees) was defined as the point perpendicular to the plant rows when facing towards the inner side of the double row.
The tomato plant has composite leaves with 10–13 leaflets. Leaflet angle was measured on ten leaves at different canopy heights on six plants in total. The angle of the leaflet to the horizontal at the point that it connects to the petiole was defined as leaflet angle.
The crop leaf area was estimated non-destructively through leaf length and leaf width measurements at the widest point. The relationship between the area of a leaf and its length and width was estimated by taking photographs against a white background of 25 randomly chosen leaves from various canopy depths with a digital camera (Canon, IXUS 800 IS) positioned perpendicular to the leaf. A ruler was set next to the leaf for calibration of the image scale during image processing. ImageJ (National Institutes of Health, Bethesda, MD, USA) was used for image analysis. A relationship was established between leaf length and width, and leaf area. This relationship was used to calculate the LAI from length and width measurements on all dates. Leaflet length and leaflet area were also measured on these 25 leaves to establish a relationship between the leaflet length and leaflet area.
Light interception measurements
Photosynthetically active radiation (PAR) interception was measured with a 0·8-m light rod in the crop and a reference sensor above the crop (Sunscan, Delta-T, UK) under diffuse light conditions (overcast sky). The light rod was positioned perpendicular to the row and light interception was measured from the top to the bottom of the plant at 0·25-m height intervals. The measurements were repeated at eight selected spots in the crop, once a week for 7 weeks. Measurements were also taken in the middle between the double row and in the middle of the path. For these measurements the sensor was positioned parallel to the crop at three different plant heights (0·5 m, 1 m and at the base of the plant).
Photosynthesis measurements
Photosynthesis light-response curves were measured with the use of a portable open gas exchange measurement device (LCpro+, ADC, UK). PAR levels were set to 0, 100, 250, 500, 700 and 1400 µmol m−2 s−1. CO2 concentration and relative humidity were set to ambient greenhouse values (360 µmol mol−1 CO2 and 73 %, respectively). On three dates during the experiment, measurements were done on a leaf at two different canopy heights (upper and middle, respectively) on six plants and at three different dates during the experiment. Upper, middle and bottom canopy height layers were defined as intervals of 0·5 m from the top to the bottom of the canopy.
Model description
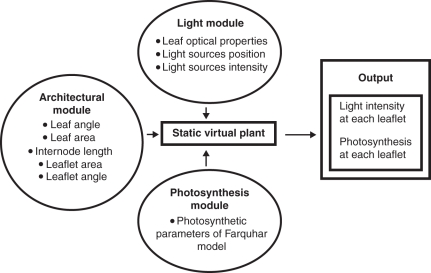
The functional–structural model presented here consists of three different modules (Fig.1).
Fig. 1.
Model flow chart.
The architectural module
This is a static model that describes the plant structure in space and the topology of the various organs, using the L-systems formalism (e.g. Prusinkiewicz, 1999).
A nested-radiosity module
The input of this module is the 3-D plant architecture and the position and the intensity of the light sources, using the model of Chelle and Andrieu (1998). The light emitted by the light sources is traced through the canopy and the light absorbed by each leaflet is given as an output.
The photosynthesis module
This module calculates gross photosynthesis based on the biochemical model of Farquhar (1980).
Architectural module
The basic structural unit of the module is the phytomer. A phytomer consists of an internode, a composite leaf and a bud containing an apex. The basic unit is repeated 27 times to form a complete plant. Every three leaves a generative shoot forms a flower truss. Trusses are not represented in the model. To account for the light interception from the trusses a fake truss was inserted every three leaves. This fake truss was represented as a small leaf with the same length as the length of the truss and the same number of leaves as the number of fruits. Relationships of the change of the leaf angle and length to the node number were established for each date. An average internode length of 7·5 cm was used for all plants.
The tomato plant has composite leaves that vary in size. Typical leaves consist of a large terminal leaflet and up to eight large lateral leaflets. Many smaller lateral leaflets may alternate with the large leaflets. The leaflets are usually petiolate and irregularly lobed, depending on the genotype (Atheron and Rudich, 1986). A representative leaf structure of the particular genotype in terms of leaflet number was chosen for the construction of the model and was measured in detail. The composite tomato leaf was modelled as a branch structure in which each leaflet is represented as a discrete lamina based on equations of leaflet angle (°) and leaflet area (cm2). Relationships of the leaflets angle to the leaf petiole, as well as the leaflet length to the leaf length, as determined in the experiment, were incorporated in the model.
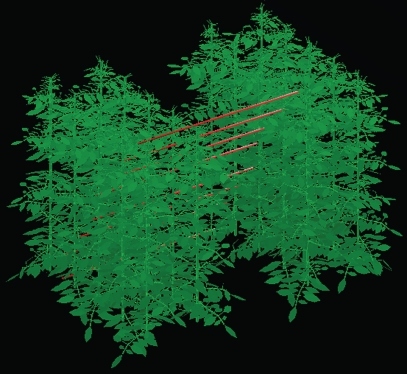
The above-mentioned relationships were derived from experimental measurements as described in the ‘Measurements of architectural development’ section. The visual output of the architectural model is presented in Fig. 2.
Fig. 2.
Example of the visual output of the 3-D tomato model. The basic unit of the model is two plant rows of five plants each. Lines along the path and the plant canopy represent the visual sensors used for the model calibration.
Radiosity module
PAR reaching the crop consists of a direct and a diffuse light component (Spitters, 1986). For the simulation of diffuse light conditions, 48 directional light sources were positioned uniformly in a hemisphere around the canopy, simulating a uniformly overcast sky. The light intensity of diffuse light conditions was 460 µmol PAR m−2 s−1. For the simulation of direct sunlight, a bright sky was simulated with light sources that were given x, y, z co-ordinates similar to the sun's trajectory on two distinct dates (21 December and 21 June). For direct light conditions, the intensity of the light sources at a half-hour time step, was derived from the 10-yearly average of light incidence on these dates under Dutch conditions (daily radiation was equal to 7 MJ d−1 in winter and equal to 50 MJ d−1 in summer). The nested radiosity module calculates the light absorbed by every leaflet, by using a radiosity approach for a basic crop unit and subsequent nesting of the unit to account for the surrounding canopy (Chelle and Andrieu, 1998). Multiple scattering was calculated on a canopy of 20 plants (as calculated by the architectural module). These 20 plants formed the basic model unit. In the nested radiosity module the basic unit is multiplied infinitely in space to preclude phenomena associated with border effects (e.g. too high levels of light incidence from the sides). Reflectance and transmittance of the full spectrum of the upper and lower sides of the tomato leaves were measured using an InstaSpec IV CCD spectrometer (Oriel, Stradford, CT, USA) and a LiCor 1800-12 integrating sphere (LICOR Inc., Lincoln, NE, USA). Twelve leaves from different canopy heights were measured in total and the average values were inputted into the model(upper side reflectance = 0·17, upper side transmittance = 0·06, lower side reflectance = 0·12, lower side transmittance = 0·03).
To validate the model with the measured data, ‘virtual’ sensors that were situated at the measurement spots were introduced to the model. These sensors were represented as surfaces with the same dimensions and optical properties as the Sunscan sensor and were positioned inside the canopy at the same heights with measured values.
To investigate the effect of leaf-angle distribution on light interception and photosynthesis, comparisons were made between our model (EXPL), which explicitly describes leaf angles, a 3-D model with a fixed leaf angle (–20° for all leaves in the canopy) (CONST) and a 3-D model with an ellipsoidal leaf-angle distribution (ELLIP, χ = 2·7 where χ is the ratio of the horizontal semi-axis length to the vertical semi-axis length of an ellipsoid) were made.
Photosynthesis module
Photosynthesis is calculated according to the biochemical model of Farquhar et al. (1980) on the basis of absorbed light. The module calculates photosynthetic rate at leaflet level according to the equation:
| (1) |
where pi is the intercellular partial pressure of CO2 in Pa, Γ is the CO2 compensation point in Pa, Rd the dark respiration in μmol CO2 m−2 s−1 and J is the rate of electron transport rate per unit leaf area and is calculated from the following equation:
| (2) |
where α and θ are coefficients from the data fitting, Jmax is the potential electron transport rate (μmol electrons μmol−1 photons) and I is the light absorbed by the leaflet surface (μmol m−2 s−1). Based on the measurements as described in ‘Photosynthesis measurements’, coefficients of the photosynthesis equations differed between the upper and the middle layer of the canopy. For the lower canopy, the same coefficients as in the middle canopy were assumed. For the upper canopy, the coefficient values were α = 0·1, θ = 0·69 and Jmax = 124·4 and for the middle and lower canopy layers α = 0·1, θ = 0·65 and Jmax = 75·18.
Model calculations for photosynthesis calibration showed a good correlation with the measured data at two different canopy heights (R2 = 0·93; data not shown).
Total canopy photosynthetic rate was compared between the model that explicitly describes leaf angles (EXPL), a 3-D model with a constant leaf angle (CONST) and a 3-D model with an ellipsoidal leaf-angle distribution (ELLIP). For the EXPL and ELLIP models, two different scenarios were investigated: (1) the photosynthesis parameters of the top of the plant were used for the whole canopy; (2) different photosynthetic parameters were attributed for the upper (0–0·75 m) layer and the middle and the bottom canopy layers (0·75–1·8 m). For all canopies, LAI was kept constant at 3·1.
Statistical analysis
Statistical analysis was performed with GenStat 12th edition. Regression analysis was applied to derive the various architectural and biochemical relationships implemented in the model, except for the parameters of the light-response curves of photosynthesis, which were derived from a mixed linear model.
RESULTS
Developing and calibrating the crop architecture module
Dynamics of structural properties of the crop remained more or less constant during the two months of the experiment. The upper leaves showed a positive leaf angle with respect to the horizontal, while the lower leaves showed a negative leaf angle. Below the tenth youngest phytomer, leaf angle did not vary with phytomer angle (Fig. 3A). Leaf length rapidly increased from the top to the 7th phytomer from 2 cm to 30 cm and then remained almost constant in the lower leaves (Fig. 3B). However, leaf area increased continuously from the top to the bottom of the canopy (Fig. 3C). Most leaves were positioned perpendicular to the plant row, towards the path and the middle of the plant row (Fig. 3D).
Fig. 3.

Relationship between (A) leaf angle to the horizontal plane, (B) leaf length, (C) leaf area in relation to phytomer number starting from the top of the plant and (D) leaf azimuth angle distribution. In (A–C) each symbol represents a specific week. In (D) the numbers represent the number of leaves per leaf orientation class.
Leaflet angles depended on leaflet position on the leaf petiole. The terminal leaflet had an angle of zero and the leaflets tended to be more erect towards the plant stem. Leaflets in tomato leaves occur in pairs opposite to each other. In Fig. 4A, every two leaflets represent one pair (i.e. leaflets 1 and 2 are one pair, etc.). There was no significant difference between the leaflet angles of the two leaflets of the same pair (Fig. 4A). A positive linear (0·43 + 0·52 × leaflet length; r2 = 0·88, P < 0·001) relationship was observed between leaflet length and leaflet area (Fig. 4B).
Fig. 4.
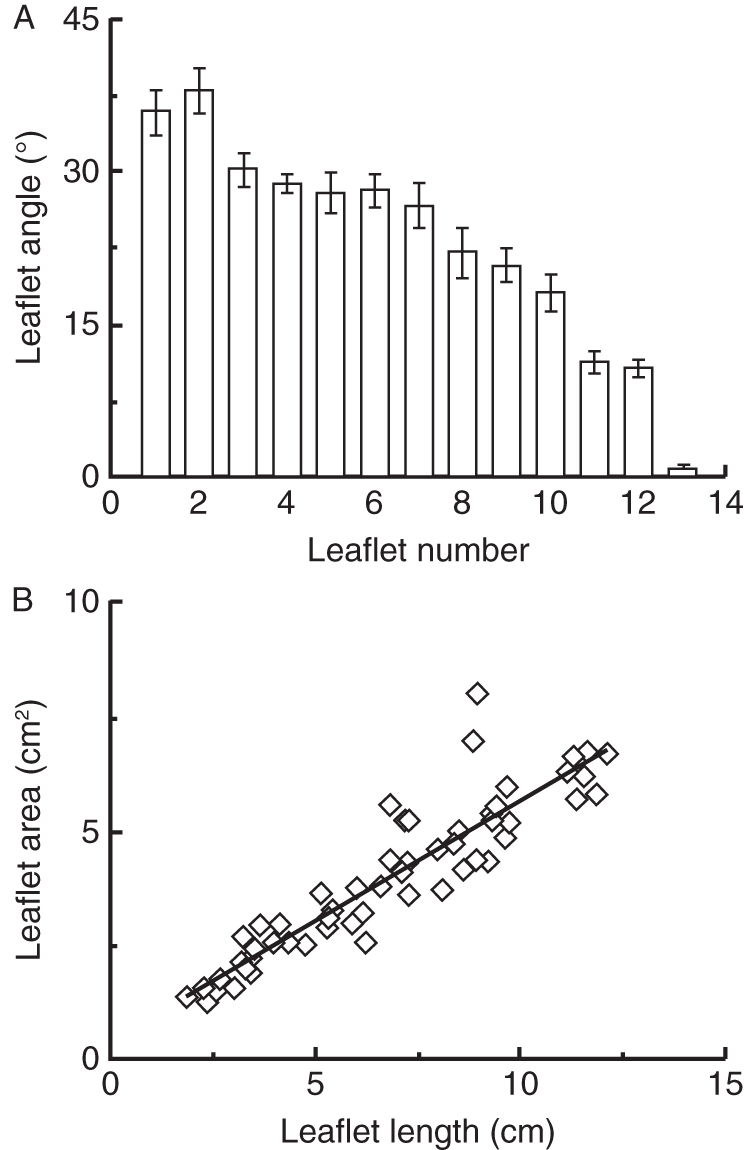
(A) Leaflet angle with respect to the horizontal in relation to the leaflet position on the leaf petiole. The position counting starts from the leaflets nearer to the stem and ends with the terminal leaflet. Every two leaflets form a pair positioned opposite to each other on the leaf petiole. Each column represents the average of ten leaves ± standard error of the mean. (B) Relationship of leaflet area to leaflet length (y = 0·15x + 0·25, R2 = 0·81). n = 10 leaves.
The above relationships were used to derive the parameters and equations of the architectural model.
Light interception
Light interception was measured and simulated for six dates. For each simulation date, crop structure was based on leaf area and leaf angles as measured on dates corresponding to the light measurements. Simulated light levels corresponded well to the measured data (Fig. 5). An underestimation of light interception was observed for simulated values at the top of the crop.
Fig. 5.
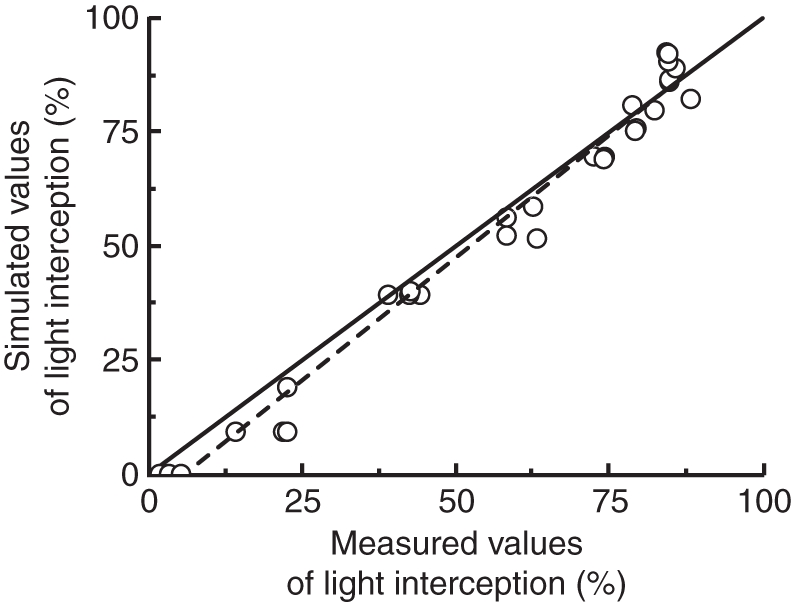
Measured vs. simulated values of light interception. Values are from 6 weeks of measurements in eight different canopy heights. The continuous line is 1 : 1.
In a comparison between EXPL, CONST and ELLIP models, no differences were found in total light interception, but differences were observed for the middle of the canopy. The use of a constant angle led to a 17 % underestimation of light interception under diffuse light conditions and a 23·6 % underestimation under direct light conditions compared with the EXPL model. Ellipsoidal distribution led to a 7·6 % and an 11 % underestimation under diffuse light conditions and direct light conditions, respectively (Table 1). These differences were observed only in the middle canopy layer.
Table 1.
Comparison of three different leaf angle modelling approaches with respect to effect on light interception and photosynthesis
| Light intercepted (%) |
Photosynthesis with one set of parameters (μmol m−2 s−1) |
Photosynthesis with two sets of parameters (μmol m−2 s−1) |
||||
|---|---|---|---|---|---|---|
| Leaf-angle distribution | Diffuse | Direct | Diffuse | Direct | Diffuse | Direct |
| Fixed angle (CONST) | 77 (43) | 80 (41) | 20 (8·8) | 27 (12·3) | ||
| Ellipsoidal distribution (ELLIP) | 77 (48) | 80 (47) | 24 (10·3) | 29·2 (12·9) | 21 (10·7) | 29·6 (13·2) |
| Explicitly described leaf angles (EXPL) | 77 (52) | 80 (55) | 27 (10·6) | 30·3 (13·2) | 24 (10·9) | 30·9 (13·7) |
Values for light interception and photosynthetic rate are for the total canopy. Values in parenthesis refer to the middle of the canopy (0·75–1·25 m from the top of the plant) where differences were observed. Direct light was calculated for 21 June. The light intensity for direct light conditions was derived from the 10-yearly average of light incidence on these dates under Dutch conditions (4·6 µmol m−2 s−1at sunrise, 3109 µmol m−2 s−1 at noon and 23 µmol m−2 s−1 at sunset). For diffuse light conditions a light intensity of 460 µmol m−2 s−1 was considered. Calculations were done when it was assumed that all leaves of the canopy had the same photosynthetic properties or with two sets of photosynthetic properties, where the properties of the top layer differed from those of the middle and lower layers.
To investigate the effect of the row crop on the horizontal light distribution and the simulation capabilities of the model, virtual sensors were positioned parallel to the crop row, in the middle of the space between two rows and in the middle of the path at three heights (Fig. 6). Light intensity decreased from the top to the bottom of the canopy and from the centre of the path to the row (Fig. 6). Taking into account the perpendicular positioning of the leaves to the plant row, leaves positioned towards the path absorbed more light per unit leaf area than leaves positioned towards the middle of the plant row (which received 30 %, 43 % and 88 % less in the upper, middle and bottom canopies, respectively). Simulation data showed an underestimation of the light intensity at the various plant heights compared with the measured data.
Fig. 6.
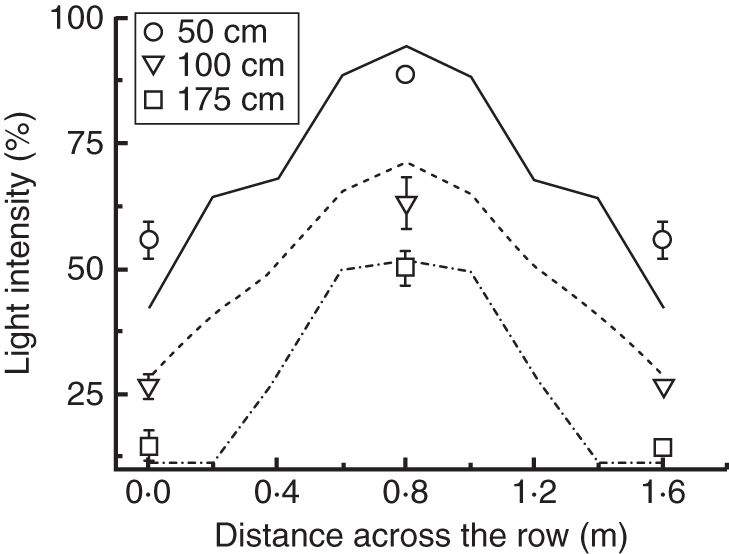
Measured and simulated horizontal light distribution in a tomato crop row. The light intensity is plotted against the plant row length at three different plant canopy heights (0·5, 1 or 1·75 m, as indicated). The lines represent simulated values while symbols represent measured values ± standard error of the mean. Plant rows are located at 20 cm and 140 cm while the middle of the path is located at 80 cm.
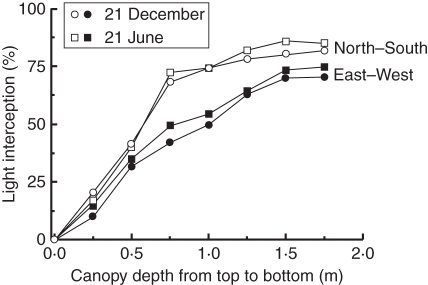
Both sun elevation and plant orientation to the sun's trajectory had an effect on light interception (Fig. 7). The fraction of light intercepted was in all cases higher during winter than summer. Light interception increased substantially for plant rows with a north–south orientation than plant rows with an east–west orientation. This trend was observed for both times of the year.
Fig. 7.
Seasonal variation in light interception for 21 December and 21 June for a north–south and east–west row orientation, as indicated. LAI was 3·1. Calculations were performed for exactly the same canopy structure on both dates.
Photosynthesis
To investigate the horizontal distribution of photosynthesis with the model, leaves pointing towards the path were chosen, like those upon which the manual measurements were performed. Leaves located in the higher canopy layer photosynthesized considerably more than those positioned in the middle or the bottom of the canopy. Differences in simulated photosynthesis were not observed between the middle and bottom simulated canopy layers, because the same photosynthetic parameters were used for these two layers and light levels were almost equal. In the higher canopy layer, photosynthesis increased rapidly from 8 to 35 µmol m−2 s−1 from the inside leaflets to the outer ones, while in the lower canopy layers photosynthesis ranged from 2·5 to 14·8 µmol m−2 s−1 (Fig. 8). The rate of the increase from the inside to the outer leaflets was relatively higher in the lower layer (4·3 and 6 for the higher and the lower layer, respectively). Total canopy photosynthesis differed in total 26 % (for diffuse light) and 11 % (for direct light) between the EXPL and CONST models (Table 1). Total photosynthesis differences between the EXPL and ELLIP model were 11 % (diffuse) and 4 % (direct light), respectively. For light interception differences simulated in the middle canopy layer, the CONST model led to a 16 % underestimation of photosynthesis under diffuse light conditions and to a 7 % underestimation under direct light conditions in comparison with the EXPL model. The ELLIP model led to a 3 % underestimation under diffuse and under direct light conditions compared with the EXPL (Table 1). The differences in photosynthetic rate when using the same photosynthetic parameters for all leaves compared with the use of two sets of photosynthetic parameters in top and middle leaves was 12·5 % and 1·3 % (for diffuse and direct light, respectively) for the ELLIP model and 11 % and 2 % (for diffuse and direct light, respectively) for the EXPL.
Fig. 8.
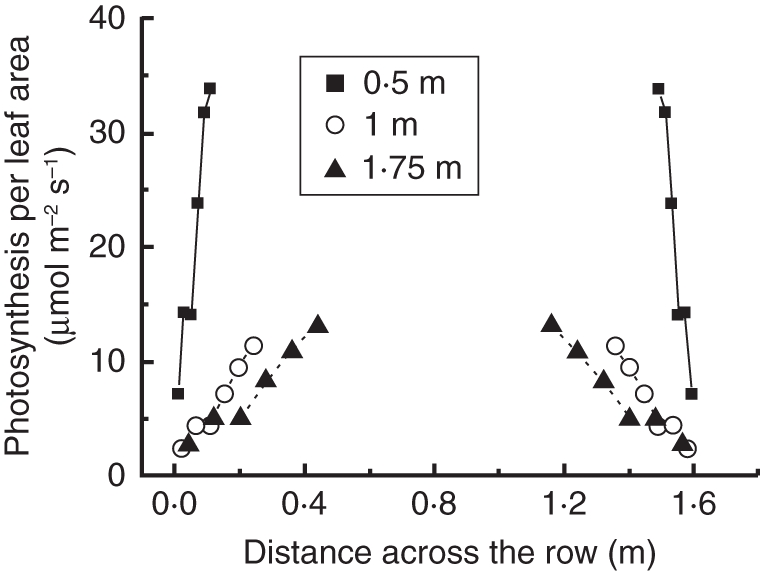
Horizontal distribution of photosynthesis in the crop path. In this graph only leaves positioned towards the path at three different canopy heights (0·5, 1 or 1·75 m, as indicated) are used. Each data point is the average of a pair of leaflets and includes the result from two or three leaves per plant from 20 plants depending on the leaves position. Simulation was performed under diffuse light conditions.
DISCUSSION
The aim of this research was to analyse the temporal dynamics of the horizontal and vertical light distribution and photosynthesis in relation to canopy heterogeneity under direct and diffuse light conditions.
The spatial position of plant organs has been studied in view of their possible adaptation to their local environment. Such strategies can aim either at maximization of plant production efficiency or at minimization of the impact of stress-inducing conditions, such as drought or light inhibition (Björkman and Powles, 1984). Leaf dimensions and especially leaf angles are important in assessing these plant strategies, as they are directly linked to the acquisition of light. Smaller and more upright leaves are found in the top of the canopy, which allows light penetration to the lower layers, while lower leaves have a higher area so as to ensure maximum light absorption (Pearcy et al., 1990). Since leaf angle is an important architectural phenotypic characteristic of a plant, it should be explicitly incorporated in functional–structural plant models. Dong et al. (2007) proposed a functional–structural tomato model in which leaf angle is randomized according to an ellipsoidal distribution. Najla et al. (2009) and Higashide (2009) used a fixed value to describe all leaf angles independent of their position in the canopy. These approaches assume a leaf distribution that is not affected by cultivation practices or the specific plant genotype. However, Sinoquet et al. (2005) showed that this is not the case and that likely factors for the deviation from the randomness in leaf positioning in a canopy can be linked to leaf size and angle. In this study, three leaf-angle distributions (CONST, ELLIP and EXPL) were compared and it was shown that the previous approaches to modelling leaf angle can lead to an underestimation of light interception in the middle canopy ranging from 4 % to 15 %, depending on the light conditions. Although light interception in the canopy is the same for all models, the change in the middle canopy layer led in photosynthesis simulation to differences of 3–8 %. Therefore, to correctly model the heterogeneity of plant canopy, leaf angles should be explicitly described.
Another point of importance in terms of plant architecture is the azimuth leaf orientation. Atherton and Rudich (1986) reported that, in a single tomato plant, leaves were evenly distributed around the stem with a phyllotaxis angle of 135°. The present data show that tomato plants grown in a row crop system tend to rearrange their leaves in a more systematic way, namely almost perpendicular to the plant row. Similar phenomena, where leaves are turned away from shady spots, have been reported for maize (Maddonni et al., 2002), trees (Cournède et al., 2008) and cucumber (Kahlen et al., 2008). Dauzat et al. (2008) observed that branch placement was density-dependent in cotton, and that at high densities sympodial and monopodial branches tended to orient towards the space between rows. This placement of leaves and branches is probably due to the plant's strategy for maximizing light interception and should also be taken into account when modelling plant architecture.
Row crop systems are the most common cropping systems used in horticultural and agronomic crops. This system, which was developed mainly to facilitate harvest and crop management, allows higher light penetration inside the plant canopy. In the present experiment, light intensity increased towards the middle of the path, as was also observed by Stewart et al. (2003) in maize and Louarn et al (2008) in grapevines. The present simulation showed that of the amount of light reaching the top of the canopy, 50 % reaches the ground floor in the middle of the path. Light direction combined with light intensity has a direct effect on light interception. A seasonal pattern in fraction of light intercepted has been reported for many species (Gilbert et al., 2003; Casella and Sinoquet, 2007). Light interception follows a seasonal pattern with, on average, a lower fraction of light intercepted during summer than during winter. A main factor is that solar elevation changes during the year. The higher solar elevation in summer months results in an orientation of light rays more perpendicular to the plant canopy, causing higher light penetration and lower interception. Interestingly, row orientation seems to affect substantially light interception with north–south orientation giving a higher light interception than east–west orientation. The same phenomenon has been reported by Palmer (1989) and Borger et al. (2010). Kahlen et al. (2008) reported that light direction and intensity are linked to a possible growth advantage of certain plant positions inside the canopy, mainly by leaf rearrangement towards the unshaded patches of the canopy or leaf photosynthetic acclimation to altered light status. Architectural adaptations of plants to the seasonal light patterns would, in this context, be worth investigating.
Leaf angle and vertical leaf distribution are highly relevant for the daily amount of photosynthesis as was shown in the results. An increase in light in lower canopy layers resulted in a higher relative increase in photosynthesis. A probable explanation for this is the leaf acclimation to lower light intensities and the physiological age in lower layers in the canopy (Niinemets, 2007). Leaves situated within the two rows received a substantially lower amount of light than leaves at the same height situated towards the path. If lower photosynthesis is partly an effect of acclimation to lower light levels, it stands to reason that leaves oriented towards the middle of the plant rows will have a lower photosynthetic rate than leaves at the same height that are oriented towards the path, and very likely different photosynthetic potential. A common experimental approach for photosynthesis is to take measurements only in the upper and middle canopy and only of leaves oriented towards the path. However, model calculations showed that the use of one more set of photosynthetic parameters can lead to a 7–10 % difference in photosynthesis prediction. So it stands to reason that when a significant part of the canopy is oriented towards the intra-row space with concomitant higher photosynthetic potential, predictions of crop photosynthesis will be inaccurate. Virtual plant models are able to cope with this, given the proper data. Chelle (2005) also pointed out the need for a new modelling approach that will combine the organ microclimate with the general plant environment. He demonstrated the temperature differences that can be measured at various plant organs and how the use of functional–structural plant models can improve our understanding of the effect of these differences on the plant processes. A similar approach should be used for photosynthesis modelling as it would improve our understanding of the impact of various crop strategies on photosynthesis.
Conclusions
Leaf angles of heterogeneous canopies should be explicitly described as they have a big impact both on light interception and on photosynthesis. Comparisons between 3-D models with explicitly described leaf angles and models with standard leaf-angle distributions resulted in differences of 4–15 %, depending on the light conditions and the number of the sets of photosynthetic parameters. In this frame, functional–structural models can play an important role in our understanding of light distribution along vertical and horizontal gradients caused by crop architecture. Such a tool can be useful in practise not only in yield prediction, but also in experimentation planning as well. However, steps should be taken to move from a static to a dynamic crop so as to incorporate the seasonal adaptation of the plants.
ACKNOWLEDGEMENTS
The authors thank the Greek State Scholarships Foundation for the scholarship awarded to V.S. The authors also thank G. Buck-Sorlin, who provided valuable comments on the manuscript.
LITERATURE CITED
- Atherton JG, Rudich J. The tomato crop: a scientific basis for improvement. London: Chapman and Hall; 1986. [Google Scholar]
- Baldocchi DD, Finnigan JJ, Wilson KW, Paw KT, Falge E. On measuring net ecosystem carbon exchange in complex terrain over tall vegetation. Boundary Layer Meteorology. 2000;96:257–291. [Google Scholar]
- Barthélémy D, Caraglio Y. Plant architecture: a dynamic, multilevel and comprehensive approach to plant form, structure and ontogeny. Annals of Botany. 2007;99:375–407. doi: 10.1093/aob/mcl260. [DOI] [PMC free article] [PubMed] [Google Scholar]
- Björkman O, Powles B. Inhibition of photosynthetic reactions under water stress: interaction with light level. Planta. 1984;161:490–504. doi: 10.1007/BF00407081. [DOI] [PubMed] [Google Scholar]
- Borger CPD, Hashem A, Pathan S. Manipulating crop row orientation to suppress weeds and increase crop yield. Weed Science. 2010;58:174–178. [Google Scholar]
- Casella E, Sinoquet H. Botanical determinants of foliage clumping and light interception in two-year-old coppice poplar canopies: assessment from 3-D plant mock-ups. Annals of Forest Science. 2007;64:395–404. [Google Scholar]
- Chelle M. Phylloclimate or the climate perceived by individual plant organs: What is it? How to model it? What for? New Phytologist. 2005;166:781–790. doi: 10.1111/j.1469-8137.2005.01350.x. [DOI] [PubMed] [Google Scholar]
- Chelle M, Andrieu B. The nested radiosity model for the distribution of light within plant canopies. Ecological Modelling. 1998;111:75–91. [Google Scholar]
- Cournède PH, Mathieu A, Houllier F, Barthélémy D, de Reffye P. Computing competition for light in the GREENLAB model of plant growth: a contribution to the study of the effects of density on resource acquisition and architectural development. Annals of Botany. 2008;101:1207–1219. doi: 10.1093/aob/mcm272. [DOI] [PMC free article] [PubMed] [Google Scholar]
- Dauzat J, Clouvel P, Luquet D, Martin P. Using virtual plants to analyse the light-foraging efficiency of a low-density cotton crop. Annals of Botany. 2008;101:1153–1166. doi: 10.1093/aob/mcm316. [DOI] [PMC free article] [PubMed] [Google Scholar]
- Dong QX, Wang XL, Yang LL, Barczi JF, De Reffye F. Greenlab tomato: a 3D architectural model of tomato development. New Zealand Journal of Agricultural Research. 2007;50:1229–1233. [Google Scholar]
- Drouet JL, Pagès L. GRAAL-CN: a model of growth, architecture and allocation for carbon and nitrogen dynamics within whole plants formalized at the organ level. Ecological Modelling. 2007;206:231–249. [Google Scholar]
- Evers JB, Vos J, Fournier C, Andrieu B, Chelle M, Struik PC. Towards a generic architectural model of tillering in Gramineae, as exemplified by spring wheat (Triticum aestivum) New Phytologist. 2005;166:801–812. doi: 10.1111/j.1469-8137.2005.01337.x. [DOI] [PubMed] [Google Scholar]
- Farque L, Sinoquet H, Colin F. Canopy structure and light interception in Quercus petraea seedlings in relation to light regime and plant density. Tree Physiology. 2001;21:1257–1267. doi: 10.1093/treephys/21.17.1257. [DOI] [PubMed] [Google Scholar]
- Farquhar GD, von Caemmerer S, Berry JA. A biochemical model of photosynthetic CO2 assimilation in leaves of C3 species. Planta. 1980;149:78–90. doi: 10.1007/BF00386231. [DOI] [PubMed] [Google Scholar]
- Fourcaud T, Zhang X, Stokes A, Lambers H, Körner C. Plant growth modelling and applications: the increasing importance of plant architecture in growth models. Annals of Botany. 2008;101:1053–1063. doi: 10.1093/aob/mcn050. [DOI] [PMC free article] [PubMed] [Google Scholar]
- Gayler S, Grams TEE, Kozovits AR, Winkler JB, Luedemann G, Priesack E. Analysis of competition effects in mono- and mixed cultures of juvenile beech and spruce by means of the plant growth simulation model PLATHO. Plant Biology. 2006;8:503–514. doi: 10.1055/s-2006-923979. [DOI] [PubMed] [Google Scholar]
- Gilbert RA, Heilman JL, Juo ASR. Diurnal and seasonal light transmission to cowpea in sorghum–cowpea intercrops in Mali. Journal of Agronomy and Crop Science. 2003;189:21–29. [Google Scholar]
- Godin C, Sinoquet H. Functional–structural plant modelling. New Phytologist. 2005;166:705–708. doi: 10.1111/j.1469-8137.2005.01445.x. [DOI] [PubMed] [Google Scholar]
- Hanan J. Virtual plants: integrating architectural and physiological models. Environmental Modelling and Software. 1997;12:35–42. [Google Scholar]
- Heuvelink E. Evaluation of a dynamic simulation model for tomato crop growth and development. Annals of Botany. 1999;83:413–422. [Google Scholar]
- Higashide T. Light interception by tomato plants (Solanum lycopersicum) grown on a sloped field. Agricultural and Forest Meteoreology. 2009;149:756–762. [Google Scholar]
- Kahlen K, Wiechers D, Stützel H. Modelling leaf phototropism in a cucumber canopy. Functional Plant Biology. 2008;35:876–884. doi: 10.1071/FP08034. [DOI] [PubMed] [Google Scholar]
- Lai CT, Katul G, Ellsworth D, Oren R. Modelling vegetation–atmosphere CO2 exchange by a coupled Eulerian–Lagrangian approach. Boundary-Layer Meteorology. 2000;95:91–122. [Google Scholar]
- Louarn G, Lecoeur J, Lebon E. A three-dimensional statistical reconstruction model of grapevine (Vitis vinifera) simulating canopy structure variability within and between cultivar/training system pairs. Annals of Botany. 2008;101:1167–1184. doi: 10.1093/aob/mcm170. [DOI] [PMC free article] [PubMed] [Google Scholar]
- Maddonni GA, Otegui ME, Andrieu B, Chelle M, Casal JJ. Maize leaves turn away from neighbors. Plant Physiology. 2002;130:1181–1189. doi: 10.1104/pp.009738. [DOI] [PMC free article] [PubMed] [Google Scholar]
- Marcelis LFM, Heuvelink E, Goudriaan J. Modelling of biomass production and yield of horticultural crops: a review. Scientia Horticulturae. 1998;74:83–111. [Google Scholar]
- Najla S, Vercambre G, Pagès L, Grasselly D, Gautier H, Génard M. Tomato plant architecture as affected by salinity: descriptive analysis and integration in a 3-D simulation model. Botany. 2009;87:893–904. [Google Scholar]
- Niinemets U. Photosynthesis and resource distribution through plant canopies. Plant, Cell & Environment. 2007;30:1052–1071. doi: 10.1111/j.1365-3040.2007.01683.x. [DOI] [PubMed] [Google Scholar]
- Palmer JW. The effects of row orientation, tree height, time of year and latitude on light interception and distribution in model apple hedgerow canopies. Journal of Horticultural Scence. 1989;64:137–145. [Google Scholar]
- Pearcy R, Roden J, Gamon J. Sunfleck dynamics in relation to canopy structure in a soybean (Glycine max (L.) Merr.) canopy. Agricultural and Forest Meteorology. 1990;52:359–372. [Google Scholar]
- Prusinkiewicz P. A look at the visual modelling of plants using L-systems. Agronomie. 1999;19:211–224. [Google Scholar]
- Rakocevic M, Sinoquet H, Christophe A, Varlet-Grancher C. Assessing the geometric structure of a white clover (Trifolium repens) canopy using 3D digitizing. Annals of Botany. 2000;86:519–526. [Google Scholar]
- Sievänen R, Nikinmaa E, Nygren P, Ozier-Lafontaine H, Perttunen J, Hakula H. Components of functional–structural tree models. Annals of Forest Science. 2000;57:399–412. [Google Scholar]
- Sinoquet H, Sonohat G, Phattaralerphong J, Godin C. Foliage randomness and light interception in 3D digitized trees: an analysis of 3D discretization of the canopy. Plant, Cell & Environment. 2005;29:1158–1170. [Google Scholar]
- Spitters CJT, Toussaint HAJM, Goudriaan J. Separating the diffuse and direct component of global radiation and its implications for modeling canopy photosynthesis Part I. Components of incoming radiation. Agricultural and Forest Meteorology. 1986;38:217–229. [Google Scholar]
- Stewart DW, Costa C, Dwyer LM, Smith DL, Hamilton RI, Ma BL. Canopy structure, light interception and photosynthesis in maize. Agronomy Journal. 2003;95:1465–1474. [Google Scholar]
- Vos J, Marcelis L, de Visser P, Struik P, Evers J. Functional–structural plant modelling in crop production. Berlin: Springer; 2007. [Google Scholar]
- Vos J, Evers JB, Buck-Sorlin GH, Andrieu B, Chelle M, de Visser PHB. Functional–structural plant modelling: a new versatile tool in crop science. Journal of Experimental Botany. 2010;61:2101–2115. doi: 10.1093/jxb/erp345. [DOI] [PubMed] [Google Scholar]
- Zheng B, Shi L, Ma Y, Deng Q, Li B, Guo Y. Comparison of architecture among different cultivars of hybrid rice using a spatial light model based on 3-D digitizing. Functional Plant Biology. 2008;35:900–910. doi: 10.1071/FP08060. [DOI] [PubMed] [Google Scholar]


