Abstract
This paper examines an updated version of a lumped mucosal wave model of the vocal fold oscillation during phonation. Threshold values of the subglottal pressure and the mean (DC) glottal airflow for the oscillation onset are determined. Depending on the nonlinear characteristics of the model, an oscillation hysteresis phenomenon may occur, with different values for the oscillation onset and offset threshold. The threshold values depend on the oscillation frequency, but the occurrence of the hysteresis is independent of it. The results are tested against pressure data collected from a mechanical replica of the vocal folds, and oral airflow data collected from speakers producing intervocalic ∕h∕. In the human speech data, observed differences between voice onset and offset may be attributed to variations in voice pitch, with a very small or inexistent hysteresis phenomenon.
INTRODUCTION
About two decades ago, Titze (1988) introduced a lumped mucosal wave model of the vocal folds to analyze their oscillation dynamics during phonation. This simple model represents the oscillatory motion as a surface wave propagating through the tissues in the direction of the airflow. Originally, it was formulated for small amplitude oscillations, which allowed neglecting nonlinear factors at large amplitudes such as nonlinear characteristics of tissue biomechanics, air pressure losses for flow viscosity when the glottis is narrow, and collision between the opposite vocal folds with consequent interruption of the air flow. It also assumed a small time delay for the surface wave to travel along the glottal channel, which reduced the model to an ordinary differential equation. Both restrictions were valid for analyzing the main mechanisms that cause the oscillations and determining conditions for phonation onset. Later works, reported below, have extended the model to large amplitude oscillations and arbitrary time delays, expanding its range of applicability to the extent of full simulations of vocal fold oscillation. This paper will revisit the mucosal wave model and its recent extensions, with the purpose of updating our interpretation of its oscillatory dynamics.
In his modeling work, Titze (1988) showed that a minimum positive value of the lung pressure (or the subglottal pressure), called the phonation threshold pressure, is required to start the oscillation. At the threshold pressure, the airflow transfers enough energy to the vocal folds to overcome the losses by dissipation in the tissues, and so an oscillation of growing amplitude may start. The value of the threshold pressure decreases by reducing the tissue damping and the mucosal wave velocity, by increasing the vocal fold height, by adducting the vocal folds, and by coupling the larynx to an inertive vocal tract. The theoretical results were later verified with experimental data (Titze et al., 1995;Chan et al., 1997;Chan and Titze, 2006).
The phonation threshold pressure is a critical parameter of voice aerodynamics (Titze, 1992) and its clinical relevance has been investigated in several studies (e.g., Fisher and Swank, 1997; Verdolini et al., 2002). In recent papers (Jiang and Tao, 2007; Tao and Jiang, 2008), it has been argued that pressure is a parameter difficult to measure because it demands invasive means; and even though some noninvasive techniques have been proposed, they are difficult to apply to untrained subjects. As an alternative, the phonation threshold value of the air flow was suggested as a new critical aerodynamic parameter, and an equation for it was derived from Titze’s model.
Several experimental studies of the vocal fold oscillation (e.g., Titze et al., 1995;Berry et al., 1996; Chan et al., 1997; Plant et al., 2004; Ruty et al., 2007) have shown that, after the oscillation has started, the subglottal pressure may be reduced without causing interruption of phonation. Therefore, two different pressure thresholds exist: the onset threshold, given by Titze’s equation, and a lower offset threshold. Titze’s model, however, is not appropriate for studying what happens with the oscillation after its onset, because of its conception as a small amplitude representation. Setting a constant value of the subglottal pressure above the oscillation onset threshold produces an oscillation of growing amplitude until reaching the condition of glottal closure and interruption of the airflow, where the model is no longer valid. Thus, it is not capable of creating a stable oscillation of a constant amplitude.
A mechanism for limiting the oscillation amplitude was proposed by incorporating a more detailed description of glottal aerodynamics (Lucero, 1999). As the amplitude grows larger, the airflow detaches from the vocal fold walls when the glottal channel is divergent, and the vocal folds are less able to absorb energy from the flow. Using this large amplitude extension, it was shown that the oscillation threshold may be described as a subcritical Hopf bifurcation: As the lung pressure increases, a stable equilibrium position becomes unstable and an unstable limit cycle is absorbed. Further, the unstable limit cycle coalesces and cancels with a stable limit cycle in a cyclic fold bifurcation. As a result, an oscillation hysteresis phenomenon (Appleton and van der Pol, 1922) is produced: The onset is produced at a larger value of the lung pressure than the offset.
A different approach to limit the growth of the oscillation has been introduced by Laje et al. (2001). Instead of modeling individual factors, such as airflow separation (Lucero, 1999) and glottal closure (Drioli, 2005), an ad-hoc nonlinear damping term was added to the equations which accounts for all the nonlinear factors that appear at large amplitudes. This model has been successfully applied to the labia oscillation in the syrinx of songbirds in a large collection of published works (e.g., Laje et al., 2002; Laje and Mindlin, 2005; Amador and Mindlin, 2008; Sitt et al., 2008). An analysis of its oscillation dynamics indicated that, although the model as originally formulated is not capable of producing an oscillation hysteresis, proper modifications of the form of the nonlinear damping term may allow it (Lucero, 2005).
Another restriction in Titze’s mucosal wave model, and in the above large amplitude extensions, is a small time delay for the tissue wave to travel along the glottal channel. A consequence of that restriction is that the oscillation threshold pressure is independent of the oscillation frequency (Lucero and Koenig, 2007). It is well known that a larger effort is required to vocalize at higher voice pitches; i.e., phonation threshold pressure increases with oscillation frequency (Titze, 1992). When the restriction is lifted, advance and delay terms appear in the model. This extended model produces the right phonation threshold pressure vs frequency characteristics, and their accuracy has been verified using experimental measures of the oscillation (Lucero et al., 2009). The existence of a Hopf bifurcation at the oscillation onset for arbitrary time delays was also proved analytically (Lucero and Koenig, 2007); however, the type of bifurcation was left undetermined.
Avanzini’s (2008) and Drioli’s (2005) models may also be mentioned here. Although they are not direct derivations from Titze’s mucosal wave model, they still represent the oscillation in terms of the delayed propagation of the tissue motion along the glottal channel. Both models use more sophisticated aerodynamic equations, similar to the two-mass model of the vocal folds (Ishizaka and Flanagan, 1972) and may be used for full simulations of the oscillation and voice synthesis.
This paper intends to answer some questions that remain from the above previous studies. First, the model of Laje et al. (2001) is attractive in its simplicity, and its applicability to phonation deserves further examination. Another question concerns the occurrence of oscillation hysteresis at arbitrary time delays of the mucosal wave. The hysteresis requires a subcritical Hopf bifurcation at oscillation onset; does the type of bifurcation depend on the time delay? Finally, the suggestion by Jiang and Tao (2007) for considering airflow, instead of pressure, must also be analyzed. Does the phonation threshold flow depend on the oscillation frequency? And further, do two different flow threshold values exist, for phonation onset and offset, respectively?
To answer those questions, a general model for both arbitrary oscillation amplitude and arbitrary time delays will be used. Next, a harmonic balance method (MacDonald, 1993; Mickens, 1996) will be applied to approximate an oscillatory solution and analyze its dynamics. The theoretical results will be finally compared to experimental data obtained from a mechanical replica of the vocal folds, and from subjects producing speech.
VOCAL FOLD MODEL
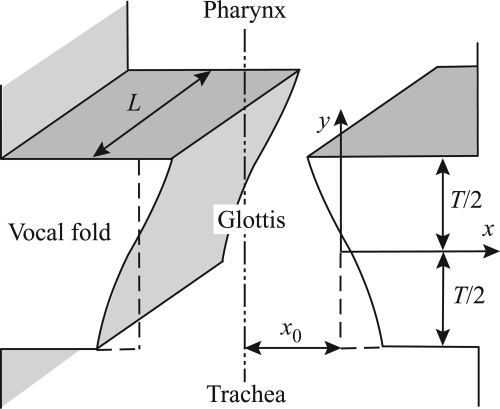
The mucosal wave model is schematically shown in Fig. 1 (Titze, 1988). It assumes complete right–left symmetry and allows for motion of tissues only in the horizontal direction. A wave propagates through the superficial tissues, in the direction of the airflow (upward).
Figure 1.
Mucosal wave model of the vocal folds (Titze, 1988).
The biomechanical properties of the tissues are lumped at the midpoint of the glottis, which results in the equation of motion,
| (1) |
where x is the tissue displacement, M, B, and K are the mass, damping and stiffness, respectively, per unit area of the vocal fold medial surface, and Pg is the glottal mean air pressure. The glottal aerodynamics is modeled by assuming that the flow is frictionless, stationary, and incompressible. Up to the glottal exit, the airflow follows Bernoulli’s law, and at the glottal exit all the flow energy is lost due to turbulence. Also, all the loads presented by the sub- and supraglottal vocal tracts are neglected, so the subglottal pressure Ps is equal to a constant (or slowly varying) lung pressure, and the pressure at the glottal exit is atmospheric. Under such conditions, the glottal mean air pressure is
| (2) |
where Ps is the subglottal pressure, kt is a transglottal pressure coefficient, and a1 and a2 are the cross-sectional glottal areas at the lower and upper edges of the vocal folds, respectively. Further, the glottal areas are given by
| (3) |
| (4) |
where L is the vocal fold length, x0 is the vocal fold displacement at rest (prephonatory position), and τ is the time delay for the surface wave to travel half the glottal height T. The above equations describe the mucosal wave model in its most basic configuration.
Assuming τ small enough, the approximation may be used, which reduces the model to an ordinary differential equation. Here, the general case of an arbitrary time delay is considered, and two modifications to the equations are introduced. First, following Laje et al. (2001), a nonlinear dissipative term is added to the equation of motion,
| (5) |
where C is a nonlinear dissipation coefficient. This term introduces a saturation effect at large displacements that limits the oscillation amplitude and represents the combined effect of nonlinear factors such as pressure loses for air viscosity in a narrow glottis, airflow separation within a divergent glottal channel, nonlinear characteristics of tissue biomechanical properties, and collision between the opposite vocal folds.
It is interesting to note that Laje et al. based their rationale on the well-known van der Pol equation (e.g., Strogatz, 1994),
| (6) |
which contains a similar nonlinear term , where μ > 0 is a parameter.1 This equation is a classical model of a relaxation oscillator, in which the system switches periodically between two states. Relaxation oscillation models for the vocal folds have also been considered by Fulcher et al. (2006) and Garrel et al. (2008). In case of a sufficiently small τ, the mean glottal pressure may be approximated by the linear relation (Laje et al., 2002; Arneodo and Mindlin, 2009), where υohar is a characteristic velocity coefficient. Equation 5 then becomes
| (7) |
Letting next B′ = Pg∕υchar – B, , and applying the substitutions , , Eq. 6 is obtained.
Next, in order to facilitate the analysis, Eq. 2 for the mean glottal pressure Pg is simplified. Pg depends on the shape of the glottal channel: it is positive for a convergent channel (a1 > a2) and negative for a divergent one (a1 < a2), and its magnitude decreases when the vocal folds are abducted (larger a1). Here, the inverse relation between Pg and the glottal area is kept, but it is expressed in terms of the area a at the midpoint of the glottis instead of its lower edge a1; i.e., a1 is substituted by a in the denominator of Eq. 2,
| (8) |
where a(t) = x0 + x(t) > 0. This last equation is easier to treat, and a similar simplification was considered in a previous analysis (Lucero, 1995).
The adopted model is, therefore,
| (9) |
where η = C∕B and x0 + x(t) > 0.
NUMERICAL EXAMPLE
Let us consider the simulation of a vocal fold oscillation pattern during a typical vocalization, and over a time period I = [0, T]. It is not easy, in general, to solve an advance-delay differential equation (e.g., Ford and Lumb, 2009). Standard methods for initial value problems do not apply, because when computing the solution x at a certain time t, its value at t + τ is still unknown. A boundary value approach must be used, in which both initial and final conditions are specified.
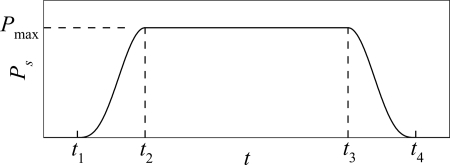
At the start of the simulation period, the vocal folds are assumed at rest, and so x(t) = 0 for t ∈ [−τ, τ]. Let the subglottal pressure Ps be variable and a function of time, with Ps(t) = 0 for some period t ∈ [0, t1], where t1 ≥ τ (see Fig. 2). From time t = t1, Ps(t) increases smoothly until reaching a maximum value at t = t2, which is maintained until some instant t = t3. From that point, Ps(t) decreases smoothly to zero at t = t4 ≤ T − τ. At the end of the simulation period, the vocal folds must go back to rest again, so the final boundary condition is again x(t) = 0 for t ∈ [Τ − τ, Τ + τ].
Figure 2.
Assumed pattern of the subglottal pressure Ps(t) for a simulation of the vocal fold oscillation.
Under those conditions, the solution of Eq. 9 is x(t) = 0 (because x = 0 is an equilibrium solution). To provoke an oscillation, a small perturbation x(τ) = xε is introduced. 9 is then solved by an iterative process, starting from the initial approximation,
| (10) |
At each iteration k, with k = 1, 2, 3, …, the mean glottal pressure Pg, given by the right side of 9, is computed by using solution x(k−1)(t). Next, a new solution xk(t) obtained by solving the resultant differential equation,
| (11) |
for t ∈ [τ, Τ − τ]. In all iterations, the boundary conditions x(k)(t) = 0 for t ∈ [τ, τ] and t ∈ [Τ − τ, Τ + τ] are added to the computed solutions. The process is repeated until there is no significant difference between solutions x(k) and x(k−1).
For this paper, a standard Runge–Kutta solver implemented in matlab was used, until the rms value of the difference x(k) − x(k−1) was smaller than 10−4 (in this condition, no difference between consecutive solutions may be perceived visually). In all the tests, the above process converged to a solution in about 70 iterations.
Values of the subglottal pressure Ps(t) in the intervals [t1, t2] and [t3, t4] were computed by using cubic splines interpolation between the end values of Ps (0 or Pmax, as appropriate) and setting the end slopes of the spline equal to zero. In this way, a smooth curve Ps(t) with a continuous first derivative was generated.
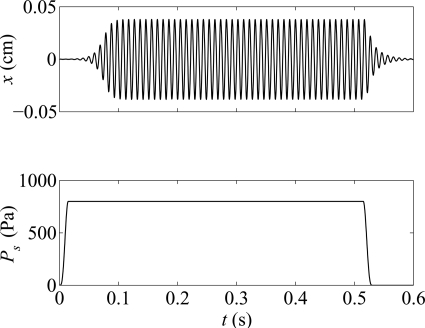
Figure 3 shows the solution for an adult male configuration of the parameters, described in Table TABLE I..
Figure 3.
Simulation of the vocal fold oscillation, for the parameter configuration in Table TABLE I.. Upper panel: Vocal fold displacement x(t). Lower panel: Subglottal pressure Ps(t), with t1 = τ, t2 = 15 ms, t3 = 515 ms, t4 = 530 ms, and T = 1000 ms. For clarity of the plots, only the time interval [0, 600] ms is shown.
Table 1.
Values of model’s parameters corresponding to an adult male configuration. All parameters, except B and η, were obtained from Titze (1988). B and η were selected so as to produce a stable oscillation of large amplitude.
| Parameter | Value |
|---|---|
| M | 0.476 g∕cm2 |
| B | 50 dyne s∕cm3 |
| K | 200 000 dyne∕cm3 |
| τ | 1 ms |
| kt | 1.1 |
| x0 | 0.1 cm |
| Pmax | 800 Pa |
| η | 5000 cm−2 |
HARMONIC BALANCE ANALYSIS
Due to the advance and delay terms in Eq. 9, standard methods of qualitative analysis of differential equations do not apply. However, the solution by the above numerical process reveals that the oscillations are nearly sinusoidal, even at large amplitudes. Therefore, the oscillatory behavior of the model may be investigated by using a harmonic balance method (MacDonald, 1993; Mickens, 1996). This method consists of approximating the solution of the differential equation by a truncated Fourier series and ignoring the higher harmonics generated by the nonlinear terms. Let us also note that the purpose of the present analysis is to gain some understanding of the qualitative behavior of the oscillation. Therefore, a harmonic balance of first order is adopted. The same technique was also used in a previous analysis of Titze’s original model (Lucero, 1995).
Equation 9 has an equilibrium point at the origin x = 0. An oscillation around this point is assumed, of the form,
| (12) |
where ω is the circular frequency and A is the amplitude, with 0 ≤ A < x0 [note that Eq. 9 demands x(t) > −x0]. When this solution is replaced into Eq. 9, the nonlinear dissipative term produces, with some manipulation,
| (13) |
Similarly, replacing Eq. 12 into Eq. 8 [or the right side of Eq. 9] and expanding the result into a Fourier series, produces
| (14) |
The higher harmonics in the above Eqs. 13, 14 are ignored, and the first harmonic terms are substituted into Eq. 9. Substituting also the solution 12 into the remaining linear terms and solving, produces and
| (15) |
where α = A∕x0 is the normalized oscillation amplitude and 0 < ωτ < π.
Equation 15 expresses the value of the subglottal pressure Ps that will produce an oscillation of amplitude α. At the oscillation onset, α = 0, and therefore the threshold pressure required to start the oscillation is Pth = Ps(0),
| (16) |
This expression was already found in a previous work (Lucero and Koenig, 2007) by using Hopf’s bifurcation theorem.
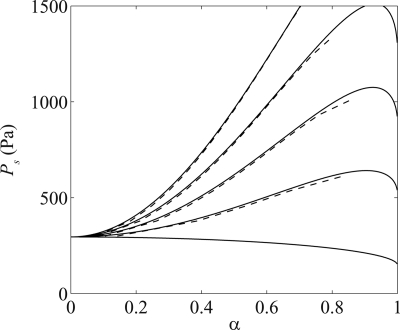
Figure 4 shows values of Ps vs the normalized oscillation amplitude α for various values of η, and other parameters as in Table TABLE I.. The oscillation threshold pressure is Pth = Ps(0) = 295.3 Pa. At this value, a Hopf bifurcation occurs: as Ps grows from Ps < Pth to Ps > Pth, the equilibrium point at x = 0 becomes unstable and a stable limit cycle (stable oscillation) is produced (supercritical case) or an unstable limit cycle is absorbed (subcritical case). Both types of bifurcations may occur, depending on the value of η. Increasing curves indicate stable limit cycles, and decreasing curves indicate unstable limit cycles. Consider, for example, an increasing curve for Ps(α), and assume that the system is on that curve oscillating at a certain amplitude α. If a perturbation causes a slight increase of amplitude, then the pressure Ps will be lower than the value required to sustain an oscillation at that amplitude, and the amplitude will decrease back to the previous value. In case of a decreasing curve for Ps(α), the same perturbation will result in a value of Ps larger than the one required to sustain the oscillation at the new amplitude, and so the oscillation amplitude will increase further. Therefore, the bifurcation is supercritical when the curve Ps(α) increases from the bifurcation point at α = 0, and subcritical when Ps(α) decreases.
Figure 4.
Subglottal pressure Ps vs normalized oscillation amplitude α for various values of η, and other parameters as in Table TABLE I.. From bottom to top, the curves correspond to η = 0, 1000, 2000, 3000, and 4000 cm−2, respectively. The dashed curves represent results from the direct numerical solution of Eq. 9.
Factor ω∕sin(ωτ) increases monotonically from a minimum at ω → 0 to infinity at ωτ → π (Lucero and Koenig, 2007). Therefore, changes in oscillation frequency ω will displace curves in Fig. 4 vertically (upward or downward, for a higher or lower oscillation frequency, respectively), without modifying their shapes.
Figure 4 also shows results obtained from direct numerical solution of Eq. 9. Their close proximity to the curves indicates that the harmonic balance analysis provides a good approximation to the actual solution.
Let us analyze the type of Hopf bifurcation in more detail. The first derivative of Ps(α) is
| (17) |
which produces P′s(0) = 0 and therefore, x = 0 is a critical point. The concavity at x = 0 may be determined by the sign of the second derivative,
| (18) |
and letting α = 0,
| (19) |
Therefore, Ps(α) is concave upward at α = 0 when , and downward when .
When , Eq. 17 may be transformed into
| (20) |
which is negative for 0 ≤ α < 1 and therefore the curve Ps(α) is decreasing.
Then, the Hopf bifurcation at the oscillation threshold Ps = Pth is subcritical for and supercritical for . Note that the type of bifurcation is only determined by η and therefore is independent of the time delay τ.
Figure 4 also shows that in the case of a supercritical bifurcation, Ps(α) has a point of local maximum, where the curve becomes decreasing for larger amplitudes. The maximum indicates a cyclic fold bifurcation between limit cycles. At the left of that point, a stable limit cycle exists, and at the right, an unstable one exists. Both limit cycles may therefore co-exist at some values of Ps, and, as Ps increases, they coalesce and cancel each other. The unstable limit cycle marks the limit of validity of the model for the vocal fold oscillation. Any trajectory beyond the unstable limit cycle will grow in amplitude until reaching the glottal closure condition x(t) = −x0.
The conditions for the existence of a fold bifurcation may be determined by solving P′s(α) = 0. It has two solutions; one is the Hopf bifurcation at α = 0, and the other is given by
| (21) |
Since 0 ≤ α < x0, then , which results in . When , both local extrema coalesce at α = 0. Therefore, the fold bifurcation only exists for , when the Hopf bifurcation at the oscillation threshold is supercritical. In case of a subcritical bifurcation, there is only one limit cycle, which is unstable. No stable oscillation is possible in this case, which is therefore outside the range of validity of the model as a representation of a vocal fold oscillator. Then, the proposed model allows only for a supercritical start of the oscillation.
EXTENSION OF THE MODEL
The shape of the curves Ps(α) may be easily altered and new bifurcations introduced by adding higher even-powers of x to the nonlinear damping factor (Ananthkrishnan et al., 1998). In a previous work (Lucero, 2005), a fourth-degree polynomial was used to produce an oscillation hysteresis phenomenon.
In the general case of a 2n-degree power, the vocal fold model is
| (22) |
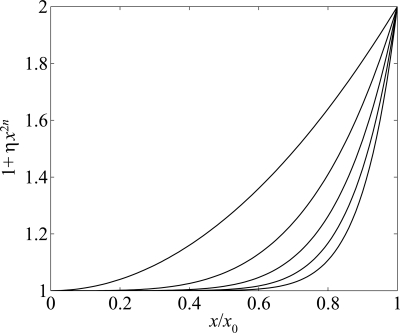
with x0 + x(t) > 0 and n = 1, 2, 3, …. Figure 5 shows characteristics of the nonlinear damping factor for various values of n. As n increases, the damping factor is closer to a constant at small values of x, and assumes a steeper increase as x grows closer to x0.
Figure 5.
Nonlinear damping factor 1 + ηx2n vs x∕x0 for and n = 1, 2, 3, 4, and 5, from left to right.
Retracing the steps of the first order harmonic approximation in the previous section [Eqs. 13, 14, 15] produces
| (23) |
where 0 < ωτ < π, r is the constant,
| (24) |
and Г is the Gamma function (extended factorial).
The oscillation threshold value Pth = Ps(0) is still given by Eq. 16, independent of n. To facilitate the analysis of Ps(α), let p = Ps∕Pth be the normalized pressure and be the normalized nonlinear coefficient. Equation 23 becomes
| (25) |
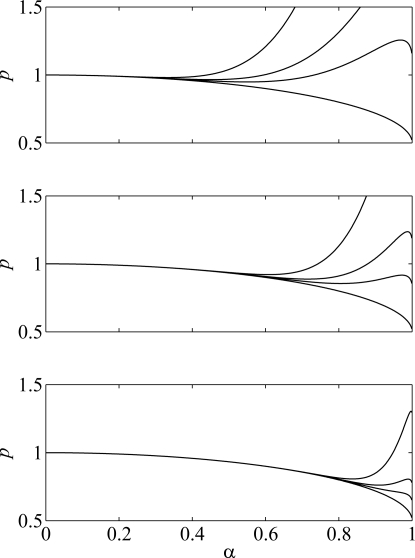
The case of n = 1 was treated in Sec. 4, and n > 1 is considered next. Figure 6 shows curves of p(α) for various values of n > 1 and β. All curves decrease as α increases from 0, which shows a subcritical Hopf bifurcation. In fact, it is straightforward to show that p′(0) = 0 and p′′(0) < 0 for n > 1, so that the threshold is always a local maximum.
Figure 6.
Normalized lung pressure p vs normalized oscillation amplitude α for n = 3 (top), 5 (middle), and 10 (bottom). In each panel, the curves correspond to values of β = 0, 5, 10, and 30, from bottom to top.
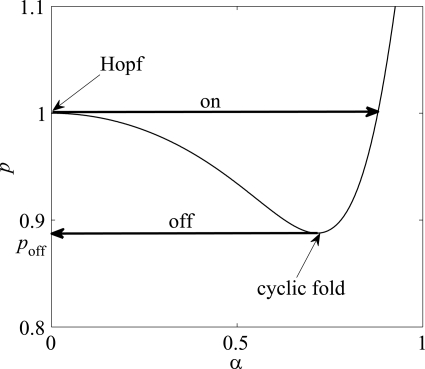
Some of the curves have a point of local minimum, for 0 < α < 1, which indicates a cyclic fold bifurcation between an unstable limit cycle (at the left) and a stable limit cycle (at the right). This shape produces an oscillation hysteresis phenomenon, as follows. Figure 7 shows an example for n = 5 and β = 12. As the lung pressure increases, the oscillation onset is produced at the subcritical Hopf bifurcation, where the rest position of the vocal folds becomes unstable. Once the system is in a stable oscillation (limit cycle), the lung pressure may be decreased until the system reaches the cyclic fold bifurcation. At this point, the stable limit cycle vanishes, and the system goes back to rest. Therefore, the threshold pressure for oscillation offset, denoted by poff, is given by its value at the local minimum and is lower than the threshold pressure for oscillation onset, forming an onset–offset hysteresis loop. In the example, poff = 0.89.
Figure 7.
Illustration of the oscillation hysteresis phenomenon.
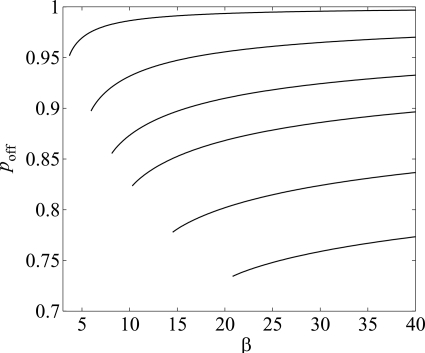
As shown by Fig. 6, the point of local minimum pressure (when it exists) moves to the right and larger values of the amplitude α as n increases, and the value of poff decreases. As η → ∞, p(α) become closer to the curve for β = 0, which represents a lower boundary for p. To illustrate the range of values of poff, Fig. 8 shows its values as a function of β. Note that poff decreases as n increases, and also as β decreases.
Figure 8.
Oscillation offset∕onset threshold pressure ratio poff vs β, and n = 2, 3, 4, 5, 7, and 10, from top to bottom.
COMPARISON WITH DATA FROM A MECHANICAL REPLICA
The validity of the above theoretical results may be assessed by comparing them with oscillation onset and offset threshold pressures measured by Ruty et al. (2007). The data were collected from a mechanical replica of the vocal folds consisting of two metal half-cylinders of 12.5 mm diameter, covered with latex tubes of 11 mm diameter and 0.2 mm thickness, which mimic the vocal fold structure in a 3:1 scale. The latex tubes were filled with water, at a controlled internal pressure Pc. The initial separation h0 between them decreases when Pc is increased and becomes zero for Pc > 5000 Pa. Values of h0 at various values of Pc were measured to determine the functional relation between both parameters (Fig. 8, Ruty et al., 2007). The vocal tract was simulated with a downstream cylindrical resonator. Two different resonators were used, with a diameter of 25 mm, and lengths of 250 and 500 mm, respectively. Their dimensions were chosen in order to present a weak and a strong acoustical coupling. For details on the experimental setup, we refer the reader to Sec. 3 of the work of Ruty et al. (2007).
Measures of oscillation threshold pressure were obtained by increasing the air pressure upstream of the vocal fold replica until an oscillation of the latex structures was detected with an optical device. The oscillation frequency at the oscillation onset was then computed by spectral analysis on the acoustic output signal. A threshold pressure for the oscillation offset was next measured, by decreasing the upstream pressure until the oscillation was interrupted (Figs. 910, Ruty et al., 2007).
Figure 9.
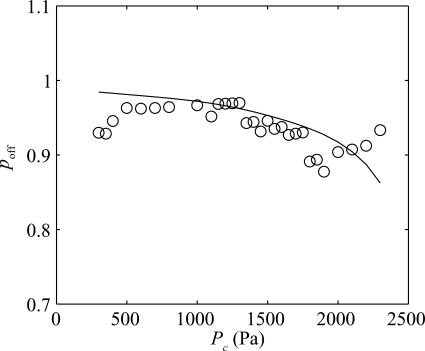
Fitted values of oscillation offset∕onset threshold pressure ratio poff vs internal pressure of latex tubes Pc. Curve: Theoretical results. Circles: Measured data.
Figure 10.
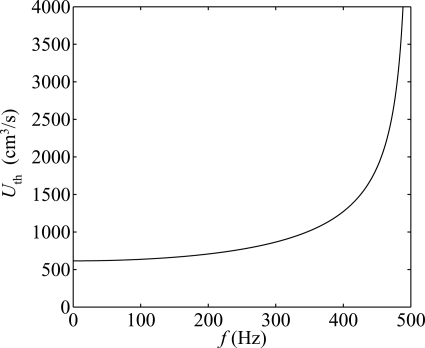
Phonation threshold flow Uth vs oscillation frequency f, for the parameter configuration in Table TABLE I. and L = 1.4 cm, ρ = 0.00114 g∕cm3 (Titze, 1988).
A previous work already showed that Eq. 16, for the onset threshold pressure, provides a good representation of the data (Lucero et al., 2009). Here, the oscillation offset∕onset ratio poff is considered, and only data from the 250 mm tube are used (weakly coupled vocal tract), because the above theory does not include the effect of the vocal tract load. The measured ratio ranges from 0.87 to 0.98. According to Fig. 8, the lowest value of parameter n that produces values of poff in that range is n = 4, and this value was adopted for the theoretical model. A standard least square algorithm implemented in matlab was used to determine the value of η that best fits theoretical values of p to the data, as follows. First, for each measured value of the internal pressure Pc, the initial separation of the latex tubes (h0) was determined from the measured data, and x0 = h0∕2 was computed. Next, for a given value of η, was computed, and the corresponding value of poff was obtained from the curve poff(β) in Fig. 8, for n = 4. Finally, the value for η that minimizes the squared error between measured and predicted values of the offset∕onset pressure ratio was determined, with the results shown in Fig. 9. The optimal value for η is 9.18 cm−8, and the relative rms error between measured and predicted values of poff is 2.97%. As the internal pressure of the latex tubes Pc increases, the separation between them, and consequently x0, decreases. For a fixed η, β decreases, and therefore the offset∕onset ratio poff decreases.
PHONATION THRESHOLD FLOW
The relation between subglottal pressure Ps and glottal flow Ug is
| (26) |
where Ug is the flow, ρ is the air density, and a2 is given by Eq. 4 (Titze, 1988). At the threshold, there is no tissue oscillation and the vocal folds are at rest, therefore, a2 = 2Lx0. Solving for Ug, and using Eq. 16, produces the phonation threshold flow,
| (27) |
When τ → 0, sin ω → ωτ, and
| (28) |
which matches the result obtained by Jiang and Tao (2007). Similarly to the phonation threshold pressure, Uth also increases with the oscillation frequency as shown by Fig. 10.
Different values of the flow for oscillation onset and offset thresholds may exist, depending on how other parameters of the system are varied. Assume first that the subglottal pressure Ps is the control parameter, and that all other parameters are fixed. Substituting Eq. 23 into Eq. 26, and defining the normalized flow u = Ug∕Uth, produces
| (29) |
where p is given by Eq. 25. Since the offset∕onset threshold pressure ratio varies from 0.5 to 1, the above relation implies that the flow ratio varies from 0.7 to 1. This relation was also found in a recent experimental study on excised larynges (Regner et al., 2008), which reported that 80% of the measured ratios were in the theoretical range.
During consonant production in running speech, the main control parameter that switches voicing on and off is glottal adduction–abduction (Lisker et al., 1969; Löfqvist and Yoshioka, 1981, 1984), represented here by the glottal half-width x0. Assuming other parameters constant, the glottal half-width at oscillation onset threshold is
| (30) |
and using Eq. 26, the threshold flow is
| (31) |
Finally, solving Eq. 23 for x0 and substituting in Eq. 26, produces a normalized flow,
| (32) |
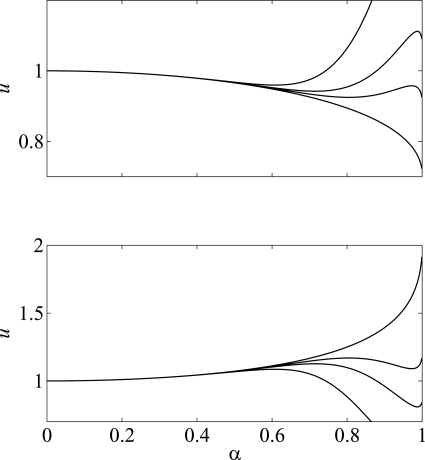
Figure 11 shows numerical examples of u(α) in both the cases of Ps and x0 as control parameters. The upper plot shows a subcritical bifurcation pattern similar to the subglottal pressure in Fig. 6. Oscillation hysteresis occurs as illustrated in Fig. 7. In the lower plot, the patterns are inverted, and the threshold at α = 0 is now a local minimum. Note, however, that in this case the equilibrium position of the vocal folds is stable above the threshold, and unstable below it (to provoke the oscillation, the vocal folds must be adducted, which reduces the airflow). Therefore, the threshold bifurcation is subcritical also in this case. An oscillation hysteresis pattern may be formed, with an oscillation offset threshold higher than the onset threshold.
Figure 11.
Normalized glottal flow u vs normalized oscillation amplitude α for n = 5. Upper panel: u is varied by varying x0. Lower panel: u is varied by varying Ps. In each panel, the curves correspond to values of β = 0, 5, 10, and 30 (from bottom to top, in the upper panel, and from top to bottom, in the lower panel).
In the case of n = 1, the results are similar to those found for the threshold pressure in Sec. 4: The oscillation threshold bifurcation must be supercritical, and there is no oscillation hysteresis. The demonstration follows similar steps to those expressed by Eqs. 17, 18, 19, 20, 21.
COMPARISON WITH DATA FROM SUBJECTS PRODUCING SPEECH
The above results may also be assessed by measures of oral airflow at voicing offset and onset of subjects producing speech. Koenig et al. (2005) collected data from six adult females producing three sentences with an intervocalic ∕h∕ (∕ə‘hɑp∕, ∕ə‘hɪp∕, and ∕ə‘hup∕), at normal speech rate and at soft, normal and high loudness. The production of ∕h∕ represents a simpler situation than other consonants, because there is no intraoral pressure buildup to take into account as another factor affecting phonation. Thus, it is a more direct analog of a laryngeal model coupled to an open upper vocal tract with an invariant shape.
For each speaker, approximately 225 tokens were collected. The flow signals were decomposed into DC (smoothed) and AC (difference between the original signal and the smoothed one) components. Next, several measures of flow were obtained. In cases of devoicing during ∕h∕ abduction, the measured parameters included AC flow, DC flow, and AC frequency (i.e., F0) at the voice offset and onset before and after the ∕h∕ flow peak, respectively.
For the present study, only productions of ∕əhɑ∕ were used, in order to keep the first vocal tract formant as high as possible and therefore minimize its influence on the vocal fold oscillation. Further, only the cases of normal loudness were used, to minimize subglottal pressure variations. From the remaining set of 112 tokens, 16 were eliminated: 14 tokens had negative flow values, probably due to imprecision of calibration, and 2 tokens had small DC flow values at voice onset and produced much larger offset∕onset ratios of threshold flow than the other tokens. Table TABLE II. shows a summary of measured values.
Table 2.
Means and standard deviations, in parentheses, of airflow measures from six female subjects (F1–F6) producing speech. Airflow is in cubic centimeter per second (cm3∕s); frequency is in hertz (Hz).
| Parameter | Subject | |||||
|---|---|---|---|---|---|---|
| F1 | F2 | F3 | F4 | F5 | F6 | |
| N tokens | 11 | 28 | 14 | 4 | 20 | 19 |
| Offset | ||||||
| DC flow | 781.2 (259.8) | 880.0 (126.7) | 325.6 (185.5) | 114.0 (54.8) | 158.2 (46.3) | 502.6 (95.2) |
| AC flow | 43.1 (20.9) | 25.7 (10.9) | 40.8 (13.0) | 6.5 (2.2) | 31.5 (11.0) | 26.4 (15.6) |
| F0 | 184.0 (7.8) | 168.5 (8.9) | 212.1 (15.7) | 178.3 (26.3) | 131.5 (13.0) | 199.1 (18.7) |
| Onset | ||||||
| DC flow | 701.2 (300.0) | 634.9 (116.7) | 239.7 (177.6) | 106.5 (39.8) | 88.9 (40.2) | 402.3 (77.9) |
| AC flow | 69.6 (37.0) | 41.3 (23.3) | 64.4 (22.1) | 15.0 (13.6) | 31.1 (13.2) | 34.2 (19.3) |
| F0 | 205.9 (11.4) | 204.0 (15.1) | 241.3 (14.8) | 197.4 (7.8) | 179.7 (18.6) | 251.9 (37.4) |
Assuming a constant subglottal pressure throughout the glottal abduction–adduction gesture, then the glottal area is proportional to airflow [Eq. 26]. This is actually a crude simplification, because an abducted glottis offers less resistance to the air flow, and therefore causes a drop of subglottal pressure (for a constant lung pressure). In an experimental study on ∕s∕ and ∕t∕ production, subglottal pressure variations between voice offset and onset up to 20% were reported (Hirose and Niimi, 1987). Further, computer simulations using the above data produced subglottal pressure drops up to 50% at the peak abduction, relative to the pressure at the adducted position (Lucero and Koenig, 2005).
If glottal airflow and area are assumed proportional, then the normalized oscillation amplitude at voice offset is
| (33) |
Flow variations are produced by x0 variations; however, the data also show frequency differences between onset and offset. The frequency differences reflect the stress pattern of the utterance, namely that the ∕h∕ initiated a stressed syllable. In this case, the normalized flow at voice offset, relative to the flow at voice onset, is given by
| (34) |
where p is given by Eq. 25.
Table TABLE III. shows mean values of uoff and αoff computed from the data. It also shows mean values of factor 1∕p(αoff), computed by letting β = 0. Therefore, those are its maximum possible values. This factor represents offset∕onset differences due to the oscillation hysteresis. When there is no hysteresis, its value is 1. Note that it is very close to 1, and further, its increment above 1 is much smaller than the increment of the offset flow from the onset flow, i.e., 1∕p(αoff) − 1 ≪ uoff − 1. The coefficients of determination of 1∕p(αoff) − 1 vs uoff − 1 are in the range R2 = 0.009 – 0.0164. Therefore, only a very small part of the offset∕onset flow variation may be attributed to the oscillation hysteresis,
Table 3.
Means and standard deviations, in parentheses, of parameters computed from data in Table TABLE I., and from fitting Eq. 34 to the data.
| Parameter | Subject | |||||
|---|---|---|---|---|---|---|
| F1 | F2 | F3 | F4 | F5 | F6 | |
| uoff(measured) | 1.17 (0.21) | 1.41 (0.26) | 1.88 (1.21) | 1.41 (0.54) | 2.05 (0.89) | 1.25 (0.15) |
| αoff | 0.05 (0.02) | 0.02 (0.01) | 0.16 (0.08) | 0.04 (0.01) | 0.22 (0.10) | 0.05 (0.03) |
| 1∕p(αoff) | 1.0010 (0.0009) | 1.0003 (0.0003) | 1.0085 (0.0091) | 1.0006 (0.0004) | 1.0157 (0.0139) | 1.0009 (0.0009) |
| uoff(fitted) | 1.17 (0.04) | 1.35 (0.23) | 1.87 (0.77) | 1.41 (0.31) | 2.08 (0.60) | 1.25 (0.06) |
| τoff | 0.82 | 1.55 | 0.20 | 0.69 | 2.13 | 0.56 |
| τoff | 1.01 | 1.39 | 1.96 | 1.63 | 2.31 | 0.70 |
| rms error | 16.6% | 17.1% | 48.4% | 27.2% | 29.7% | 11.3% |
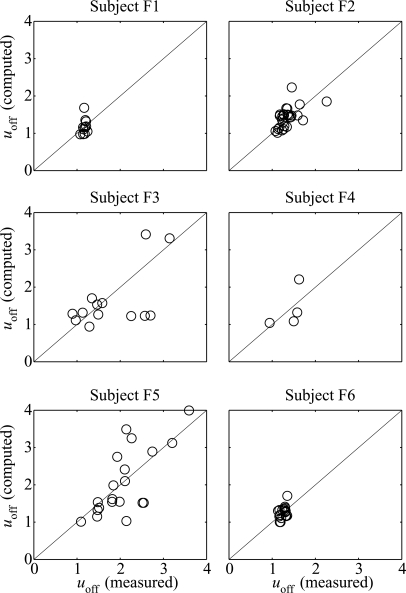
Equation 34 was fitted to the data assuming 1∕p(αoff) = 1, for simplicity. For each subject, values were computed for τoff and τon using a least squares algorithm implemented in MATLAB to minimize the squared error between the values of uoff computed from the data and those predicted by Eq. 34. Figure 12 illustrates results of the fit, and Table TABLE III. presents a summary. Assuming a glottal channel height T = 3 mm, then the computed time delays τ correspond to mucosal wave velocities c = T∕(2τ) = 0.7–3.9 m∕s, and phase delays δ = 2τω∕T = 17°∕mm to 112°∕mm. These ranges overlap the lower range of values found by Titze et al. (1993), c = 0.5–2.0 m∕s and δ = 30°∕mm to 60°∕mm, respectively.
Figure 12.
Computed vs measured flow offset∕onset ratios. On the diagonal line computed and measured values are equal.
In general, poorer fits of the model were obtained for those subjects with values of offset∕onset flow ratios scattered over a larger interval (e.g., compare subjects F1 and F6 with subjects F3 and F5). Since flow is proportional to glottal area, a larger flow ratio means larger variation of glottal area from oscillation offset to onset. As noted above, variations in glottal area cause variations in subglottal pressure, which has been assumed constant. Therefore, the larger errors might be attributed to the effect of neglecting subglottal pressure differences between offset and onset.
Let us also note that the fit has been done by assuming that the time delays τoff and τon have constant values across all tokens, for each subject. However, other assumptions may be adopted instead. For example, Titze (1988) pointed out that the mucosal wave velocity c should increase with the oscillation frequency F0. In case of a linear relation, then the phase delay ωτ should be constant. Therefore, a fit may be done by assuming constant values of the phase delays ωoffτoff and ωonτon across all tokens, for each subject. This alternative fit was also tested, with similar results to those shown above and rms errors slightly higher (16.1%–58.2%).
CONCLUSIONS
The main conclusions from this analysis may be summarized as follows.
The proposed model may be applied to analytical studies of the ruling principles of the vocal fold oscillation. Its main improvements over Titze’s (1988) original model are two: First, it allows for large amplitude oscillations, and therefore it describes the oscillation dynamics not only at phonation onset but also after it has developed a sustained amplitude. Second, it considers arbitrary time delays, which has the consequence of incorporating the oscillation frequency as a control parameter of its oscillatory behavior (Lucero and Koenig, 2007).
In the model, the oscillation onset is described by a Hopf bifurcation. Both the supercritical and subcritical types are possible, depending on the form of the nonlinear damping factor. The threshold equation that relates the various parameters at the oscillation onset includes the oscillation frequency, but the type of bifurcation is independent of it. In case of the subcritical bifurcation, an oscillation hysteresis may be formed, with different threshold values for oscillation onset and offset.
The phonation threshold flow may be used as a relevant parameter of the oscillation, as a convenient alternative to the phonation threshold pressure. However, it must be pointed out that this is an output parameter, resultant from the simultaneous action of several controlling factors. For instance, it may assume different values at voice onset vs offset, but the relation between those values depends on how the voice onset–offset is produced: by varying the subglottal pressure, or glottal abduction, or a combination of these and other factors.
Differences measured at voicing onset vs offset do not necessarily mean an oscillation hysteresis phenomenon. Hysteresis indicates the existence of two possible co-existent states for a system, as illustrated by Fig. 7. Within the region of co-existence (e.g., subglottal pressure between the onset and offset thresholds), the system may be in one or the other state (i.e., oscillating or at rest), depending on its history (the subglottal pressure is increasing from zero, or it is decreasing from the oscillation onset level). However, in the case of airflow measures of consonants produced in speech, several factors may influence phonation offset–onset differences in addition to hysteresis effects (which assume that laryngeal and supralaryngeal conditions are held constant). In the case of the ∕h∕ data presented here, much of the onset–offset difference appears to be a consequence of the fundamental frequency. In obstruent consonants, variations in laryngeal timing and supraglottal pressures must also be considered. Thus, in most consonantal contexts, pure oscillation hysteresis effects might be small compared to the effects of variations in f0, intraoral pressure, and the magnitude and timing of vocal fold abduction.
This analysis has disregarded effects of the vocal tract on the oscillation. A follow-up study using a simple vocal tract model is currently under way, to explore laryngeal source-vocal tract interactions.
ACKNOWLEDGMENTS
This work was supported by Ministério da Ciência e Tecnologia∕Conselho Nacional de Desenvolvimento Científico e Tecnológico, Coordenação de Aperfeiçoamento de Pessoal de Nível Superior (Brazil), and National Institute of Health, Grant No. DC-00865, to Haskins Laboratories.
Footnotes
In their work, Laje et al. (2001) considered the equivalent form u′ = υ − u3 + u, υ′ = −εu, where u and υ are two dynamical variables and ε is a small real parameter.
References
- Amador, A., and Mindlin, G. B. (2008). “Beyond harmonic sounds in a simple model for birdsong production,” Chaos 18, 043123. 10.1063/1.3041023 [DOI] [PubMed] [Google Scholar]
- Ananthkrishnan, N., Sudhakar, K., Sudershan, S., and Agarwal, A. (1998). “Application of secondary bifurcations to large amplitude limit cycles in mechanical systems,” J. Sound Vib. 215, 183–188. 10.1006/jsvi.1998.1623 [DOI] [Google Scholar]
- Appleton, E. V., and van der Pol, B. (1922). “On a type of oscillation-hysteresis in a simple triode generator,” Philos. Mag. 43, 177–193. [Google Scholar]
- Arneodo, E. M., and Mindlin, G. B. (2009). “Source-tract coupling in birdsong production,” Phys. Rev. E 79, 061921. 10.1103/PhysRevE.79.061921 [DOI] [PubMed] [Google Scholar]
- Avanzini, F. (2008). “Simulation of vocal fold oscillation with a pseudo-one-mass physical model,” Speech Commun. 50, 95–108. 10.1016/j.specom.2007.07.002 [DOI] [Google Scholar]
- Berry, D. A., Herzel, H., Titze, I. R., and Story, B. H. (1996). “Bifurcations in excised larynx experiments,” J. Voice 10, 129–138. 10.1016/S0892-1997(96)80039-7 [DOI] [PubMed] [Google Scholar]
- Chan, R. W., and Titze, I. R. (2006). “Dependence of phonation threshold pressure on vocal tract acoustics and vocal fold tissue mechanics,” J. Acoust. Soc. Am. 119, 2351–2362. 10.1121/1.2173516 [DOI] [PubMed] [Google Scholar]
- Chan, R. W., Titze, I. R., and Titze, M. R. (1997). “Further studies of phonation threshold pressure in a physical model of the vocal fold mucosa,” J. Acoust. Soc. Am. 101, 3722–3727. 10.1121/1.418331 [DOI] [PubMed] [Google Scholar]
- Drioli, C. (2005). “A flow waveform-matched low-dimensional glottal model based on physical knowledge,” J. Acoust. Soc. Am. 117, 3184–3195. 10.1121/1.1861234 [DOI] [PubMed] [Google Scholar]
- Fisher, K. V., and Swank, P. R. (1997). “Estimating phonation threshold pressure,” J. Speech Lang. Hear. Res. 40, 1122–1129. [DOI] [PubMed] [Google Scholar]
- Ford, N. J., and Lumb, P. M. (2009). “Mixed-type functional differential equations: A numerical approach,” J. Comput. Appl. Math. 229, 471–479. 10.1016/j.cam.2008.04.016 [DOI] [Google Scholar]
- Fulcher, L. P., Scherer, R. C., Melnykov, A., Gateva, V., and Limes, M. E. (2006). “Negative coulomb damping, limit cycles, and self-oscillation of the vocal folds,” Am. J. Phys. 74, 386–393. 10.1119/1.2173272 [DOI] [Google Scholar]
- Garrel, R., Scherer, R., Nicollas, R., Giovanni, A., and Ouaknine, M. (2008). “Using the relaxation oscillations principle for simple phonation modeling,” J. Voice 22, 385–398. 10.1016/j.jvoice.2006.10.012 [DOI] [PubMed] [Google Scholar]
- Hirose, H., and Niimi, S. (1987). “The relationship between glottal opening and the transglottal pressure differences during consonant production,” in Laryngeal Function in Phonation and Respiration, edited by Baer T., Sasaki C., and Harris K. S. (College-Hill Press, Boston, MA: ), pp. 381–390. [Google Scholar]
- Ishizaka, K., and Flanagan, J. L. (1972). “Synthesis of voiced sounds from a two-mass model of the vocal folds,” Bell Syst. Tech. J. 51, 1233–1268. [Google Scholar]
- Jiang, J. J., and Tao, C. (2007). “The minimum glottal airflow to initiate vocal fold oscillation,” J. Acoust. Soc. Am. 121, 2873–2881. 10.1121/1.2710961 [DOI] [PubMed] [Google Scholar]
- Koenig, L. L., Mencl, W. E., and Lucero, J. C. (2005). “Multidimensional analyses of voicing offsets and onsets in female speakers,” J. Acoust. Soc. Am. 118, 2535–2550. 10.1121/1.2033572 [DOI] [PubMed] [Google Scholar]
- Laje, R., Gardner, T., and Mindlin, G. B. (2001). “Continuous model for vocal fold oscillations to study the effect of feedback,” Phys. Rev. E 64, 056201. 10.1103/PhysRevE.64.056201 [DOI] [PubMed] [Google Scholar]
- Laje, R., Gardner, T. J., and Mindlin, G. B. (2002). “Neuromuscular control of vocalizations in birdsong: A model,” Phys. Rev. E 65, 288102. 10.1103/PhysRevE.65.051921 [DOI] [PubMed] [Google Scholar]
- Laje, R., and Mindlin, G. B. (2005). “Modeling source-source and source-filter acoustic interaction in birdsong,” Phys. Rev. E 72, 036218. 10.1103/PhysRevE.72.036218 [DOI] [PubMed] [Google Scholar]
- Lisker, L., Abramson, A. S., Cooper, F. S., and Schvey, M. H. (1969). “Transillumination of the larynx in running speech,” J. Acoust. Soc. Am. 45, 1544–1546. 10.1121/1.1911636 [DOI] [PubMed] [Google Scholar]
- Löfqvist, A., and Yoshioka, H. (1981). “Interarticulator programming in obstruent production,” Phonetica 38, 21–34. 10.1159/000260012 [DOI] [PubMed] [Google Scholar]
- Löfqvist, A., and Yoshioka, H. (1984). “Intrasegmental timing: Laryngeal-oral coordination in voiceless consonant production,” Speech Commun. 3, 279–289. 10.1016/0167-6393(84)90024-4 [DOI] [Google Scholar]
- Lucero, J. C. (1995). “The minimum lung pressure to sustain vocal fold oscillation,” J. Acoust. Soc. Am. 98, 779–784. 10.1121/1.414354 [DOI] [PubMed] [Google Scholar]
- Lucero, J. C. (1999). “Theoretical study of the hysteresis phenomenon at vocal fold oscillation onset-offset,” J. Acoust. Soc. Am. 105, 423–431. 10.1121/1.424572 [DOI] [PubMed] [Google Scholar]
- Lucero, J. C. (2005). “Bifurcations and limit cycles in a model for a vocal fold oscillator,” Commun. Math. Sci. 3, 517–529. [Google Scholar]
- Lucero, J. C., Hirtum, A. V., Ruty, N., Cisonni, J., and Pelorson, X. (2009). “Validation of theoretical models of phonation threshold pressure with data from a vocal fold mechanical replica,” J. Acoust. Soc. Am. 125, 632–635. 10.1121/1.3056468 [DOI] [PubMed] [Google Scholar]
- Lucero, J. C., and Koenig, L. L. (2005). “Simulations of temporal patterns of oral airflow in men and women using a two-mass model of the vocal folds under dynamic control,” J. Acoust. Soc. Am. 117, 1362–1372. 10.1121/1.1853235 [DOI] [PubMed] [Google Scholar]
- Lucero, J. C., and Koenig, L. L. (2007). “On the relation between the phonation threshold lung pressure and the oscillation frequency of the vocal folds,” J. Acoust. Soc. Am. 121, 3280–3283. 10.1121/1.2722210 [DOI] [PubMed] [Google Scholar]
- MacDonald, N. (1993). “Choices in the harmonic balance technique,” J. Phys. A 26, 6367–6377. 10.1088/0305-4470/26/22/033 [DOI] [Google Scholar]
- Mickens, R. E. (1996). Oscillations in Planar Dynamic Systems (World Scientific, Singapore: ), pp. 139–173. [Google Scholar]
- Plant, R. L., Freed, G. L., and Plant, R. E. (2004). “Direct measurement of onset and offset phonation threshold pressure in normal subjects,” J. Acoust. Soc. Am. 116, 3640–3646. 10.1121/1.1812309 [DOI] [PubMed] [Google Scholar]
- Regner, M. F., Tao, C., Zhuang, P., and Jiang, J. J. (2008). “Onset and offset phonation threshold flow in excised canine larynges,” Laryngoscope 118, 1313–1317. 10.1097/MLG.0b013e31816e2ec7 [DOI] [PMC free article] [PubMed] [Google Scholar]
- Ruty, N., Pelorson, X., Hirtum, A. V., Lopez-Arteaga, I., and Hirschberg, A. (2007). “An in vitro setup to test the relevance and the accuracy of low-order vocal folds models,” J. Acoust. Soc. Am. 121, 479–490. 10.1121/1.2384846 [DOI] [PubMed] [Google Scholar]
- Sitt, J. D., Amador, A., Goller, F., and Mindlin, G. B. (2008). “Dynamical origin of spectrally rich vocalizations in birdsong,” Phys. Rev. E 78, 011905. 10.1103/PhysRevE.78.011905 [DOI] [PubMed] [Google Scholar]
- Strogatz, S. H. (1994). Nonlinear Dynamics and Chaos (Perseus Books, Cambridge, MA: ), pp. 211–215. [Google Scholar]
- Tao, C., and Jiang, J. J. (2008). “The phonation critical condition in rectangular glottis with wide prephonatory gaps,” J. Acoust. Soc. Am. 123, 1637–1641. 10.1121/1.2832328 [DOI] [PubMed] [Google Scholar]
- Titze, I. R. (1988). “The physics of small-amplitude oscillation of the vocal folds,” J. Acoust. Soc. Am. 83, 1536–1552. 10.1121/1.395910 [DOI] [PubMed] [Google Scholar]
- Titze, I. R. (1992). “Phonation threshold pressure: A missing link in glottal aerodynamics,” J. Acoust. Soc. Am. 91, 2926–2935. 10.1121/1.402928 [DOI] [PubMed] [Google Scholar]
- Titze, I. R., Jiang, J. J., and Hsiao, T. Y. (1993). “Measurement of mucosal wave-propagation and vertical phase difference in vocal fold vibration,” Ann. Otol. Rhinol. Laryngol. 102, 58–63. [DOI] [PubMed] [Google Scholar]
- Titze, I. R., Schmidt, S. S., and Titze, M. R. (1995). “Phonation threshold pressure in a physical model of the vocal fold mucosa,” J. Acoust. Soc. Am. 97, 3080–3084. 10.1121/1.411870 [DOI] [PubMed] [Google Scholar]
- Verdolini, K., Min, Y., Titze, I. R., Lemke, J., Brown, K., van Mersbergen, M., Jiang, J., and Fisher, K. (2002). “Biological mechanisms underlying voice changes due to dehydration,” J. Speech Lang. Hear. Res. 45, 268–281. 10.1044/1092-4388(2002/021) [DOI] [PubMed] [Google Scholar]


