Abstract
Conventionally, isotachophoresis (ITP) is used for separation of ionic samples according to their electrophoretic mobilities. We demonstrate that the scope of ITP applications may be extended toward particle concentration and separation. Owing to the distributions of electrolyte concentration and electric field inside a transition zone between two electrolytes, a number of different forces act on a small particle. As far as possible, we provide estimates for the order of magnitude of these forces and analyze their scaling with the particle size and the electric-field strength. Furthermore, we experimentally demonstrate that polymer beads of 5 μm diameter dispersed in a high mobility “leading” electrolyte are picked up and carried along by an ITP transition zone which is formed with a low mobility “trailing” electrolyte. By studying the particle positions and trajectories, we show that impurities in the electrolytes play a significant role in the experiments. Additionally, it is experimentally shown that different types of beads can be separated at an ITP transition zone. In particular, beads of 1 μm diameter are not carried along with the transition zone, in contrast to the 5 μm beads. The presented technique thus adds to the portfolio of electrokinetic transport, concentration, and separation methods in microfluidics.
INTRODUCTION
Isotachophoresis (ITP) is a standard technique for concentration and separation of ionic samples.1 Due to its possibility for miniaturization and reduced sample consumption, it has spawned increased interest within the lab-on-a-chip community in the past decade.2 In this paper, we show that isotachophoresis bears a much larger potential than known from previous work. Not only ionic substances but also micron sized particles can be collected and separated at an ITP boundary.
Isotachophoresis relies on consecutively stacking a high mobility [leading electrolyte (LE)] and a low mobility buffer [trailing electrolyte (TE)] in a capillary or channel. Upon application of an electric field, a sharp transition zone is formed between the two buffers which migrates toward the part of the channel occupied by the LE. Since both buffers migrate at the same speed, the term iso (same) tacho (speed) phoresis (transport) was formed, derived from the ancient Greek. The key feature is a large difference in electric fields between the leading and trailing electrolytes due to their different mobility. Additionally, the concentration of the trailing electrolyte ions in the “wake” of the transition zone adjusts such that the conductivities in both buffers allow for a uniform electric current along the channel. The width of the transition zone between the two buffers is governed by an interplay between diffusion and electromigration and is typically of the order of a few microns, depending on the experimental conditions.
In the regular mode of using isotachophoresis as a separation technique, a sample containing ions of different mobilities is sandwiched between the LE and TE. Upon application of an electric field, the sample ions will stack along the channel in the order of their electrophoretic mobilities, forming distinct bands with transition zones between them. In this paper, however, we mainly focus on a single transition zone. Nevertheless, in experiments the reagents used are never entirely pure and usually contaminations will form additional bands between the TE and LE.3
Note that ITP is not only used for small ions but has also proven useful for the analysis of nanometer sized objects. For example, it was used as a preconcentration technique for RNA and proteins in context with gel electrophoresis,4 for purification of nucleic acids from whole blood samples,5 or for the study of plasma lipoproteins.6, 7 Furthermore, ITP can also be combined with micellar electrophoresis.8 Recently, it was shown that also colloidal nanoparticles form a distinct ITP zone9 allowing to determine concentrations of nanoparticle solutions.10
Beyond using isotachophoresis as an analytical technique “as is,” several groups are currently investigating possibilities to enhance the spectrum of applications. In Ref. 11, the authors investigate the splitting of samples at channel bifurcations, while our group has shown the merging and contacting of two samples introduced from two different channels, even allowing chemical reactions between the electrolytes in contact.12 These new ways of electrokinetic sample manipulation may lead to novel modes of using ITP, for example, in combinatorial chemistry or assay multiplexing. The present study proceeds along the same lines, investigating particle transport at ITP transition zones.
The small width of an ITP transition zone and the large difference in properties between the LE and TE regions lead to large gradients in electric field, concentrations, and usually also pH confined to a very narrow region. Since a dielectric particle in an electric-field gradient experiences a dielectric force,13, 14 this leads to the idea of using an ITP transition zone as a “conveyor belt” for small particles. Since the dielectrophoretic (DEP) force is proportional to the volume of the particle and the Stokes drag scales with the diameter of the particle, also a size separation should be feasible along these lines. Additionally, there is an inherent unbalanced charge due to the change in electric field in the transition zone, leading to an “electrohydrostatic” pressure gradient in the fluid, which in turn exerts a net force on the particle.15 However, also other mechanisms are conceivable to transport a particle along with the transition zone. Since typically the zeta potential of polymers is pH dependent,16, 17 a polymer particle’s electro-osmotic mobility will in general be different in the LE and TE. Assuming an electro-osmotic velocity that is lower than the ITP migration velocity in the LE, while it is higher (and in the same direction as the ITP migration) in the TE, a particle initially located in the LE will appear to be picked up and moved along by the transition zone.
In this article, we present experimental results that indeed show that polystyrene beads initially located in the LE are picked up and carried along with the transition zone between a leading and a trailing electrolyte. Moreover, we show that it is possible to separate beads of different sizes by this technique. In our experiments, beads of 5 μm diameter are carried along with the transition zone, while 1 μm diameter beads are left behind in the TE as the zone sweeps along the channel.
This paper is organized as follows. Section 2 explores the conditions at an ITP transition zone in a simple model situation where the electric and concentration fields can be calculated analytically. Furthermore, the different forces acting on a dielectric sphere in the transition zone are discussed. We then proceed in Sec. 3 with a description of the experimental procedures followed by an account of their results in Sec. 4. The paper closes with a discussion and conclusions in Sec. 5.
THEORY
Concentration and electric field in an ITP transition zone
In this section, we give a sketch of the conditions in an ITP transition zone by considering a simple model system consisting of a LE and a TE. We assume the electrolytes to consist of monovalent anions of concentrations c+ for the LE and c− for the TE, and a common cation of concentration c0. These concentrations will depend on the position x along the channel, i.e., ci=ci(x), i∊{+,0,−}, but for convenience we will usually suppress this coordinate dependence in our notation. Moreover, we assume electroneutrality, so the cation concentration can always be inferred from the anion concentrations c0=c++c−.
An important relation between the electric field E, electrophoretic mobilities μi, and concentrations far away from the transition zone can already be inferred from the fact that (i) the migration velocity as well as (ii) the total current is the same on both sides of the transition zone. In particular, the velocity of electrophoretic migration, i.e., the velocity of the ITP transition zone, is
| (1) |
where E+ and E− refer to the electric fields in the LE and TE far away from the transition zone. From current conservation, we have
| (2) |
where the (spatially dependent) conductivity is
| (3) |
and F is Faraday’s constant. Evaluating Eq. 2 at both sides of and sufficiently far from the transition zone and using Eq. 1, we obtain a relation between the electric fields and concentrations far inside the two buffers,
 |
(4) |
The first of these relations can also be considered a consequence of the (approximate) time independence of the Kohlrausch regulating function ω(x)=∑ici(x)∕μi.18, 19
Now, consider a channel of total length L=L−+L+, where L− and L+ are the length of the sections filled with TE and LE, respectively. In a situation where the voltage U applied along the channel is fixed, we have U=L−E−+L+E+, neglecting the width of the transition zone. In combination with Eq. 4, we find
| (5) |
where l=L−∕L is the relative position of the transition zone along the channel. As the transition zone migrates and consequently l increases, the electric field both in the LE and TE decreases.
In order to find the ion concentrations across the transition zone, we investigate the molar current of each species in a frame of reference moving with the average ITP velocity,
| (6) |
composed of diffusion and electromigration contributions. The diffusion coefficient and mobility are related by the Einstein relation . Owing to species conservation, ∂xNi=0, the molar current is constant along the channel in this frame of reference. In particular, we can equate the current close to the transition zone with the one far inside the LE and TE where the concentrations are close to constant. Due to Eq. 1, this becomes Ni=0 for i∊{−,+}, which can be rearranged to
| (7) |
where is a normalization constant. Subtracting the equations for i∊{−,+} and integrating, we obtain for the ratio of the concentrations (cf. Ref. 20),
| (8) |
The electric field can now be obtained from current conservation, Eq. 2,
| (9) |
where ΔE=E−−E+, the parameter α was defined in Eq. 4, and for clarity we have made the x dependence explicit. By inserting this expression into Eq. 7 and integrating, we finally obtain an explicit expression for the concentration of the TE anion,
| (10) |
with F(a,b;c;z) being the hypergeometric function.21 Note that E−∕ΔE can be fully expressed in terms of the electrophoretic mobilities via Eq. 4 or Eq. 5. The corresponding expressions for c+(x) and E(x) follow directly from Eqs. 8, 9. In Fig. 1, we show the concentration profiles and electric field close to the transition zone for the exemplary parameters given in Table 1. Note that the electric field changes rapidly in the region between x=±4∕(βeΔE), as indicated by the vertical lines. We will use this interval as a measure of the transition zone width, i.e., we define
| (11) |
Figure 1.
Concentrations (ci, i∊{−,+,0}, represented by a solid, a dotted, and a dashed-dotted line, respectively) and electric field in the transition zone region according to Eqs. 8, 9, 10. The parameters chosen are listed in Table 1. The vertical lines correspond to x=±4∕(βeΔE).
Table 1.
Parameters used for the test case.
Forces acting on a particle in an ITP transition zone
In an ITP transition zone, large concentration and electric-field gradients occur that lead to DEP and electrohydrodynamic forces. However, also the zeta potential of the particle surface may vary due to the different electrolyte properties, changing the particle’s electrophoretic mobility. In the following, we estimate the relative importance of these effects for particle transport in an ITP transition zone.
The dielectrophoretic force on a spherical particle in a homogeneous field gradient is given by13
| (12) |
where the indices p and m refer to the particle and medium, respectively, and the complex permittivity depends on the conductivity σk and the frequency ω of the applied electric field. Assuming a static electric field and vanishing conductivity of the particle, this reduces to
| (13) |
which is directed toward regions of lower electric-field strength.
In an inhomogeneous electric field resulting from a gradient in conductivity, another force due to space charges is of a similar magnitude as the DEP force, as pointed out by Kang and Li.15 Essentially, their argument is as follows. From Maxwell’s equations, we obtain a free charge density equal to ρf=εm∂xE, resulting in a body force density . In analogy to the hydrostatic pressure in a gravitational field, this leads to an electrohydrostatic (EHS) pressure across the transition zone,
| (14) |
For a particle located in the transition zone, the pressure will thus be higher on the side facing the TE than on the side facing the LE, and a net force drives the particle in the direction of the LE reservoir. Expanding the EHS pressure to first order in x around the center of the transition zone, i.e., , and integrating over the surface of a spherical particle, the force becomes
| (15) |
The contribution from the space charge region in the medium is thus of the same order as the one from the DEP force and acts in the same direction. The total force on the particle due to the inhomogeneous electric field is thus approximately Fel≈2FDEP. The much more detailed analysis by Kang and Li also taking into account the perturbation of the electric, concentration, and flow field due to the presence of the sphere arrives at the same conclusion with a slightly larger prefactor. [Unfortunately, in going from their Eq. (71) to Eq. (73), Kang and Li produce an error of a factor of 8 and conclude that the force due to the space charge region is an order of magnitude higher.] However, note that here we are only seeking an order-of-magnitude estimate, and that neither derivation accounts for all physical effects relevant for particles in ITP transition zones. In the spirit of Eqs. 13, 15, and assuming that 2r<Δx, we thus estimate the force on a sphere to be
| (16) |
As the particle moves through the fluid, the driving force will be balanced by the viscous drag
| (17) |
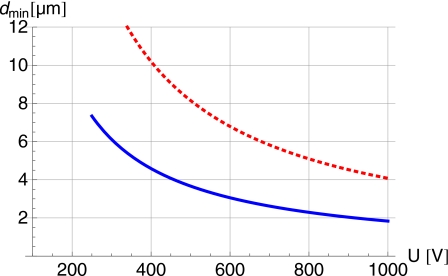
where η is the fluid viscosity and u the particle velocity. From the force balance, we obtain an approximate expression for the minimal diameter dmin a particle can have in order to move along with the ITP transition zone by DEP and EHS forces. This diameter is shown in Fig. 2 as a function of voltage for two positions in the channel. Mobilities, concentrations, and the channel length were again chosen according to Table 1, however, with variable applied voltage U and transition zone position l, corresponding to different values of uITP. We remark that in all cases considered, 2r<Δx is fulfilled. In fact, in our simple model system, the ratio 2rmin∕Δx can be expressed as .
Figure 2.
Minimal diameter of beads transported along with the ITP transition zone according to Eqs. 17, 16 and for the parameters given in Table 1 [however, uITPwas calculated according to Eqs. 1, 5, and l was varied]. The solid line corresponds to l=0.35 and the dashed one to l=0.8.
Note that the viscous drag scales with the radius of the particle, while the DEP force scales with the volume, so larger particles experience a stronger DEP force, at least for particle diameters 2r<Δx.
By Eq. 1, the last factor in Eq. 16 can be recast into
| (18) |
where g(x)=(1+x)(1−x)2. This displays the cubic dependence of the force on the electric field, and also on the ratio of the buffer mobilities, since g(x)∼x3 for large x. Since the drag force on a particle transported along with an ITP zone is proportional to the ITP velocity, it only scales linearly with the electric field.
Let us, however, again stress the fact that the presented analysis only provides an order-of-magnitude estimate. Apart from the approximations that have been made to arrive at the force estimate, any actual electrolyte system in ITP experiments usually behaves in a much more complex way than our simple model system. For example, the pH will typically vary along the channel length giving rise to different degrees of dissociation and thereby varying effective electric mobilities of buffer ions. Second, electrolytes are almost never pure but will contain contaminants that will form different sample regions, each featuring their own transition zones,3 so that the increase in electric-field strength between LE and TE may as well take several steps. Third, when many beads are picked up at a transition zone and their packing becomes dense, dipole-dipole interactions between the beads are also expected to play a role. In addition to that, at high densities of beads at the transition zone, they form a plug moving along the channel that will not only induce a hydrodynamic flow but also reduce the drag coefficient per bead due to hydrodynamic interactions.
Also note that in going from Eq. 12 to Eq. 13, we have assumed a vanishing conductivity of the particle, which can only be an approximation. Even if its bulk conductivity is very low, surface conductivity will usually play a significant role, in particular for small particles. Taking only surface conductivity into account, the particle conductivity becomes22 σp=2Ks∕r, where Ks is the surface conductance, which is of the order of 1 nS for polystyrene particles between 100 nm and 2 mm diameters in KCl electrolyte.23 For 1–10 μm particles, this corresponds to conductivities in the range from 4 to 0.4 mS∕m. This has to be compared to the conductivities of the medium, which for the model system of Table 1 are 54 and 10 mS∕m for the LE and TE, respectively. In the static limit, the Clausius–Mosotti factor in Eq. 12, , becomes (σp−σm)∕(σp+2σm), varying in the range from −1∕2 to 1 for low and high particle conductivities, respectively. Taking the conductivity of a 1 μm particle and the one of pure TE for the medium, the Clausius–Mosotti factor reduces to −1∕4, showing that the DEP force is halved, while for the 10 μm particle the correction is negligible. On the other hand, from our simple argument given above, we would expect the EHS force component to remain the same. For our order-of-magnitude estimate, this means that the curves for the minimal diameter of beads transported along with the ITP zone in Fig. 2 are shifted to slightly larger diameters. Note also that for highly conductive particles or when using buffers of low conductivity, the DEP force may even change its sign, pointing in the direction of higher field strength, preventing particles to be swept along with the transition zone.
Owing to charges at their surface, the beads also acquire an “intrinsic” electrophoretic mobility. This mobility is again strongly dependent on buffer composition and in particular on pH,16, 17 all of which change drastically between the different electrolyte zones in an ITP experiment. In typical electric fields of the order of E∼50 V∕mm and for a zeta potential of ζ∼25 mV, the electrophoretic migration velocity given by the Helmholtz–Smoluchowski formula uEP=(εmζ∕η)E is of the order of 0.9 mm∕s, which is well above the magnitude to the ITP velocity in our example. Thus, it is likely that if a particle carries a net charge in the TE, while it remains uncharged in the LE, it will move along with the transition zone. It is expected to be trailing slightly behind the transition zone which, however, is difficult to discern experimentally due to the small extension of the zone. Along the same lines, we also mention diffusiophoresis as a related effect on particles with a nonvanishing zeta potential in an electrolyte concentration gradient.24
A discrimination between transport due to electric-field gradients (DEP forces) on the one hand and electrophoretic transport of particles on the other hand becomes, nevertheless, possible at low applied electric fields. In this case, the transition zone becomes wider and gradient forces are too small to overcome the viscous drag on a sphere moving along with the ITP velocity, cf. Fig. 2. Electrophoretic particle transport, on the other hand, scales with the electric field in the same way as ITP transport, and an accumulation of particles behind a transition zone is still possible.
EXPERIMENT
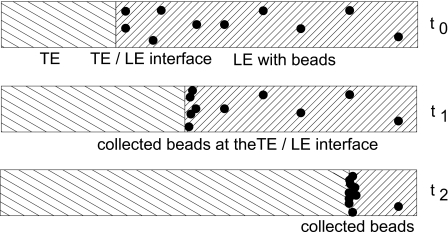
A series of experiments was conducted in order to characterize the behavior of particles at the TE∕LE interface. First, the experimental conditions required for transporting polystyrene beads along with the interface were determined. This includes variations of the particle diameter and the applied voltage. A schematic drawing of the concept of a bead collector is shown in Fig. 3. At the start of the experiment, beads are dispersed inside the LE contained in a microchannel. After applying a voltage, a transition zone is formed and moves toward the anode. When the transition zone passes the dispersed beads, these are collected and carried along with it.
Figure 3.
Schematic operation of the bead collector. As the ITP transition zone sweeps along the channel, beads dispersed in the LE are collected and move along with the zone.
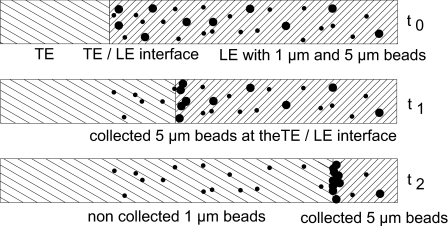
Second, experiments with mixtures of beads of different sizes distributed in the LE were performed in order to assess whether a size separation is possible. A corresponding schematic drawing is shown in Fig. 4. Two different types of beads are dispersed inside the LE. After the transition zone is formed and moves toward the anode, only the 5 μm diameter beads are collected at the interface and carried along with it. The smaller-sized beads still stay in their place.
Figure 4.
Bead separation. Two different types of beads are dispersed in the LE at the start of the experiment. In this case, only one type is swept along with the transition zone, while the other is left behind in the TE.
Instrumentation, materials, and experimental conditions
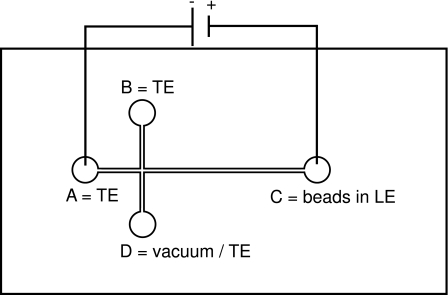
All experiments were performed using the following materials and instrumentation. The microfluidic cross-channel chips (Fig. 5) were fabricated at the Institut für Mikrotechnik Mainz (IMM) using Cyclo Olefin Polymer (COP, Zeonor 1420R) substrates of 2 mm thickness. All channels, fabricated through laser ablation (Lambda Physik LPX110i excimer laser), are 50 μm in width and 20 μm in depth. All reservoirs (A–D in the figure), fabricated through milling, have a diameter of 5 mm. The chips were covered by a 100 μm thick COP foil via solvent bonding. After bonding, the chips were tempered for 20 h at 80 °C in vacuum (4.5 psi). The total channel length A–C amounts to 35 mm, from the junction to reservoir C the length is 27.5 mm. The surface roughness of channels fabricated in that way is typically characterized by Ra values in the range between 0.3 and 0.5 μm.
Figure 5.
Cross-channel chip with filling options for the reservoirs.
Before use, the reservoirs are filled with their corresponding electrolytes (50 μl each). The channels are filled by creating a low pressure at reservoir D for 5 s using a 10 ml syringe. After removal of the syringe, reservoir D is also filled with 50 μl of electrolyte to avoid hydrostatic pressure differences from different filling heights.
When filling the chip in that way, the electrolytes of different mobilities are stacked consecutively in the main channel (A–C). The electric potential is provided by a LABVIEW controlled high-voltage supply (ISEG CIO8FMO 2BPp-5HV) connected via platinum electrodes dipped into the reservoirs A and C. We apply the anodic electrical contact to reservoir C. All experiments are done at constant voltage. The beads are observed with an inverted microscope (Nikon ECLIPSE Ti) using a CCD camera (Nikon digital sight DS-Qi1Mc).
The electrolyte compositions during all experiments are as follows. The LE consists of 10 mM formic acid (Roth 4724.3) and 5 mM DL-Histidine (Fluka 53330); the TE consists of 8 mM MES (Sigma M3671) and 5 mM DL-Histidine. The solutions were filtered with a 0.45 μm PTFE syringe filter (Roth). The pH value of the LE is 4.0 and of the TE is 6.0, measured with a microprocessor pH meter (HAN-NA instruments pH 211). We use the above buffers as the result of optimizing the TE and LE composition with respect to achieving a large difference in electric field across the TE∕LE interface, a narrow extension (≤20 μm) of the transition zone, while limiting the potential drop (≤2 kV) and the ITP velocity (∼0.3 mm∕s) during the experiment. For this purpose, simulations using the software SPRESSO V0.1 (Ref. 25) were conducted. [From these simulations, also the model parameters of Table 1 were derived to approximately match mobilities and conductivities.] To suppress electro-osmotic flow (EOF) in the channel, 1% (w∕v) polyvinylpyrrolidone MG40000 (Merck 1.07370.0100) is added to both electrolytes.26
The experiments for the bead collector were conducted with Fluoro MAX Green Fluorescent Polymer Particles of 5 μm diameter (Thermo Scientific Particle Technology Catalog No. G0500). 5 μl of the solution containing the beads was diluted to 100 μl with LE and homogenized by vortexing (Vortex Genie 2, Scientific Industries) for 10 s before use.
The experiments for bead separation were done with different combinations of beads of two different sizes suspended within the LE. For this purpose, 2.5 μl of a solution with fluorescent polymer particles with a diameter of either 1, 2, 3, or 10 μm, together with 2.5 μl of a solution with 5 μm particles (Thermo Scientific Particle Technology Catalog Nos. G0100, G0200, G0300, G0500, and G1000), was diluted to 100 μl and homogenized by vortexing (Vortex Genie 2, Scientific Industries) for 10 s before use.
Experimental procedure
Electro-osmosis and electrophoresis
In order to suppress EOF in the channel, 1% (w∕v) PVP is added to both electrolytes before use, as mentioned above. To determine the remaining EOF in the PVP coated channels, we recorded the characteristic current curve (using the method of Huang et al.27) from both the LE and the TE.
The electrophoretic velocity of the beads in the TE and LE alone was determined by carrying out the channel filling procedure with the same electrolyte deposited in all reservoirs using a bead suspension (5 μm beads) in reservoir C as before. After application of a voltage (1 kV) between reservoirs A and C, the electrophoretic velocity of the beads can be determined by the time they take to travel a specified distance, assuming that the EOF is suppressed.
Bead collection
It was first investigated whether the 5 μm beads are collected at and transported along with the transition zone. A dc voltage fixed during the course of an experiment is applied between reservoirs A and C. Between different experiments, the voltage is varied in a range between 100 and 3000 V.
In order to identify the position of the beads, markings with a separation of approximately 1 mm were carved into the chip close to the channel. This scale was calibrated by measuring the marker spacing with Nikon’s NIS-ELEMENTS software. The channel crossing is chosen as the origin. The accuracy of the position measurement is estimated to be ±13 μm. Usually, a whole cluster of beads is transported along with the ITP zone. The time of passage of the first bead in the cluster is chosen as the time of the cluster to reach a certain position. The frame rate of the CCD camera was set to 8.3 frames∕s, determining the accuracy of the runtime measurement to be ±120 ms.
Bead separation
This set of experiments investigates the possibility to separate beads of different sizes in the chosen ITP system. A dc voltage of 1000 V is applied between reservoirs A and C. The following pairs of bead diameters have been analyzed: (5 μm, 1 μm), (5 μm, 2 μm), (5 μm, 3 μm), and (5 μm, 10 μm).
RESULTS
Electro-osmosis and electrophoresis
Neither an anodic nor a cathodic EOF could be observed in the TE or LE. The PVP coating is thus effective in suppressing EOF for our electrolyte system.
The experiments for determining the migration velocity of the 5 μm beads in pure LE show a movement of about 70%–80% of the beads toward the anode at a velocity of the order of 60 μm∕s at an electric field of 28.5 V∕mm (1 kV applied voltage). The remaining beads are immobile. The experiments with 5 μm beads in pure TE show an electrophoretic drift velocity of approximately 110 μm∕s toward the anode at the same applied voltage. This indicates that even if PVP is effective in suppressing EOF in the channels, it is not effective in neutralizing all charge groups on bead surfaces. According to the manufacturer of the beads, their surface is covered with carboxyl and sulfate groups resulting from the production process. Additionally, the beads are shipped in a solution containing anionic surfactants (with -groups) adsorbing to the particle surface.
The experiments for determining the migration velocity of the 1 μm beads in pure LE show a movement of all beads toward the cathode at a velocity of the order of 7 μm∕s. The same beads in pure TE migrate in the same direction with a velocity of 50 μm∕s. Note, however, that the pure TE composition may be different from the composition a particle encounters behind the transition zone, since the concentrations adjust according to the Kohlrausch regulating function.
Bead collection
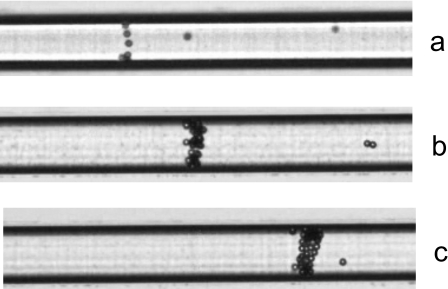
After application of the voltage (800 V), the transition zone is transported electrophoretically toward the anode. When this zone passes the 5 μm diameter beads that are sparsely dispersed in the LE, they are collected and carried along with it. As the beads accumulate, a growing cluster is formed that is transported along the channel. Figure 6 shows the formation of the cluster in the microchannel after 5, 60, and 120 s. More than 95% of the beads are picked up in this way and get transported toward the anode reservoir.
Figure 6.
Collected 5 μm beads at the transition zone interface after (a) 15 s, (b) 60 s, and (c) 120 s. The applied voltage is 800 V. The movie shows capture and transport of 5 μm diameter beads at the ITP transition zone at an applied voltage of 800 V. The bead movement is from left to right and starts at a position close to the injection cross and ends close to the LE reservoir. The camera position is manually adjusted in order to track the bead cluster (enhanced online). [URL: http://dx.doi.org/10.1063/1.3555194.1]
The majority of beads distributed in the LE do not show any movement until they are reached by the transition zone and carried along. This indicates that their electrophoretic motion is largely suppressed, which stands in contrast to the experiments on electrophoretic mobility in the pure buffers alone. Nevertheless, some (10%–20%) of the beads slowly migrate toward the cathode after application of the voltage. When they are 100–200 μm away from the transition zone, their migration velocity is reversed and finally synchronizes with the ITP velocity.
Apart from the influence of the transition zone on the beads, their different behavior in the ITP system on the one hand and in the pure electrolytes on the other hand could be explained by impurities contained in the electrolytes. When only using a single electrolyte, impurities should remain distributed more or less homogeneously inside the liquid. On the other hand, in an ITP experiment with two electrolytes, potential impurities may get collected close to the transition zone, so contaminants become extracted from both the TE and LE. Since, for example, the zeta potential of a particle depends on the composition of the surrounding electrolyte, this could explain the different behavior of particles in the ITP experiments as compared to the plain electrolytes. In fact, we will present below the evidence for impurities playing a role in our experiments.
Since due to the approximate conservation of the Kohlrausch regulating function, the TE buffer composition in the region between the injection cross and reservoir C is different from its initial composition, the electrophoretic mobility of the beads may also be different in this zone compared to the experiments conducted in pure TE. Therefore, experiments were repeated with 5 μm beads initially dispersed in the TE. Contrary to the anodic drift in pure TE, the beads do not show any coherent movement in this case as long as they remain in the region to the left of the injection cross initially occupied by TE. However, now and then, a bead migrates toward the anode, and as soon as it enters the region initially filled with LE, its velocity increases drastically and it soon catches up with the transition zone where it is then carried along. This is an indication that, in this case, the different electrophoretic mobilities in the different zones play a crucial role for the capture and transport of beads at the transition zone. On the other hand, only beads that already move toward the anode in the original TE enter the region between the injection cross and reservoir C, and hence the rapid increase in velocity may well be solely due to the higher electric field in this region compared to the original TE region instead of an altered electrophoretic mobility.
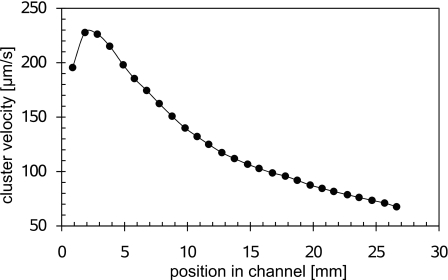
Figure 7 shows the velocity of the particle cluster during an experiment as a function of the position in the channel. The shown positions are the averages from three experiments conducted at 800 V. The initial increase in velocity is due to the automatic adjustment control of the voltage source, which takes several seconds to reach the selected value. Apart from that, the velocity decreases toward the anode reservoir. This is due to the fact that an increasing fraction of the channel is filled with the lower conductivity TE, and hence the current decreases.
Figure 7.
Velocity of the particle cluster as a function of position in the channel at a voltage of 800 V.
Corresponding experiments have been conducted for a range of different voltages extending from 100 to 3000 V. All of these demonstrate that the 5 μm beads are collected and carried along with the transition zone. However, as expected, the width of the region in which the particle cluster is located increases with decreasing voltage. For voltages below 300 V, the width becomes so large that one can hardly speak of a particle cluster anymore. This is shown in Fig. 8, displaying the cluster for different voltages at a position of 20 mm behind the channel junction.
Figure 8.
Bead cluster at (from top to bottom) 2000, 1000, 500, and 300 V at positions 5 mm (left) and 20 mm (right) behind the injection cross.
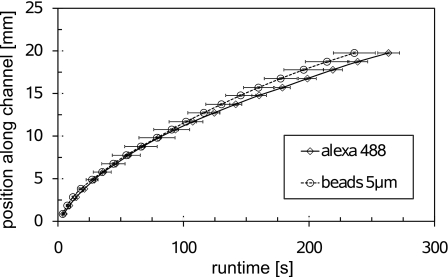
In order to confirm that the beads are indeed carried along with the transition zone, a sample of Alexa Fluor 488 (Alexa Fluor 488 carboxylic acid TFP ester from protein labeling kit A10235, Molecular Probes) initially dissolved in TE is sandwiched between the plain buffers (containing no beads) via injection through port B. The position of the Alexa Fluor dye during the ITP experiment is recorded by observing its fluorescence in an epifluorescence microscope. Figure 9 shows the positions of the 5 μm diameter beads and of the dye as a function of time for an applied voltage of U=800 V. Up to a distance of 10 mm, the two curves are indistinguishable, but later the beads run slightly faster. However, even up to 20 mm, the difference between the curves is still within one standard deviation of three experiments. A possible reason for the difference between the curves may be the use of different chips for the experiments with the beads and the dye. Nevertheless, we conclude that the beads are indeed carried along with the transition zone.
Figure 9.
Position of the beads and a fluorescent dye (Alexa 488) as a function of time for a voltage of U=800 V. Error bars indicate the standard deviation from three measurements.
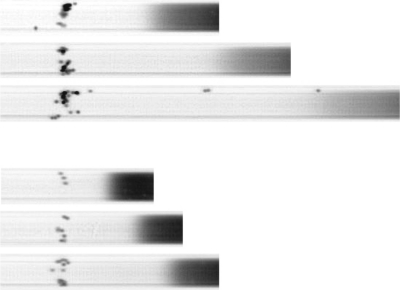
To corroborate this, both a sample of Alexa Fluor 488 injected at the channel crossing and 5 μm beads dispersed in the LE and picked up by the transition zone were observed simultaneously in one experiment. As it turns out, the beads are trailing slightly behind the dye, cf. Fig. 10. While the transition zone moves along, the beads distributed in the LE are passed by the dye zone and collected behind it. We observed a corresponding gap of about 50 μm at a distance of 5 mm along the channel. During the experiment, this gap widens to 115 μm at 10 mm, 214 μm at 15 mm, and 355 μm at 20 mm. The gap can be interpreted as an intermediate zone of ions and hints toward the presence of impurities in the electrolytes that have a mobility between the corresponding values for the TE and LE.3 The growth of the gap size is on the one hand due to the decrease of the electric-field strength as more and more of the channel fills with TE, and possibly also due to accumulation of impurities during the experiment. According to Khurana and Santiago, one of the likely candidates for dissolved impurities is carbamate, originating from a reaction of the amino group of histidine with CO2 from the ambient air. The authors propose the addition of barium hydroxide to the TE to precipitate the carbamate ions. Accordingly, we have repeated the experiments, adding 7 mM Ba(OH)2 (Carl Roth, Article No. P009.2) to the TE, and indeed observed a considerable reduction in gap width between the dye and the beads. At 5 mm, the gap is reduced to 39 μm, at 10 mm to 53 μm, at 15 mm to 94 μm, and at 20 mm to 131 μm. Figure 10 shows the gap during an ITP experiment before and after addition of barium hydroxide to the TE in comparison. However, the fact that even after addition of barium hydroxide, a gap remains, suggests that there are additional impurities that could not be precipitated.
Figure 10.
Gap between Alexa (dark region) and 5 μm beads before (top group) and after (bottom group) addition of Ba(OH)2 at a position of 10, 15, and 20 mm (from top to bottom) along the channel.
Bead separation
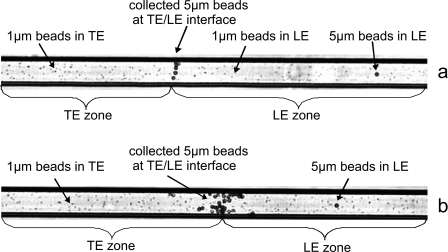
The experiments with beads of different sizes show that 5 μm diameter polystyrene beads can indeed be separated from 1 μm beads with the present setup. As in the previous experiments, the 5 μm diameter beads are collected and transported along with the transition zone toward the anode. On the other hand, the 1 μm beads distributed in the LE start migrating toward the cathode when a voltage is applied. Experiments conducted with 1 μm beads in pure LE show that the average migration velocity is 7.7 μm∕s±0.7 μm∕s at 28.5 V∕mm (average from three experiments, U=1000 V). The 1 μm beads are not picked up by the transition zone but migrate into the TE. When they are passed by the cluster of collected 5 μm beads and enter the TE region, their movement is heterogeneous; some move toward the anode, some toward the cathode, and some irregularly. Figure 11 shows that only the 5 μm beads are transported toward the anode with the ITP transition zone, while the 1 μm beads remain in the TE after passage of the particle cluster while continuing to migrate toward the cathode. However, despite the fact that the electric field is larger behind the transition zone, the velocity of the 1 μm beads remains approximately the same when passing the transition zone, again indicating that the electrophoretic mobility changes when passing to different buffer systems.
Figure 11.
Separation of 5 μm beads from 1 μm beads at the transition zone after 18 s (top) and 210 s (bottom). The applied voltage is U=1000 V.
Further experiments with bead mixtures containing different sizes show that a reliable separation of 2 μm from the 5 μm beads is no longer possible with the chosen setup. Only some of the smaller beads are carried along by the transition zone for a limited time, but a very clear distinction as in the case of 1 and 5 μm beads could not be achieved. A similar picture emerges when using a mixture of 3 and 5 μm diameter beads. Again, both the 2 and 3 μm beads migrate toward the cathode in the LE, while the picture is less clear after passing the transition zone. In particular, in the initial stages of the experiment, the smaller beads show a distinct migration toward the anode in the TE zone, while in later stages no clear migration direction can be observed. We also note that the packing of 5 μm beads at the transition zone becomes much less dense in the later stages of these experiments compared to the cluster observed when only 5 μm beads are present. For a mixture of larger beads of 5 and 10 μm diameters, no separation is possible either, since both species are transported toward the anode with the transition zone, as shown in Fig. 12. Again, the bead cluster becomes less dense as the experiment progresses. Also, instead of moving along as a rigid package, there is some relative motion within the bead cluster. It seems that some beads periodically stick to the channel wall and when released rush forward as the zone progresses, leading to some swirling motion within the bead package. A charge transfer between beads may also play a role in this internal motion, which may for the 10 μm beads even lead to their escape from the bead cluster, after which they start migrating electrophoretically toward the cathode.
Figure 12.
Simultaneous transport of 5 and 10 μm beads at the transition zone (a) after 23 s and (b) after 90 s. The applied voltage is U=1000 V. The movie shows the transport and demonstrates the considerable internal motion that is observed within the cluster. From time to time, the camera position is manually adjusted in order to track the bead cluster moving from left to right (enhanced online).[URL: http://dx.doi.org/10.1063/1.3555194.2]
DISCUSSION AND CONCLUSION
The presented experiments show that isotachophoretic transport and separation of micron sized particles at ITP zone boundaries is feasible. The fact that the surface properties of differently sized particles seem to vary (as discussed in Secs. 4A, 4C) complicates the interpretation of the experiments. In any case, the forces listed in Sec. 2B should have an influence on the particle transport inside ITP transition zones. As is evident from Fig. 8, beads are transported along with the transition zone for a wide range of applied voltages. The fact that even for quite low electric fields the particles are picked up by the transition zone could indicate that beyond the dielectrophoretic and electrohydrostatic forces, the charging of the particle surface when moving from the LE to the TE region could play a role. From our estimates, the DEP and EHS forces scale as∼E3, making it unlikely that these govern particle transport at low electric fields. In other words, particle transport is likely to be partially due to their electrophoretic mobility that is “switched on” when entering the TE. This change in electrophoretic mobility is expected since both pH and electrolyte compositions differ in the various electrolyte zones, both of which are known to have an impact on the zeta potential of polymer materials. At this point, it is therefore not possible to discern the influence of forces due to electric-field gradients, such as DEP, present at high fields, from the electrophoretic motion also present at low fields.
In our experiments, we have shown that strictly not a single transition zone forms between the TE and LE, but there are potentially several transition zones due to impurities in the electrolytes. This further complicates the interpretation of the results on particle transport. The occurrence of several transition zones means that in each zone, the drop in electric field (and, correspondingly, the field gradient) is smaller than it would be for a single transition zone only.
In addition to particle transport, we have shown that separation of different particle types is possible at an ITP transition zone. In particular, in our experiments, beads of 1 μm diameter are not picked up by the transition zone, so that a separation from 5 μm sized beads which are carried along is feasible. For other combinations of bead sizes, a reliable separation was not possible.
We wish to emphasize that to the best of our knowledge, separation of micron sized particles by means of isotachophoresis has never been demonstrated before. In addition, we have only performed a few experiments with which we have by far not been able to explore the full parameter space of the problem. For example, one could extend the range of electric-field strengths, work with time-varying fields, use different electrolytes, or even deliberately utilize more than two electrolytes to achieve a fractionation instead of simply a separation. Therefore, it is conceivable that this technique bears a large potential for optimization and more selective separation protocols.
In comparison to other techniques for particle separation, especially dielectrophoresis, our approach has some distinct advantages. Dielectrophoresis requires specific microstructures to generate the necessary electric-field gradients.14 Our technique utilizes the physics of isotachophoresis, especially the balance of diffusion and electromigration currents within the transition zone, to create the field gradients and does therefore not require any sophisticated microstructures. It is worthwhile to note that the length scale Δx over which the drop in electric-field strength occurs is of the same order of magnitude as the electrode spacing in typical DEP setups. Similar to DEP, it may not only be used for particle separation, but also for particle concentration. As an ITP zone sweeps through a channel, it can collect the particles in the LE and concentrate them in a narrow region around the transition zone. It suggests itself that the same technique may also be applied to cells, bacteria, or other biological material. At any rate, the method may open up an exciting new field of applications for isotachophoresis.
ACKNOWLEDGMENTS
This work was supported by the German Research Foundation (DFG) through Grant No.HA 2696∕12-1 and Cluster of Excellence 259.
References
- Gebauer P., Mala Z., and Bocek P., Electrophoresis 30, 29 (2009). 10.1002/elps.200800425 [DOI] [PubMed] [Google Scholar]
- Chen L., Prest J. E., Fielden P. R., Goddard N. J., Manz A., and Day P. J. R., Lab Chip 6, 474 (2006). 10.1039/b515551g [DOI] [PubMed] [Google Scholar]
- Khurana T. K. and Santiago J. G., Lab Chip 9, 1377 (2009). 10.1039/b815460k [DOI] [PubMed] [Google Scholar]
- Lin C. C., Hsu B. K., and Chen S. H., Electrophoresis 29, 1228 (2008). 10.1002/elps.200700479 [DOI] [PubMed] [Google Scholar]
- Persat A., Marshall L. A., and Santiago J. G., Anal. Chem. 81, 9507 (2009). 10.1021/ac901965v [DOI] [PubMed] [Google Scholar]
- Schmitz G., Möllers C., and Richter V., Electrophoresis 18, 1807 (1997). 10.1002/elps.1150181015 [DOI] [PubMed] [Google Scholar]
- Böttcher A., Schlosser J., Kronenberg F., Dieplinger H., Knipping G., Lackner K. J., and Schmitz G., J. Lipid Res. 41, 905 (2000). [PubMed] [Google Scholar]
- Asakawa T., Sunazaki S., and Miyagishi S., Colloid Polym. Sci. 270, 259 (1992). 10.1007/BF00655478 [DOI] [Google Scholar]
- Bücking W. and Nann T., IEE Proc.: Nanobiotechnol. 153, 47 (2006). 10.1049/ip-nbt:20050043 [DOI] [PubMed] [Google Scholar]
- Pyell U., Bücking W., Huhn C., Herrmann B., Merkoulov A., Mannhardt J., Jungclas H., and Nann T., Anal. Bioanal. Chem. 395, 1681 (2009). 10.1007/s00216-009-2887-5 [DOI] [PubMed] [Google Scholar]
- Persat A. and Santiago J. G., New J. Phys. 11, 075026 (2009). 10.1088/1367-2630/11/7/075026 [DOI] [Google Scholar]
- Goet G., Baier T., and Hardt S., Lab Chip 9, 3586 (2009). 10.1039/b914466h [DOI] [PubMed] [Google Scholar]
- Jones T. B., Electromechanics of Particles (Cambridge University Press, New York, 1995). 10.1017/CBO9780511574498 [DOI] [Google Scholar]
- Pethig R., Biomicrofluidics 4, 022811 (2010). 10.1063/1.3456626 [DOI] [PMC free article] [PubMed] [Google Scholar]
- Kang K. H. and Li D., J. Colloid Interface Sci. 286, 792 (2005). 10.1016/j.jcis.2005.01.049 [DOI] [PubMed] [Google Scholar]
- Kirby B. J. and Hasselbrink E. F., Electrophoresis 25, 187 (2004). 10.1002/elps.200305754 [DOI] [PubMed] [Google Scholar]
- Kirby B. J. and Hasselbrink E. F., Electrophoresis 25, 203 (2004). 10.1002/elps.200305755 [DOI] [PubMed] [Google Scholar]
- Kohlrausch F., Ann. Phys. 298, 209 (1897). [Google Scholar]
- Hruška V. and Gaš B., Electrophoresis 28, 3 (2007). 10.1002/elps.200600513 [DOI] [PubMed] [Google Scholar]
- MacInnes D. A. and Longsworth L. G., Chem. Rev. 11, 171 (1932). 10.1021/cr60039a001 [DOI] [Google Scholar]
- Handbook of Mathematical Functions with Formulas, Graphs, and Mathematical Tables, edited by Abramowitz M. and Stegun I. A. (Dover, New York, 1964). [Google Scholar]
- O’Konski C. T., J. Phys. Chem. 64, 605 (1960). 10.1021/j100834a023 [DOI] [Google Scholar]
- Ermolina I. and Morgan H., J. Colloid Interface Sci. 285, 419 (2005). 10.1016/j.jcis.2004.11.003 [DOI] [PubMed] [Google Scholar]
- Anderson J. L., Annu. Rev. Fluid Mech. 21, 61 (1989). 10.1146/annurev.fl.21.010189.000425 [DOI] [Google Scholar]
- Bercovici M., Lele S. K., and Santiago J. G., J. Chromatogr., A 1216, 1008 (2009). 10.1016/j.chroma.2008.12.022 [DOI] [PubMed] [Google Scholar]
- Kaneta T., Ueda T., Hata K., and Imasaka T., J. Chromatogr., A 1106, 52 (2006). 10.1016/j.chroma.2005.08.062 [DOI] [PubMed] [Google Scholar]
- Huang X., Gordon M. J., and Zare R. N., Anal. Chem. 60, 1837 (1988). 10.1021/ac00168a040 [DOI] [PubMed] [Google Scholar]


