Abstract
The greatest difference in distortion product otoacoustic emission (DPOAE) suppression tuning curves (STCs) in infant and adult ears occurs at a stimulus frequency of 6 kHz. These infant and adult STCs are much more similar when constructed using the absorbed power level of the stimulus and suppressor tones rather than using sound pressure level. This procedure incorporates age-related differences in forward and reverse transmission of sound power through the ear canal and middle ear. These results support the theory that the cochlear mechanics underlying DPOAE suppression are substantially mature in full-term infants.
Distortion product otoacoustic emission (DPOAE) suppression tuning curves (STCs) in neonatal ears differ most from those in adult human ears at a DPOAE stimulus frequency (f2) of 6 kHz, with a more narrow STC in neonates and a steeper slope on the low-frequency side (Abdala, 2001a). These maturational differences can neither be explained by auditory aging in normal-hearing adults (Abdala, 2001b) nor by immaturities in outer hair cell function in infants (Abdala, 2005). In contrast, differences in DPOAE input–output (I∕O) functions at this f2 frequency can be explained by a model in which cochlear mechanics are mature and ear-canal and middle-ear function are immature (Abdala and Keefe, 2006). This model calculated maturational differences in forward transmission through the ear canal and middle ear of the stimulus tones at frequencies f2 and f1 = f2∕1.2, which elicited the DPOAE, and in reverse transmission of the resulting DPOAE at frequency 2f1–f2. Although differences in DPOAE STCs between full-term infants and adults were explained by the immaturities in ear-canal and middle-ear function, the I∕O-based model failed to explain the differences in DPOAE STCs between 6-month-olds and adults. The mean forward-transmission immaturity was only 2 dB at the age of 6 months relative to adults, which was not significantly different from 0 dB. This was in contrast to the marked immaturities in the mean DPOAE STC at the age of 6 months, which was not yet adult-like. A more elaborate model, which was developed based on measurements of DPOAE suppression and reflectance in the same ears, separated the measured immaturities in forward and reverse transmission into distinct ear-canal and middle-ear components (Keefe and Abdala, 2007). Nevertheless, this more powerful model again failed to explain differences in DPOAE STCs between 6-month-olds and adults. While both models considered the role of functional immaturity at the DPOAE stimulus and 2f1–f2 frequencies, neither model considered the immaturity in forward transmission at each suppressor frequency.
Recently, stimulus frequency otoacoustic emissions (SFOAEs) in adult human ears have been compared for STCs based either on the absorbed sound power or on the sound pressure level (SPL) of suppressor tones across the range of suppressor frequencies (Keefe and Schairer, 2011). At a probe frequency of 8 kHz to elicit the SFOAE, the SFOAE STC had a greater tip-to-tail level difference and was thus narrower, when constructed on the basis of the absorbed sound power of the suppressor compared to the SPL of the suppressor. A large contributor was the presence of standing waves in the ear-canal pressure for the higher-frequency suppressor tones. Specifying the suppressor tones on the basis of absorbed sound power removed these standing wave effects. The present study investigated the extent in which a measurement of a power-based DPOAE STC explained the observed difference in the pressure-based DPOAE STCs between infants and adults, for which the critical STC parameter was the tip-to-tail level difference.
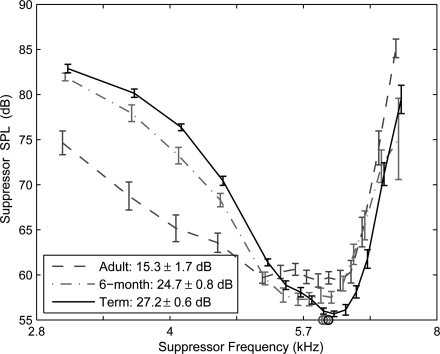
DPOAEs were elicited in all infant and adult ears using stimulus frequencies of f2 = 6 kHz and f1 = 5 kHz and in-the-ear stimulus levels of L2 = 55 dB SPL and L1 = 65 dB SPL, respectively. The mean and standard error (SE) of the mean STC of the DPOAE are shown in Fig. 1 for ears of newborns around the time of birth (N = 41), at 6-month of age (N = 18), and adults (N = 10). The mean STCs in the present study were based on all of the ear tests from Abdala and Keefe (2006) and Abdala et al. (2007), which were based on N = 20 ears of infants tested around the time of birth, N = 18 ears of 6-months and N = 10 of adult ears. The 18 ears tested at 6 months were all from participants in the group of 20 ears tested around the time of birth. The group of newborns tested around the time of birth also included an additional N = 21 ears tested using the same methods, which increased the total to N = 41 ears in this youngest age group. The inclusion of these additional ear tests improved the estimates of the mean and SE of the STC in the group of infants tested around the time of birth. The detailed methods used to measure these DPOAE STC data are described in these references. The suppressor SPL at each frequency was the level needed to decrement the DPOAE level by 6 dB. The tip-to-tail level difference of each STC was calculated as the difference in the suppressor SPL one octave below the f2 frequency (i.e., at ∼3 kHz) relative to the minimum SPL at the tip of the STC. Overall, the mean adult STC in Fig. 1 was broader with a tip-to-tail level of 15 dB as compared to the greater levels of 27 dB in term infants and 25 dB in 6-month-olds. The minimum tip SPLs ranged between 55 and 60 dB SPL across the age range, which were slightly greater than the L2 stimulus level of 55 dB SPL. The tip SPLs are indicated by the set of circle symbols on the figure for each age group. The suppressor SPL must be on the order of the stimulus SPL or greater to produce the criterion amount of suppression.
Figure 1.
(Color online) DPOAE tuning curve based on mean suppressor SPL for ears of adults, six-month-olds, and newborn infants for f2 frequency of 6 kHz. Each error bar represents ±1 SE. The mean ±1 SE of the tip-to-tail pressure level is specified in the legend for each age group. Circle symbols at f2 = 6 kHz represent L2 = 55 dB SPL. In all figures, the curves at each age are slightly displaced along the abscissa to reduce any overlap between the error bars and circle symbols for different age groups.
The suppressor levels at each frequency were transformed from SPL into absorbed power level, and a new STC based on absorbed power level was thus constructed. The sound power Wa absorbed by the ear from the probe stimulus is expressed in terms of the measurements at the microphone of the mean-squared sound pressure |P|2 and the acoustic conductance G by (Keefe et al., 1993)
| (1) |
Measurements of the acoustic pressure reflectance R were reported in each of these age groups by Keefe and Abdala (2007). Their data were acquired in ears of full-term infants at birth (N = 7), infants at age six months (N = 9), and adults (N = 10). The conductance was calculated in terms of pressure reflectance by G = (A∕ρc)Re{(1 − R)∕ (1 + R)}, in which ρ is the air density, c is the sound speed, A is the calibration-tube area, and Re{…} denotes the real part of the complex argument. The calibration-tube area of the system was A = 49.5 mm2 for measurements in adult ears and A = 17.8 mm2 for measurements in infant ears. The level difference in these areas (i.e., 10 log10A) was 4.4 dB. Each acoustical variable was a function of frequency, G at each frequency at which the reflectance was measured and |P|2 at each suppressor frequency used in the DPOAE measurements. The G data were linearly interpolated to calculate Wa at each suppressor frequency. Wa was converted to an absorbed sound power level La defined by La = 10 log10(Wa∕Wref). Based on the reference area, Aref = 49.5 mm2, of the calibration-tube area used in the adult measurements, the reference absorbed power Wref was defined by Wref = Aref|Pref |2∕(ρc). The reference root mean-squared pressure was Pref = 0.00002 Pa. This completed the transformation from SPL to La at each suppressor frequency. The transformation changed the shape of STC at each age because the frequency dependence of G in Eq. 1 was age-dependent.
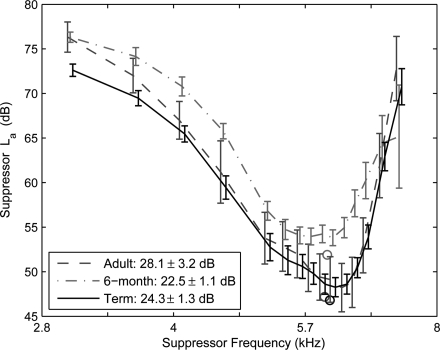
The present set of conductance data at the probe tip were similar to those previously reported in infants (Keefe et al., 1993) and adults (Keefe et al., 1993; Keefe and Schairer, 2011). The resulting mean power-based DPOAE STCs are shown in Fig. 2, which were obtained using Eq. 1 from the mean pressure-based DPOAE STCs in Fig. 1 and the measured mean conductance levels (LG = 10 log10G) at each age. Each SE in Fig. 2 was calculated using a propagation of error procedure, i.e., based on the square root of the sum of the squares of the SEs of the suppressor SPL and conductance level. The tip level of the 6-month-old STC was elevated 6 dB above the tip levels of the adult and term-infant STCs, which were similar to one another except at the lowest frequency (∼3 kHz). The power-based STCs were more similar in shape across age compared to the pressure-based STCs.
Figure 2.
(Color online) DPOAE tuning curve based on mean La for ears of adults, six-month-olds, and newborn infants. Each error bar represents ±1 SE of La. The mean ±1 SE of the tip-to-tail power level is specified in the legend for each age group. Circle symbols at f2 represent the absorbed power level of the stimulus based on L2 and the mean LG at f1 and f2.
The power-based tip-to-tail level difference of each STC was calculated as the difference in the suppressor La one octave below the f2 frequency (i.e., at 3 kHz) relative to the minimum La. The mean power-based tip-to-tail level difference was 28 dB for adults, 23 dB for 6-month-olds, and 24 dB for full-term infants; the corresponding SEs are shown in the legend of Fig. 2. A full statistical analysis was not performed because the group size of LG was as small as seven ears. Nevertheless, only the mean power-based tip-to-tail level differences in the adult and 6-month-old groups were separated by more than the sum of their SEs. It is predicted that the differences in Fig. 2 between adults and full-term infants and between full-term infants and 6-month-olds would not be significant if a larger number of ears were available for the statistical analysis. The exhibited trends showed no apparent differences between adult and term infants and between term infants and 6-month-olds. Comparing power-based and pressure-based tip-tail levels within age groups, the power-based measure was 9%–11% smaller for infants and 84% greater for adults than the pressure-based measure. Indeed, the visual shapes of the infant STCs are similar in the pressure-based and power-based representations. The main effect of constructing the STC using the absorbed power level of each suppressor instead of its SPL was a large increase in the adult tip-to-tail level difference. This was associated with a maximum in the conductance level of adults near 4.5 kHz (Keefe and Schairer, 2011), which is related to the ear-canal standing waves in adults. The corresponding conductance levels in infants above 1 kHz were relatively flat across frequency. This absence of standing waves near 4.5 kHz in the infant ear canal is mainly due to its shorter length (Keefe et al., 1993). These maturational differences in conductance level occur in tandem with the maturational differences approximately between 2.5 and 5 kHz in the forward ear-canal transfer function levels plotted in the top panel of each of the Figs. 5 and 7 of Keefe and Abdala (2007).
Thus, the immaturity in DPOAE STCs at f2 = 6 kHz was largely explained by the immaturities in the sound power absorbed from the forward-transmitted suppressors. These were controlled by specifying the suppressor sound level in the ear canal using absorbed power rather than pressure. The absorbed power level from the f2 stimulus is plotted in Fig. 2 using circle symbols for each age group (adult and term-infant levels near 47 dB and 6-month-old level near 52 dB). To control for any differences in LG at f1 and f2, the average conductance level across f1 and f2 was used in Eq. 1 with the stimulus SPL at f2 (55 dB SPL) to calculate what is termed the stimulus absorbed power level. In each age group, the tip of the power-based STC was slightly greater than the stimulus absorbed power level. This mirrored the finding in Fig. 1 for SPL, i.e., the power absorbed from the suppressor must be slightly greater than the stimulus power absorbed at the f2 place in order to produce a decrement of suppression of sufficient magnitude.
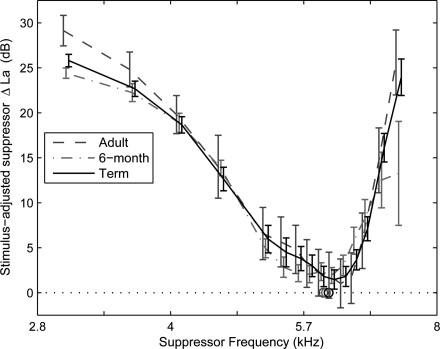
To better understand the remaining differences in tip levels across age in Fig. 2 for suppressor La, the STC for each age group was normalized by subtracting the stimulus absorbed power level from La to form a suppressor power level difference ΔLa. The adjusted power-based STCs are plotted in Fig. 3 using the mean ΔLa for each age group. The error bars are identical to those in Fig. 2. The corresponding stimulus absorbed power levels are represented by circle symbols in Fig. 3 at 0 dB and f2 = 6 kHz. The main finding was that the stimulus-adjusted power-based STCs were similar across the age at nearly all suppressor frequencies. The only exceptions were the slight increase in ΔLa at 3 kHz, which is the same factor that produced the greater tip-to-tail level difference in adults compared to infants, and the decreased ΔLa in 6-month-olds at the highest suppressor frequency (7.2 kHz), which also had extremely wide error bars. Particularly, the normalization of La by the stimulus absorbed power level matched the tip levels of the STCs in Fig. 3.
Figure 3.
(Color online) DPOAE tuning curve based on ΔLa, the difference in La and the absorbed power level of the stimulus based on L2 and the mean LG at f1 and f2, for ears of adults, six-month-olds, and newborn infants. Each error bar represents ±1 SE calculated the same as in Fig. 2. The tip-to-tail power levels are the same as in Fig. 2. Circle symbols at f2 = 6 kHz and 0 dB denote the normalization of each STC to the absorbed DPOAE stimulus power (compare to Fig. 1).
The representation of DPOAE stimuli and DPOAE suppressors in the ear canal using absorbed sound power produced a pattern of DPOAE suppression that was similar in full-term infants, 6-month-olds, and adults. This was in spite of the fact that the absorbed power levels of the stimuli eliciting the DPOAE differed across this age range for a test with fixed L1 and L2 (in decibels SPL). No model was used to construct the normalized power-based STC using ΔLa; only the absorbed sound power of the stimulus and the suppressors were used. It is unknown whether the residual age dependency in the STCs in Fig. 3 observed at 3 and 7.2 kHz was related to immaturities in forward and reverse peripheral transmission, cochlear immaturity, or experimental variability. To the extent that these residual age dependences are small, the results lend support to the theory that the cochlear mechanics underlying DPOAE suppression are substantially mature in full-term infants.
The age differences apparent in the DPOAE STCs in Fig. 1 were markedly reduced because of a change in the adult STC between the pressure and power representations. This change in adults was well described by an 84% increase in the tip-to-tail level difference in the power representation. These adult differences were accompanied by only small changes in the shapes of the infant STCs. A stimulus and suppressor specification based on absorbed sound power was successful at controlling ear-canal standing wave effects, which were large for adults and small for infants in the range of tip frequencies from 3 to 7 kHz. The finding that a specification using absorbed power was informative in the present study suggests its potential use in other types of experiments using DPOAEs, especially at higher frequencies where standing wave effects are present.
ACKNOWLEDGMENTS
This research was partially supported by National Institutes of Health Grants R01 DC004662 (DHK) and R01 DC003552 (CA).
References and links
- Abdala, C. (2001a). “Maturation of the human cochlear amplifier: Distortion product otoacoustic emission suppression tuning curves recorded at low and high primary tone levels,” J. Acoust. Soc. Am. 110, 1465–1476. 10.1121/1.1388018 [DOI] [PubMed] [Google Scholar]
- Abdala, C. (2001b). “DPOAE suppression tuning: Cochlear immaturity in premature neonates or auditory aging in normal-hearing adults,” J. Acoust. Soc. Am. 110, 3155–3162. 10.1121/1.1417523 [DOI] [PubMed] [Google Scholar]
- Abdala, C. (2005). “Effects of aspirin on distortion product otoacoustic emission suppression in human adults: A comparison with neonatal data,” J. Acoust. Soc. Am. 118, 1566–1575. 10.1121/1.1985043 [DOI] [PubMed] [Google Scholar]
- Abdala, C., and Keefe, D. H. (2006). “Effects of middle-ear immaturity on distortion product otoacoustic emission suppression tuning in infant ears,” J. Acoust. Soc. Am. 120, 3832–3842. 10.1121/1.2359237 [DOI] [PubMed] [Google Scholar]
- Abdala, C., Keefe, D. H., and Oba, S. I. (2007). “Distortion product otoacoustic emission suppression tuning and acoustic admittance in human infants: Birth through six months,” J. Acoust. Soc. Am. 121, 3617–3627. 10.1121/1.2734481 [DOI] [PMC free article] [PubMed] [Google Scholar]
- Keefe, D. H., and Abdala, C. (2007). “Theory of forward and reverse middle-ear transmission applied to otoacoustic emissions in infant and adult ears,” J. Acoust. Soc. Am. 121, 978–993. 10.1121/1.2427128 [DOI] [PMC free article] [PubMed] [Google Scholar]
- Keefe, D. H., Bulen, J. C., Arehart, K. H., and Burns, E. M. (1993). “Ear-canal impedance and reflection coefficient in human infants and adults,” J. Acoust. Soc. Am. 94, 2617–2638. 10.1121/1.407347 [DOI] [PubMed] [Google Scholar]
- Keefe, D. H., and Schairer, K. S. (2011). “Specification of absorbed sound power in the ear canal: Application to suppression of stimulus frequency otoacoustic emissions,” J. Acoust. Soc. Am. 129, 779–791. 10.1121/1.3531796 [DOI] [PMC free article] [PubMed] [Google Scholar]


