Abstract
Purpose: The authors examine the nonstationary noise behavior of a cone-beam CT system with FDK reconstruction.
Methods: To investigate the nonstationary noise behavior, an analytical expression for the NPS of local volumes and an entire volume was derived and quantitatively compared to the NPS estimated from experimental air and water images.
Results: The NPS of local volumes at different locations along the z-axis showed radial symmetry in the fx-fy plane and different missing cone regions in the fz direction depending on the tilt angle of rays through the local volumes. For local volumes away from the z-axis, the NPS of air and water images showed sharp transitions in the fx-fy and fy-fz planes and lack of radial symmetry in the fx-fy plane. These effects are mainly caused by varying magnification and different noise levels from view to view. In the NPS of the entire volume, the fx-fy plane showed radial symmetry because the nonstationary noise behaviors of local volumes were averaged out. The nonstationary sharp transitions were manifested as a high-frequency roll-off.
Conclusions: The results from noise power analysis for local volumes and an entire volume demonstrate the spatially varying noise behavior in the reconstructed cone-beam CT images.
Keywords: cone-beam CT, NPS, FDK, nonstationary noise
INTRODUCTION
In any medical imaging system, objective metrics of image noise are needed to assess the system performance. To describe the noise in reconstructed CT images, the image variance has been studied for parallel-beam,1, 2, 3, 4 fan-beam,5, 6, 7, 8, 9 and cone-beam CT systems.10, 11 While the image variance provides information on the noise magnitude, it cannot characterize the noise correlation introduced by the reconstruction algorithm and detector blurring and therefore the performance in object or feature detection tasks cannot be fully described by the variance alone.12 The most complete characterization of noise is to describe for each pixel, the variance and the covariance with all other pixels.13 This may be difficult to accomplish reliably in experiments. When the noise behavior is the same for pixels in a region, an average characterization provides a more stable noise description. The noise power spectrum (NPS) does this and provides information on the noise components for different spatial frequencies. It can be used to predict detection performance14, 15 and the system detective-quantum-efficiency.16, 17, 18, 19 In addition, the noise variance, the detectability (SNR), and the correlation in the noise can be determined from the NPS.20, 21 Some previous researches used a cascaded system analysis to derive the NPS and its dependence on the signal detection and processing chain for a single region at the center of the field of view.22, 23 In this paper, we instead focus on the spatially variant behavior starting with the noise in the measured projection data.
Much work has been done to study the propagation of noise in the raw data into the NPS of different CT systems. For parallel-beam CT, the NPS was analytically derived and shown to be dependent on the type of reconstruction filter.24 The NPS for a discrete reconstruction was also studied25, 26 and the effects of the discrete sampling within the projection, angular sampling, interpolation, and noise aliasing caused by pixel sampling were considered. Recently, an analytical formula of the NPS for direct fan-beam CT reconstruction was derived and its spatially varying noise behavior was investigated.27 Location dependent noise was investigated using 2D NPS and covariance matrix.28
In this paper, we examine the nonstationary noise behavior of cone-beam CT systems with FDK reconstruction.29 We first present an analytical derivation of the propagations of noise in the projections into the NPS and then investigate the nonstationary behavior using NPS of local volumes. We study the NPS of local volumes from reconstructed air and water images and examine the effects of spatially varying magnification, cosine weighting, backprojection weighting, noise statistics, and detector noise apodization. In addition, the NPS of the entire volume is estimated. In all cases, we quantitatively compare the experimentally estimated NPS to the analytical prediction.
METHOD
Analytical derivation of the 3D NPS
We assume that noise in the raw data contain only quantum noise that is additive20, 21 and follows a Poisson distribution30 and we allow for correlation due to cross-talk across detector cells. The detector signal is normalized by the incident intensity and the negative logarithm is taken to yield projection measurements. Extending the derivation in Ref. 27 to FDK reconstruction, the NPS of a cosine weighted projection is
| 1 |
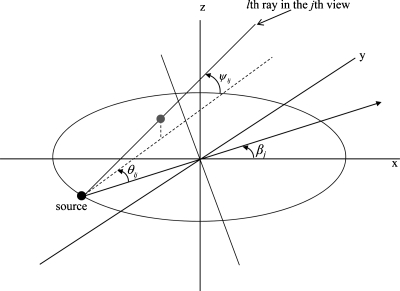
where kj is the number of detector cells contributing to the volume of interest in the jth view and each of these, indexed by the letter l; u and v are 2D spatial coordinates in the detector plane in the transverse and longitudinal direction, respectively; fu and fv are the corresponding spatial frequencies; wlj and Nlj are the cosine weighting factor and number of detected photons of the lth detector cell in the jth view; fuc and fvc are the Nyquist frequencies of the projection data; θlj and ψlj are the view dependent fan angle and tilt angle for the lth detector cell in the jth view (corresponding to the reconstruction point shown in Fig. 1); and D(fu,fv) is the frequency response of the detector noise apodization (due to cross-talk). Since projection measurements are unitless, the NPS of a single view has units of distance squared (i.e., cm2).22
Figure 1.
Three parameters characterizing the lth ray in the jth view. View angle βj with respect to the x-axis, view dependent fan angle θlj with respect to the central ray, and tilt angle ψlj with respect to the plane of the x-ray source.
In FDK reconstruction, the reconstruction filter (e.g., apodized ramp filter) is applied only in the transverse (fu) direction. Since filtering the projections multiplies the power spectrum by the squared magnitude of the filter’s frequency response,31 the NPS of a filtered projection (indicated by the subscript “ fp ”) in the jth view is
| (2) |
where |fu|H(fu,fv) is the apodized ramp filter used in the reconstruction. Note that Eqs. 1, 2 are valid for the local and global projection NPS (see the derivation in Ref. 27), where the set of detector cells “ l ” and the number of cells in that set “ kl ” need to be changed to reflect the volume being considered.
Since the noise in the FDK reconstruction is nonstationary across the image, we investigate the noise behavior by subdividing the reconstructed entire volume I into n small subvolumes
| (3) |
where each ic is a masked subvolume from I. We assume that the mask is small enough to ensure the noise within it is approximately stationary. At the same time, the subvolume has to be large enough to contain the vast majority of the correlation for pixels within the subvolume. For regions substantially larger than the central lobe of the reconstruction kernel, this condition will be obeyed except for the pixels near the edges of the region. This is discussed further below. Also, it should be noted that the frequency resolution of the NPS is inversely related to the width of the region used to compute it. We next derive the NPS for a small volume.
For a small volume ic, the cone-beam rays can be approximated as parallel rays and therefore the central-slice theorem holds locally.32 During the backprojection, each view contributes a 2D Fourier plane to the 3D NPS, but as was shown in Ref. 27 for fan-beam reconstruction, the bandwidth and amplitude of the 2D Fourier plane changes according to the view dependent magnification and backprojection weighting. Thus, the contribution onto the 2D Fourier plane from the jth view is
| (4) |
where aic,j and uic,j are the magnification factor and backprojection weighting for the small volume ic in the jth view. In addition, the 2D Fourier plane is rotated and tilted due to the view dependent fan angle and tilt angle.
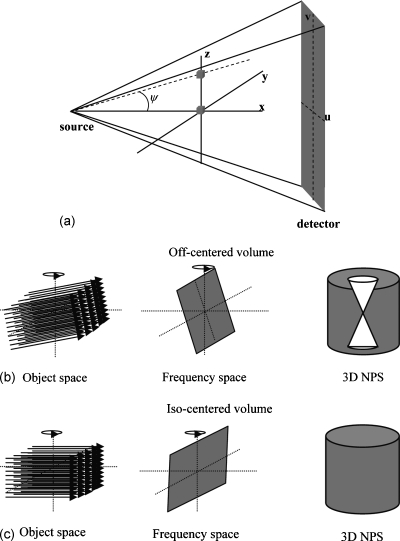
For example, if we consider the two small volumes along the z-axis in Fig. 2a, the contribution from all views is similar except for the effect of view dependent intensity variations and tilt angle. For the off-centered volume, a larger angle with respect to the x-y plane tilts the 2D Fourier plane which, when rotated for all views, produces a symmetric missing cone region in the 3D NPS [Fig. 2b]. For the isocentered volume, the 3D NPS does not have a missing cone region because of its very small tilt angle [Fig. 2c]. Note that the tilt angle is constant and fan angle is zero for small volumes along the z-axis.
Figure 2.
NPS of small volumes. (a) Two small volumes along the z-axis. The contribution of the 2D Fourier plane and the corresponding 3D NPS for (b) an off-centered volume (zero fan angle and constant tilt angle ψ over all views) and (c) an isocentered volume (zero fan angle and tilt angle over all views).
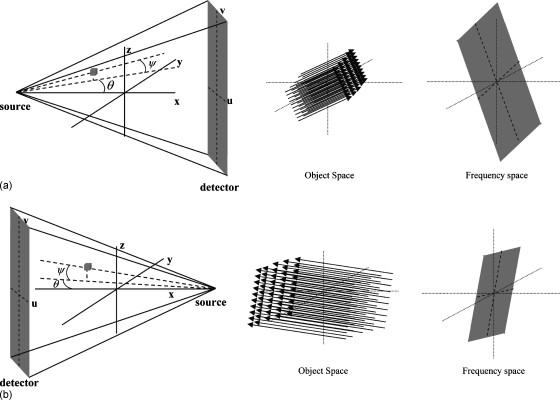
The 3D NPS of the small volume in Fig. 3, which is offset in all three directions, has a different behavior. When the source is located at the 0° view direction, shown in Fig. 3a, the 2D Fourier plane is stretched (that is, has a larger bandwidth) because of the higher magnification. The Fourier plane is also rotated by the view dependent fan angle and tilted by the larger tilt angle. However, when the source is located at 180°, shown in Fig. 3b, the 2D Fourier plane is squeezed (that is, has a smaller bandwidth) because of the lower magnification, is rotated by the view dependent fan angle, and is tilted by the smaller tilt angle. Considering all views, the 3D NPS has an asymmetric missing cone region. In addition, backprojection weighting and cosine weighting are different from view to view. Since the contribution of 2D Fourier planes onto the 3D NPS are additive over all views and the rotation in image space results in an equal rotation in Fourier space,33 3D NPS for a small volume ic can be expressed as
| (5) |
where R(h,ζ,κ) is a counterclockwise rotation operator acting on h by angle ζ about the fz axis and κ about the axis perpendicular to the source-isocenter direction; ψic,j and θic,j are the tilt angle and fan angle in the jth view; βj is the view angle shown in Fig. 1; and m is the number of views equally spaced over 2π. Note that aic,j, and uic,j are constant over all views for a small volume centered along the z-axis, but vary from view to view for off-centered small volumes. Since our reconstruction produced images of the linear attenuation coefficient, 3D NPS has units of distance (i.e., cm).22
Figure 3.
Description of the view dependent fan angle θ and tilt angle ψ and the corresponding 2D Fourier planes at (a) 0° and (b) 180° view direction for a small volume.
As described above, a cone-beam system has a different 3D NPS at different locations due to the nonstationary noise behavior and therefore the best way to characterize the image noise is to use 3D NPS of small volumes. However, one may wish to compute the 3D NPS of a large volume which characterizes the average noise behavior over the whole volume and previous investigators have done this.34 If we assume the cross-correlation between neighboring small volumes is negligible, the NPS of the reconstructed entire volume is the sum of the NPS over n small volumes
| (6) |
although one must be cognizant that due to nonstationarity, the resulting NPS may not be valid throughout the volume.
Of course, the pixels at the edge of a small region will have some correlation with pixels in neighboring regions, but for large enough regions, this correlation should be a small fraction of the net behavior. If that is not the case, then Eq. 6 would need to be modified to include the correlations among small subregions.
Experimental setup
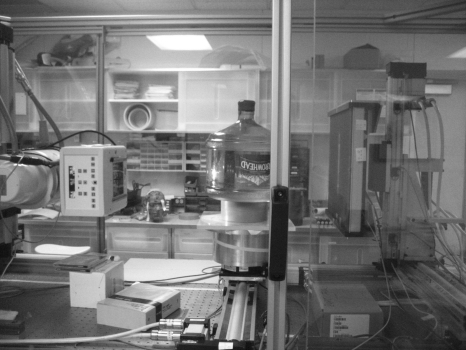
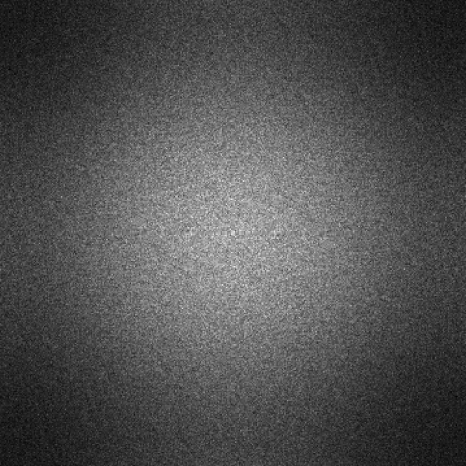
Experiments were performed on a tabletop CBCT system (shown in Fig. 4) consisting of a generator (Indico 100, CPI Communication & Medical Products Division, Georgetown, Ontario, Canada), an x-ray tube (G-1950SP Varian X-ray Products, Salt Lake City, UT) with a nominal 0.6 mm focal spot and 1.0 mm Al inherent filtration, a rotation stage, and a 400 mm×300 mm flat panel x-ray detector (PaxScan 4030CB, Varian Medical Systems, Palo Alto, CA) operated in a 2×2 pixel binning mode (388 μm×388 μm pixel size) with 1024×768 pixels per frame at 30 frames per second with dark field correction applied. Further 2×2 pixel binning was performed producing 512×384 pixels with 776 μm×776 μm pixel size. The detector center was offset by 10 cm in the z-direction to be similar to a system for cone-beam breast CT.34 To measure |D(fu,fv)|2 [see Eq. 1] for our detector, we measured the projection NPS of air (shown in Fig. 5). The measured projection NPS was fit to a two-dimensional Gaussian function G(fu,fv) (Ref. 35)
| (7) |
and a good fit was found with σ2=2.86(cm−2). This fit was used for comparison of the analytical prediction to the measured CT NPS [i.e., |D(fu,fv)|2=G(fu,fv)) in Eq. 1].
Figure 4.
The tabletop cone-beam CT system with a 260 mm diameter water phantom.
Figure 5.
Measured projection NPS of air.
Scan data of air and a 260 mm diameter water cylinder placed at the isocenter were reconstructed using a FDK algorithm and an unweighted ramp filter. To avoid unwanted additional apodization and noise aliasing, the projections were filtered using 10-fold Fourier interpolation (i.e., zero padding in frequency space followed by an inverse Fourier transform)23, 36 and then voxel-driven backprojection with linear interpolation was performed using a small voxel size (0.26 mm in all directions). The parameters for imaging and reconstruction are summarized in Table 1.
Table 1.
Parameters for the experiment.
| X-ray source | 120 kVp, 12 mA |
| Pulse width | 15 ms |
| Total mA s | 72 |
| Source to detector distance | 1000 mm |
| Source to isocenter distance | 670 mm |
| Detector size | 400 mm×300 mm (512×384 pixels) |
| Magnification | 1.5 |
| Tilt angle | −3° to 14° |
| Number of views | 400 evenly spaced over 360° |
| Reconstructed voxel size | 0.26 mm in all directions |
| Reconstructed volume size | 26.6 cm×26.6 cm×13 cm centered at (0, 0, 6.7 cm) (1024×1024×512 voxels) |
NPS estimation
Experimental 3D NPS were estimated from the Fourier transform (squared) of noise-only 3D images37
| (8) |
where Lx, Ly, and Lz are the number of elements in three dimensions and bx, by, and bz are the corresponding voxel size in each direction. i(x,y,z) is a noise-only image acquired by subtracting the image data from two identical scans, thereby containing only stochastic noise and dividing the result by . The symbol ⟨ ⟩ indicates the ensemble average of 32 independent realizations (i.e., 64 images divided into 32 pairs).
The 3D NPS at three local volumes centered at (−11 cm, 0, 0), (0, 0, 0), and (0, 0, 13 cm), respectively, were estimated. Each local volume was composed of 128×128×128 elements corresponding to a cube of ∼3.3 cm per side. To estimate the 3D NPS for an entire volume while avoiding memory limitations, the 1024×1024×512 matrix was separated into 32 nonoverlapped 2563 subvolumes and then the NPS of the nonoverlapped subvolumes were averaged. This was done for both the air scan and water phantom data.
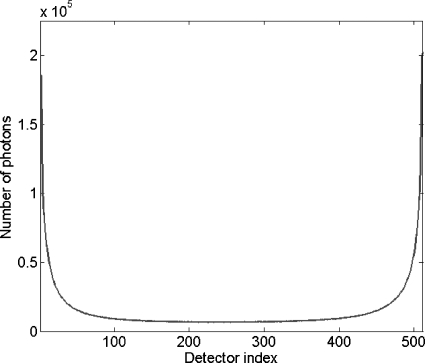
Analytical 3D NPS for the three local volumes and the entire volume were calculated using Eqs. 5, 6. To compare the analytical NPS to the estimated NPS quantitatively, we first found a conversion factor (4.375) between detector counts and number of detected photons by comparing the measured projection NPS of air at zero frequency to the analytical projection NPS. Since the detector counts in the air scan were ∼46 000, the analytical 3D NPS for the air scan was calculated using uniform noise statistics of 201 250 photons per detector cell over all views. For the analytical calculation of 3D NPS for the water phantom, the counts across one row of the detector in a scan of the water phantom were scaled to produce the nonuniform noise statistics across detector channels shown in Fig. 6 and this was used for each detector row and view. To calculate the analytical 3D NPS for the local and entire volume, 3D NPS at 125 (i.e., 5×5×5) and 32 000 (i.e., 40×40×20) locations equally spaced in the x-, y-, and z-directions were calculated and then averaged.
Figure 6.
Nonuniform noise statistics across detector cells.
RESULTS
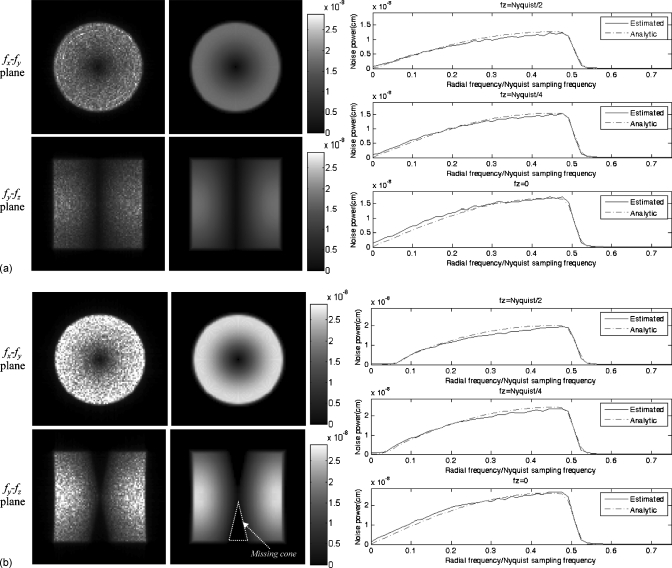
Figure 7 shows the experimentally estimated and analytical 3D NPS of the water phantom for two local volumes centered at (0, 0, 0) and (0, 0, 13 cm), respectively, displayed up to 3∕4 Nyquist sampling frequency at isocenter, and plots of the radial NPS at fz=0, 1∕4, and 1∕2 Nyquist sampling frequency. The fx-fy planes of 3D NPS show the radial symmetry because the number of photons through each volume is the same over all views. Compared to the 3D NPS of the isocentered volume, the 3D NPS of the volume at (0, 0, 13 cm) shows the missing cone region near the fz axis because of its tilt angle(∼11°), a corollary of the insufficient coverage of Fourier space in cone-beam CT, and higher amplitude because of its longer path length (or equivalently lower number of detected photons). We also estimated the 3D NPS of air scans for the same volume locations and verified the same symmetry and missing cone. The effect of the detector noise apodization is most easily appreciated as a decreasing spectral power in the fz direction. The experimental 3D NPS and the analytical 3D NPS both show this effect, which was included in the analytical model as the Gaussian fit described above. In all cases, the estimated NPS shows excellent agreement with the analytical NPS.
Figure 7.
fx-fy plane and fy-fz plane of the 3D NPS and radial NPS from water phantom. Estimated NPS (first column), analytical NPS (second column), and radial NPS (third column) for (a) an isocentered volume and (b) a volume at (0, 0, 13 cm). The display range in both cases is [0 to 3×10⁻⁸].
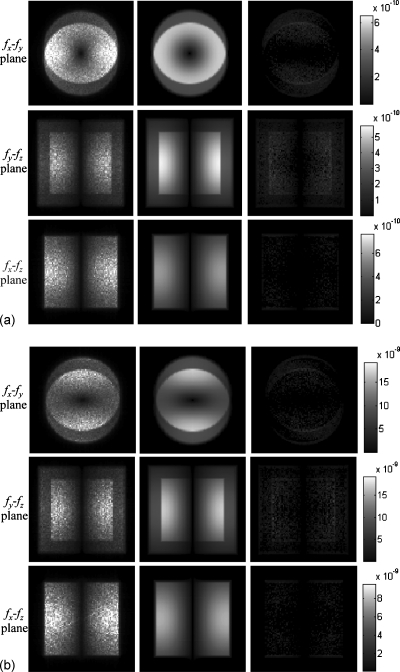
Figure 8 shows the estimated and analytical 3D NPS of the water phantom and air for the local volume centered at (−11 cm, 0, 0). In contrast with the two volumes along the z-axis, the 3D NPS at this location shows a different shape and amplitude distribution. The sharp transitions in the fx-fy and fy-fz planes of the 3D NPS demonstrate the effect of the varying bandwidth of the sampled 2D Fourier plane during the backprojection in opposed directions (described in Fig. 3). The different angular dependent amplitude distributions shown in the fx-fy planes of the water phantom 3D NPS [Fig. 8b] are caused by the different noise levels in views in different directions. In contrast with the air scan, the number of photons through the local volume in the water phantom is smaller in the 0° view direction [horizontal in Fig. 3a] than at 90° view direction and therefore the fx-fy plane shows higher amplitude in the fy direction. The 3D NPS of a local volume centered at (0, 11 cm, 0) has this pattern rotated by 90°. From Figs. 78, it can be observed that the noise behavior varies significantly for different locations.
Figure 8.
fx-fy plane, fy-fz plane, and fx-fz plane of the 3D NPS for the local volume centered at (−11 cm, 0, 0). Estimated NPS (first column), analytical NPS (second column), and difference NPS image (third column) for (a) air and (b) water phantom.
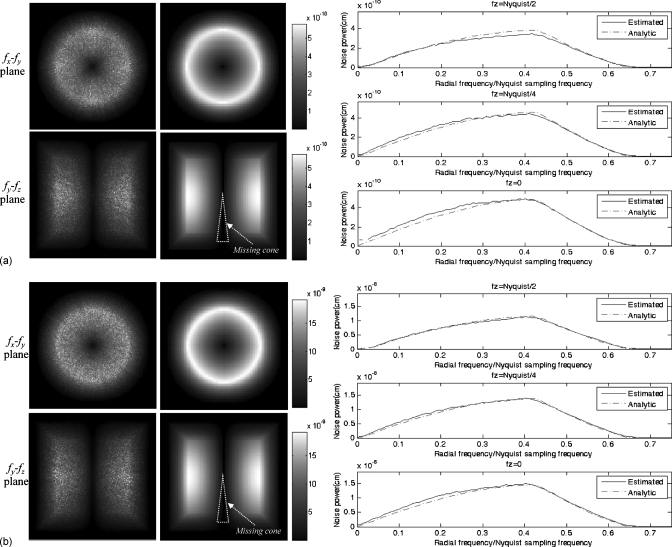
Figure 9 shows the estimated and analytical 3D NPS and radial NPS of the water phantom and air for the entire volume. The fx-fy plane of the 3D NPS does not show the angular dependent amplitude variation since the angular dependence of local volumes in Fig. 8 has been averaged out. Instead, the different noise behaviors of local volumes are reflected as a roll-off in the spectrum at high frequencies (shown in the radial NPS). The missing cone region is again seen in the fy-fz plane of the 3D NPS. However, the size of the missing cone is relatively smaller and less distinct than in the local volume at (0, 0, 13 cm) due to the averaging across the entire volume. This effect is clearly seen in the radial NPS, where the low frequency of the radial NPS is lower than that of the local NPS in Fig. 7b, especially at high fz. Since the number of detected photons through the water phantom is lower than that through air, the amplitude of the noise power is much higher in the NPS of the water phantom. The radial NPS shows excellent agreement between the analytical and experimental 3D NPS, demonstrating that the cross-correlation between neighboring small volumes is small compared to the noise power within each small volume.
Figure 9.
fx-fy plane and fy-fz plane of the 3D NPS and radial NPS for an entire volume. Estimated NPS (first column), analytical NPS (second column), and radial NPS (third column) for (a) air and (b) water phantom. The display window level of NPS images of air and water are [0 to 5.8×10⁻¹⁰] and [0 to 1.9×10⁻⁸].
DISCUSSION AND CONCLUSIONS
Cone-beam CT systems with FDK reconstruction have nonstationary noise across the FOV. While the NPS of a large volume provides information about the average noise behavior, the NPS of local volumes show significant differences in the noise behavior in different locations. In this work, we estimated the 3D NPS of local volumes and an entire volume from reconstructed water and air images and compared them to the analytical 3D NPS quantitatively.
The NPS of different local volumes showed symmetric and asymmetric shapes and different angular dependent amplitude variations. For the local volumes along the z-axis, the fx-fy plane of the 3D NPS showed a radial symmetry because of the circular symmetry of our test object, but the fy-fz plane did not. The 3D NPS of local volumes at larger tilt angles showed the missing cone region caused by the insufficient sampling in Fourier space of the cone-beam CT system. The 3D NPS of a local volume centered at (−11 cm, 0, 0) showed sharp transitions in the fx-fy and fy-fz planes and different amplitude distributions for the water and air images. These location dependent noise behaviors were mainly caused by the effects of varying magnification, backprojection weighting, cosine weighting, and noise level from view to view. In the 3D NPS of an entire volume, the nonstationary noise behaviors of local volumes were averaged out, producing high-frequency roll-off. Radial symmetry was observed in circular symmetric test objects and a missing cone region was observed in the fy-fz plane of the 3D NPS. It is important keep in mind that while the NPS of the entire volume may characterize the average behavior, it may not reflect the noise properties in specific regions.
In the estimated 3D NPS, the effect of the detector noise apodization was most easily observed as a decreasing spectral density in the fz direction although some effect is also present at high fx and fy frequencies. The detector noise apodization was modeled using a 2D Gaussian and incorporated into the analytical NPS. The use of linear or nearest neighbor interpolation can also introduce decreasing spectral density at high frequencies. However, as described in Refs. 23, 38, Fourier interpolation can prevent this effect.
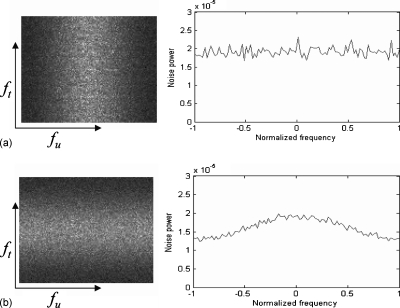
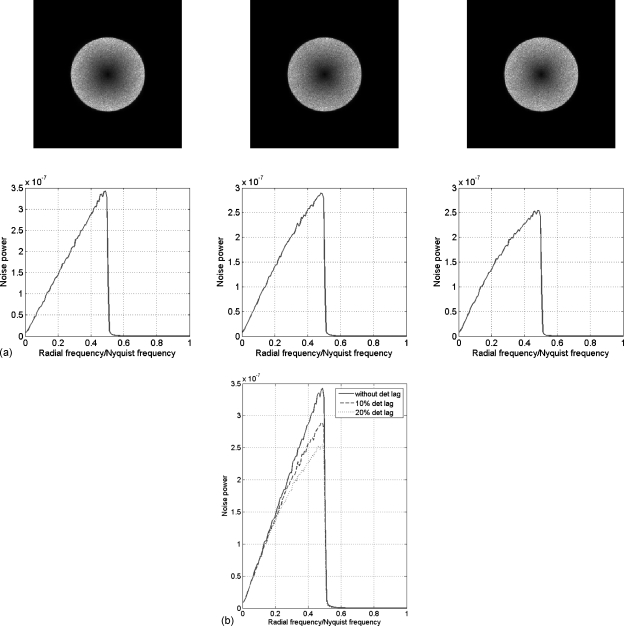
In this work, the effect of detector lag was assumed to be small since the estimated 3D NPS of raw data through air in the [fu,fv,ft] domain showed “white” noise in the ft direction. For example, Fig. 10a shows the fu-ft plane of the measured raw data NPS of the projections and the vertical profile at fu=0. For comparison, 10% detector lag was simulated and demonstrates decreasing spectral density in the ft direction [Fig. 10b]. With this level of detector lag, our initial CT simulations with parallel-beam geometry showed noise correlation in the azimuthal direction and decreasing high-frequency noise with increasing detector lag (Fig. 11). The spatially varying effect of detector lag on the NPS is under investigation.
Figure 10.
fu-ft plane of the 3D NPS and a vertical profile at fu=0 from (a) measured air scan data and (b) simulated air scan data with 10% detector lag. The display window is [10−5 to 2.5×10⁻⁵]
Figure 11.
NPS at the isocenter for different detector lag. (a) 2D NPS (up) and radial NPS (down). (b) The comparison of radial NPS.
In our experiment, the water phantom data contained scattered x-ray photons, which can degrade image quality. Initial studies with computer simulations showed that if uncorrected, scattered photons in the raw data decrease the amplitude of the NPS, but an ideal correction for x-ray scatter increases the amplitude of the NPS by the scatter-to-primary ratio. The impact of nonstationary noise due to x-ray scatter on detectability is a subject of future research.
ACKNOWLEDGMENTS
This work is supported by GE Healthcare, NIH Grant No. EB006837, and the Lucas Foundation.
References
- Barrett H. H., Gordon S. K., and Hershel R. S., “Statistical limitations in transaxial tomography,” Comput. Biol. Med. 6(4), 307–323 (1976). 10.1016/0010-4825(76)90068-8 [DOI] [PubMed] [Google Scholar]
- Alpert N. M., Chesler D. A., Correia J. A., Ackerman R. H., Chang J. Y., Finklestein S., Davis S. M., Brownell G. L., and Taveras J. M., “Estimation of the local statistical noise in emission computed tomography,” IEEE Trans. Med. Imaging 1(2), 142–146 (1982). 10.1109/TMI.1982.4307561 [DOI] [PubMed] [Google Scholar]
- Chesler D. A., Riederer S. J., and Pelc N. J., “Noise due to photon counting statistics in computed x-ray tomography,” J. Comput. Assist. Tomogr. 1(1), 64–74 (1977). 10.1097/00004728-197701000-00009 [DOI] [PubMed] [Google Scholar]
- Gore J. C. and Tofts P. S., “Statistical limitations in computed tomography,” Phys. Med. Biol. 23(6), 1176–1182 (1978). 10.1088/0031-9155/23/6/014 [DOI] [PubMed] [Google Scholar]
- Bennett K. E. and Byer R. L., “Fan-beam-tomography noise theory,” J. Opt. Soc. Am. A 3(5), 624–633 (1986). 10.1364/JOSAA.3.000624 [DOI] [Google Scholar]
- Bennett K. E. and Byer R. L., “Optical tomography: Experimental verification of noise theory,” Opt. Lett. 9(7), 270–272 (1984). 10.1364/OL.9.000270 [DOI] [PubMed] [Google Scholar]
- Bennett K. E., Faris G. W., and Byer R. L., “Experimental optical fan beam tomography,” Appl. Opt. 23(16), 2678–2685 (1984). 10.1364/AO.23.002678 [DOI] [PubMed] [Google Scholar]
- Zeng G. L., “Nonuniform noise propagation by using the ramp filter in fan-beam computed tomography,” IEEE Trans. Med. Imaging 23(6), 690–695 (2004). 10.1109/TMI.2004.826943 [DOI] [PubMed] [Google Scholar]
- Zhu L. and Starlack J., “A practical reconstruction algorithm for CT noise variance maps using FBP reconstruction,” Proc. SPIE 6510, 651023 (2007). 10.1117/12.713692 [DOI] [Google Scholar]
- Zhang Y. and Ning R., “Investigation of image noise in cone-beam CT imaging due to photon counting statistics with the Feldkamp algorithm by computer simulations,” J. X-Ray Sci. Technol. 16(2), 143–158 (2008). [Google Scholar]
- Xia D., Sidky E. Y., Yu L., and Pan X., “Noise properties in helical cone-beam CT Images,” in IEEE Nuclear Science Symposium Conference Record, Vol. 6, pp. 3428–3430, 2006.
- Boedeker K. L. and McNitt-Gray M. F., “Application of the noise power spectrum in modern diagnostic MDCT: Part II. Noise power spectra and signal to noise,” Phys. Med. Biol. 52, 4047–4061 (2007). 10.1088/0031-9155/52/14/003 [DOI] [PubMed] [Google Scholar]
- Wunderlich A. and Noo F., “Image covariance and lesion detectability in direct fan-beam x-ray computed tomography,” Phys. Med. Biol. 53, 2471–2493 (2008). 10.1088/0031-9155/53/10/002 [DOI] [PMC free article] [PubMed] [Google Scholar]
- Samei E. and Flynn M. J., “An experimental comparison of detector performance for computed radiography systems,” Med. Phys. 29(4), 447–459 (2002). 10.1118/1.1449873 [DOI] [PubMed] [Google Scholar]
- Samei E. and Flynn M. J., “An experimental comparison of detector performance for direct and indirect digital radiography systems,” Med. Phys. 30(4), 608–622 (2003). 10.1118/1.1561285 [DOI] [PubMed] [Google Scholar]
- Tapiovaara M. J. and Wagner R. F., “SNR and DQE analysis of broad spectrum x-ray imaging,” Phys. Med. Biol. 30(6), 519–529 (1985). 10.1088/0031-9155/30/6/002 [DOI] [Google Scholar]
- Bushberg J. T., Seibert J. A., E. M.Leidholdt, Jr., and Boone J. M., The Essential Physics of Medical Imaging, 2nd ed. (Lippincott, New York, Williams and Wilkins, Baltimore, 2001), p. 238. [Google Scholar]
- Siewerdsen J. H., Antonuk L. E., El-Mohri Y., Yorkston J., Huang W., and Cunningham I. A., “Signal, noise power spectrum, and detective quantum efficiency of indirect-detection flat-panel imagers for diagnostic radiology,” Med. Phys. 25(5), 614–628 (1998). 10.1118/1.598243 [DOI] [PubMed] [Google Scholar]
- Siewerdsen J. H., Antonuk L. E., El-Mohri Y., Yorkston J., Huang W., Boudry J. M., and Cunningham I. A., “Empirical and theoretical investigation of the noise performance of indirect detection, active matrix flat-panel imagers (AMFPIs) for diagnostic radiology,” Med. Phys. 24(1), 71–89 (1997). 10.1118/1.597919 [DOI] [PubMed] [Google Scholar]
- Hanson K. M., “Detectability in computed tomographic images,” Med. Phys. 6(5), 441–451 (1979). 10.1118/1.594534 [DOI] [PubMed] [Google Scholar]
- Wagner R. F., Brown D. G., and Pastel M. S., “Application of information theory to the assessment of computed tomography,” Med. Phys. 6(2), 83–94 (1979). 10.1118/1.594559 [DOI] [PubMed] [Google Scholar]
- Tward D. J. and Siewerdsen J. H., “Cascaded systems analysis of the 3D noise transfer characteristics of flat-panel cone-beam CT,” Med. Phys. 35(12), 5510–5529 (2008). 10.1118/1.3002414 [DOI] [PMC free article] [PubMed] [Google Scholar]
- Tward D. J. and Siewerdsen J. H., “Noise aliasing and the 3D NEQ of flat-panel cone-beam CT: Effect of 2D/3D apertures and sampling,” Med. Phys. 36(8), 3830–3843 (2009). 10.1118/1.3166933 [DOI] [PMC free article] [PubMed] [Google Scholar]
- Riederer S. J., Pelc N. J., and Chesler D. A., “The noise power spectrum in computed x-ray tomography,” Phys. Med. Biol. 23(3), 446–454 (1978). 10.1088/0031-9155/23/3/008 [DOI] [PubMed] [Google Scholar]
- Faulkner K. and Moores B. M., “Analysis of x-ray computed tomography images using the noise power spectrum and autocorrelation function,” Phys. Med. Biol. 29(11), 1343–1352 (1984). 10.1088/0031-9155/29/11/003 [DOI] [PubMed] [Google Scholar]
- Kijewski M. F. and Judy P. F., “The noise power spectrum of CT images,” Phys. Med. Biol. 32(5), 565–575 (1987). 10.1088/0031-9155/32/5/003 [DOI] [PubMed] [Google Scholar]
- Baek J. and Pelc N. J., “The noise power spectrum in CT with direct fan beam reconstruction,” Med. Phys. 37(5), 2074–2081 (2010). 10.1118/1.3378673 [DOI] [PMC free article] [PubMed] [Google Scholar]
- Brunner C. C., Hurowitz S. A., Abboud S. F., Hoeschen C., and Kyprianou I. S., “Noise characterization of computed tomography using the covariance matrix,” Proc. SPIE 7622, 76224Z (2010). 10.1117/12.845494 [DOI] [Google Scholar]
- Feldkamp L. A., Davis L. C., and Kress J. W., “Practical cone-beam algorithm,” J. Opt. Soc. Am. A 1(6), 612–619 (1984). 10.1364/JOSAA.1.000612 [DOI] [Google Scholar]
- Loudon R., The Quantum Theory of Light, 3rd ed. (Oxford University Press, New York, 2000), p. 117. [Google Scholar]
- Papoulis A., Signal Analysis (McGraw-Hill, New York, 1977). [Google Scholar]
- Bracewell R. N., “Strip integration in radio astronomy,” Aust. J. Phys. 9, 198–217 (1956). [Google Scholar]
- Bracewell R. N., Two-Dimensional Imaging (Prentice Hall, Englewood Cliffs, 1995), p. 157. [Google Scholar]
- Yang K., Kwan A. L., Huang S. Y., Packard N. J., and Boone J. M., “Noise power properties of a cone-beam CT system for breast cancer detection,” Med. Phys. 35(12), 5317–5327 (2008). 10.1118/1.3002411 [DOI] [PMC free article] [PubMed] [Google Scholar]
- Tu S. J., Shaw C. C., and Chen L., “Noise simulation in cone beam CT imaging with parallel computing,” Phys. Med. Biol. 51(5), 1283–1297 (2006). 10.1088/0031-9155/51/5/017 [DOI] [PMC free article] [PubMed] [Google Scholar]
- Kak A. C. and Slaney M., Principles of Computerized Tomographic Imaging (IEEE, New York, 1988), p. 75. [Google Scholar]
- Siewerdsen J. H., Cunningham I. A., and Jaffray D. A., “A framework for noise-power spectrum analysis of multidimensional images,” Med. Phys. 29(11), 2655–2671 (2002). 10.1118/1.1513158 [DOI] [PubMed] [Google Scholar]
- Baek J. and Pelc N. J., “Analytical construction of 3D NPS for a cone beam CT system,” Proc. SPIE 7258, 725805 (2009). 10.1117/12.813832 [DOI] [Google Scholar]


