Abstract
The interactions of proteins with solid surfaces occur in a variety of situations. Motivated by the many nanoengineering applications of protein-carbon nanotube hybrids, we investigate the conformational transitions of hen egg white lysozyme adsorbed on a carbon nanotube. Using a Cα structure-based model and replica exchange molecular dynamics, we show how the folding∕unfolding equilibrium of the adsorbed protein varies with the strength of its coupling to the surface. The stability of the native state depends on the balance between the favorable entropy and unfavorable enthalpy change on adsorption. In the case of a weakly attractive surface when the former dominates, the protein is stabilized. In this regime, the protein can fold and unfold while maintaining the same binding fraction. With increasing surface attraction, the unfavorable enthalpic effect dominates, the native state is destabilized, and the protein has to extensively unbind before changing states from unfolded to folded. At the highest surface coupling, the entropic penalty of folding vanishes, and a folding intermediate is strongly stabilized. In this intermediate state, the α-domain of lysozyme is disrupted, while the β-sheet remains fully structured. We rationalize the relative stability of the two domains on the basis of the residue contact order.
INTRODUCTION
Proteins interact with surfaces in many situations occurring in nature,1 and also in many practical applications in food science,2 and biotechnology and nanomaterials engineering.3, 4 Hybrid structures of proteins and inorganic materials such as silica, graphite, and carbon nanotubes are used in the construction of biosensors and diagnostics, for the intra-cellular delivery of functional proteins, etc. Proteins are also interfaced with surfaces in the preparation of antimicrobial coatings and in medical implants. Understanding the factors that affect the stability and activity of proteins on surfaces is thus a matter of great interest in basic and applied science. Experiments with a variety of materials including silica, carbon nanotubes, fullerenes, etc., show that adsorbed proteins are strongly influenced by properties of the surface including chemistry, topology, and curvature,3, 4 and references therein]. For instance, adsorption on silica nanoparticles reduces the activity of hen egg white lysozyme5 and human carbonic anhydrase I,6 with both proteins showing a greater loss of activity on larger particles. Vertegel et al.5 explained their results on the basis of the larger electrostatic potential on large diameter particles. In contrast, adsorption of soybean peroxidase to flat substrates such as graphite flakes, and single walled carbon nanotubes (SWNTs)7 and C60 fullerenes8 stabilizes the protein under denaturing conditions. The SWNT and fullerene substrates were found to stabilize the protein more than the flat supports; this effect was attributed to the reduction of lateral protein–protein interactions on a curved surface.7 Other enzymes are also known to be stabilized by SWNTs under conditions of thermal and chemical denaturation.9 The reasoning of Asuri et al.7 suggests that increased surface curvature correlates with stability of adsorbed proteins, but surface curvature effects appear to be protein specific; Roach et al.10 report that bovine serum albumin was found to be more nativelike on smaller particles (higher surface curvature), while bovine fibrinogen was more denatured on smaller particles.
Noncovalent binding of proteins, peptides, and other biopolymers are known to solubilize carbon nanotubes.11, 12 For instance, noncovalent binding of commercially available proteins allows solubilization of nanotubes with diameters from 1 to 15 nm.11, 13 Typically, only small nanotubes (≲ 2 nm) are single-walled, while larger nanotubes assemble as multiwalled carbon nanotubes (MWNTs) which posses several concentric layers spaced ∼0.34 nm apart.12
Theoretical studies to date have mostly treated the adsorbed protein as a rigid body,14, 15 or in atomistic detail,16, 17, 18, 19, 20, 21, 22 focusing on questions of protein orientation at the surface and small structural changes on adsorption. Studies of protein stability and folding at surfaces have been largely limited to coarse grained models of proteins covalently tethered to surfaces.23, 24, 25, 26, 27, 28 As far as we can tell, investigations of the coupled folding and surface adsorption of a protein have been limited to the lattice model of Sharma et al.29 Here, we investigate the folding∕unfolding behavior of hen egg white lysozyme while adsorbed to the surface of a carbon nanotube 3.5 nm in diameter. This 129 residue protein has been experimentally investigated in solution,30 and also when attached to the surface of single walled carbon nanotubes.9 We use a well characterized structure-based model31 that allows us to thoroughly sample the folded and unfolded states of the protein. The 3.5 nm nanotube models a functionalized carbon nanotube, not an unfunctionalized SWNT which will typically have a smaller (≲ 2 nm) diameter. This nanotube could also serve as a model of SWNT bundles and MWNTs in which interior layers are modeled as modified interactions between the protein and the nanotube surface.
METHODS
Model
The protein is modeled using the Cα structure-based (Gō-like) potential of Clementi et al.31 In this coarse grained representation, each residue is represented by a single bead at the position of the Cα atom. The model is nearly unfrustrated, and the only attractive interactions are between residues that are in contact in the native state. Thus, the system energy is at its minimum in the native state. The Hamiltonian for the model is given by
| (1) |
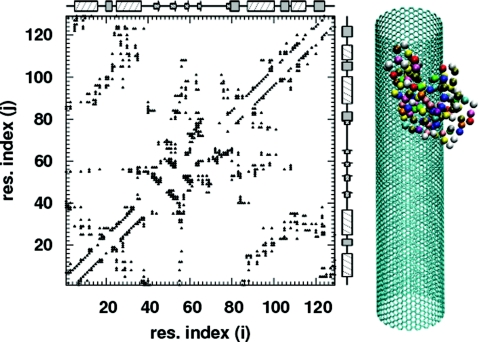
where Kr = 100, Kθ = 20, , , ε = 1, and σnc = 0.4 nm. r is the distance between two adjacent residues, θ is the angle formed by three consecutive residues, and ϕ is the dihedral angle for four consecutive residues in the chain, while r0, θ0, and ϕ0 are their corresponding values in the native state. rij is the distance between two residues i and j that are at least four bonds apart, and σij is the corresponding value in the native state. The parameter ε sets the energy scale for all calculations. The first three terms in Eq. 1 are the bond, angle, and dihedral potentials, respectively. The fourth term is the attractive interaction between residue pairs that are in contact in the native state, and the last term is a short ranged, purely repulsive interaction between all other residue pairs (non-native pairs). To construct the coarse grained Cα model for lysozyme, we start with the all-atom Protein Data Bank structure 1IEE.pdb. A native contact is defined as any pair of residues in this structure that satisfies the shadow map criterion of Noel et al.32 The 400 native contacts that are identified with this procedure are shown in the native state contact map in Fig. 1.
Figure 1.
The native state contact map. Also shown are α-helices as hatched rectangles, 3–10 helices as gray-filled rectangles, β-sheets as arrows, and turns∕coils as straight lines. The Cα model for lysozyme and the carbon nanotube are drawn to scale on the right.
The carbon nanotube has a chirality of (26, 26),33 with diameter D = 3.53 nm, length L = 15.19 nm, and 6448 identical atoms. A nanotube carbon atom interacts with each protein residue via a modification of the potential for native contacts in the protein,
| (2) |
where ε = 1 and σ = 0.6 nm. λ is a coupling parameter that modulates the strength of the nanotube-protein attraction. It is easily verified that Eq. 2 can be rewritten as
| (3) |
where εT = λ6ε and σT = λ−0.5σ. In this work we investigate nanotubes with λ = 0.5, 0.6, and 0.7, which are referred to as the weak, intermediate, and strong coupling cases, respectively.34
Simulation details
Constant temperature molecular dynamics simulations were conducted using GROMACS.35 Reduced dimensionless units were used, with a time step of 0.0005 units and all masses identically equal to 1. A stochastic thermostat with a coupling constant τT = 1.0 was employed. Periodic boundary conditions were used, with a cubic box 17 nm on each side in the case of the isolated protein. For the systems with the nanotube, the z-dimension of the simulation cell was chosen to be the length of the nanotube, such that the protein only interacts with the exterior surface of the nanotube. The isolated protein, without a nanotube, was simulated at a range of temperatures above and below the folding temperature. To improve sampling in the presence of the nanotube, replica exchange molecular dynamics simulations36 were conducted over a temperature range straddling the folding temperature. Each replica was equilibrated for 5.105 steps before collecting data. In the production phase, replicas were monitored to ensure multiple reversible folding∕unfolding transitions.34 Correct sampling from Boltzmann weighted distributions was verified by using Bennett’s histogram overlap method with energy histograms at adjacent temperatures.38, 39, 40
Protein folding was monitored using the fraction of native contacts Q, while binding to the nanotube was quantified using the fraction of residues bound B. A pair of residues i, j were considered to form a contact if (a) they are a native contact pair, and (b) if the distance between them rij ⩽ 1.2σij.31 A residue was considered bound to the nanotube if it was within a distance 1.2σT of the nanotube surface. The fraction of residues that are bound B, is thus a quantitative measure of the extent to which the protein is surface-adsorbed. For the isolated protein, potentials of mean force (PMFs) W(Q) = −kBTlog P(Q), were calculated from the multiple temperature data using the weighted histogram analysis method (WHAM) algorithm.42 Here, kB is Boltzmann’s constant, T is the temperature, and P(Q) is the probability distribution for the order parameter Q. In the presence of the nanotube, we also calculated 2D PMFs W(Q, B) = −kBTlog P(Q, B), where P(Q, B) is the 2D distribution for the coupled binding and folding.
RESULTS AND DISCUSSION
Isolated protein (no nanotube)
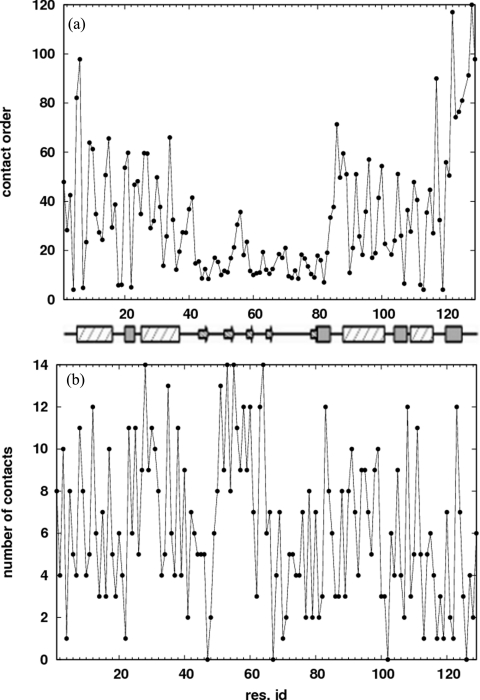
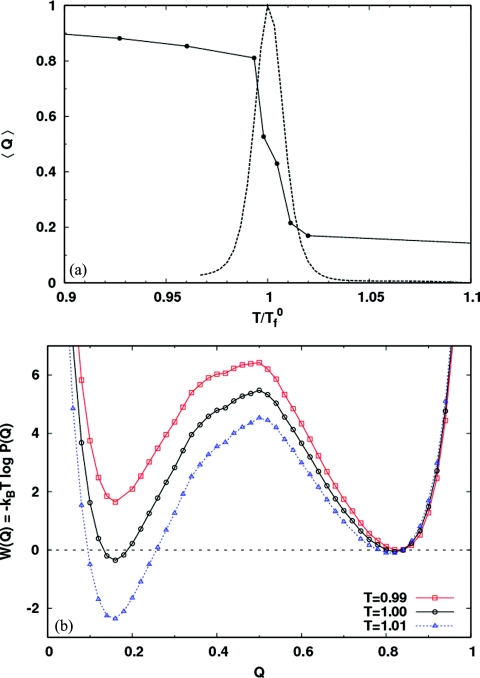
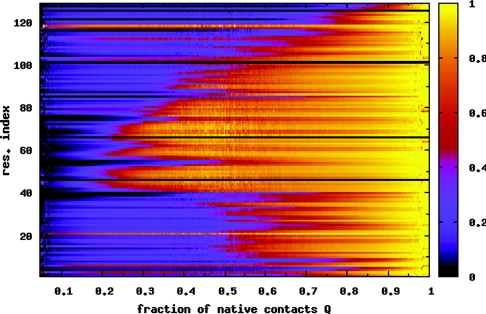
Hen egg white lysozyme is composed of an α-domain (residues 1–35 and 85–129), and a β-domain (residues 36–84). See Fig. 1 for the native state contact map and secondary structure. Figure 2a shows that the contact order for each residue, defined as the average separation along the sequence between the residue and its contacts,43 is significantly lower in the β-domain compared to the rest of the protein. We note that Plaxco et al.43 define a relative contact order averaged over all the contacts in the protein—a property of the whole protein. Here, we define it for each residue. To characterize the folding and unfolding of the protein, we use the fraction of native contacts Q. The solid line in Fig. 3a shows the melting curve (〈Q〉 versus T) for the isolated protein. Below the folding temperature , 〈Q〉 is high (⩾0.8), and drops to a low value (⩽0.2) above as the protein unfolds. can be precisely located by the maximum in the specific heat versus temperature curve [dashed line in Fig. 3a]. All temperatures are reported in units of . The potential of mean force [Fig. 3b] shows that the protein folds and unfolds in a two state manner, with the unfolded state becoming more stable with increasing temperature. For a residue level look at the folding process, we plot the average nativeness of each residue 〈qi〉 as a function of Q in Fig. 4. Here, qi = 1 implies that residue i retains all its native contacts. As the protein starts folding from Q ≈ 0, residues 42–54 and 59–83 in the β-sheet region gain most of their contacts early in the folding process (Q ≈ 0.25). These are also the residues with low contact order [Fig. 2a]. The protein folding process is accompanied by a favorable enthalpy change due to the formation of contacts, and an unfavorable change in backbone entropy. This entropy loss increases with the contact order of the residues being structured. The protein backbone entropy therefore favors the structuring of the low contact order residues over those with higher contact order. When the β-domain is formed, it also stabilizes the α-helix comprising residues 88–100 with which it makes numerous contacts. Following this, the rest of the protein acquires its native structure.
Figure 2.
(a) Contact order for each residue, defined as the average distance along the sequence between the residue and its native contacts. Residues 42–54 and 59–83 have low contact order compared to the rest of the chain. The protein secondary structure is represented by hatched rectangles for α-helices, gray-filled rectangles for 3–10 helices, arrows for β-sheets, and straight lines for turns∕coils. (b) Number of native contacts for each residue.
Figure 3.
(a) Mean fraction of native contacts Q, vs temperature (solid line) for the isolated protein. The plot shows the transition from the folded state (high Q) to the unfolded state (low Q) with increasing temperature. The dashed line shows the specific heat Cv, as a function of temperature on an arbitrary vertical scale. For this system, the maximum of Cv identifies the folding temperature . (b) The potential of mean force along the order parameter Q for the isolated protein (in units of ε), showing two state behavior. Below the folding temperature (squares), the folded state is thermodynamically more stable. Above the folding temperature (triangles), the opposite is true.
Figure 4.
Mean nativeness (fraction of native contacts) qi of each residue i, as a function of the global order parameter Q. Data are averaged over temperatures T = 0.96–1.01. Residues 42–54 and 59–83 in the β-sheet region, which have low contact order [Fig. 2a], retain most of their native contacts even when the rest of the protein is unfolded. This stable core of the protein also contributes to the stability of the α-helix of residues 88–100, due to the large number of contacts between these two domains. Black lines correspond to residues with no native contacts.
Experiments reveal that lysozyme folds via a kinetic partitioning mechanism.30 A majority (∼70%) of the unfolded population follows a slow path to the native state, in which the α-domain acquires structure before the β-domain. The other 30% folds on much shorter time scales (∼10 ms), with both domains becoming structured more or less simultaneously. Presumably, experimental limitations preclude further resolution of the folding mechanism at such short time scales. The folding mechanism of our minimally frustrated model resembles the latter fast folding pathway. However, our model may not have the required level of detail to describe the first, dominant folding pathway. Interestingly, an experimental study of lysozyme adsorption to nanoporous membranes44 showed that the protein undergoes an α-helix to β-sheet transition. Shortly after adsorption, the α-domain unfolds while the β-domain remains essentially intact. A theoretical study of lysozyme unfolding45 also concluded that the α-domain loses structure first, before the β-sheet. Thus, our conclusions on the relative stabilities of the two domains are consistent with both of these earlier studies.
Weakly coupled nanotube (λ = 0.5)
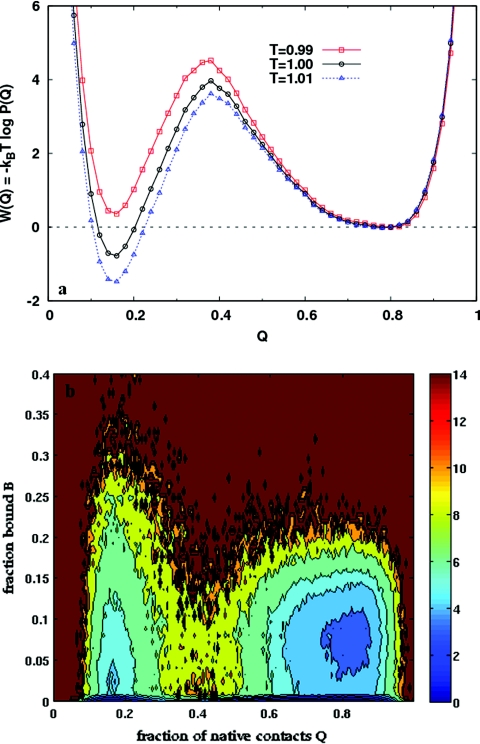
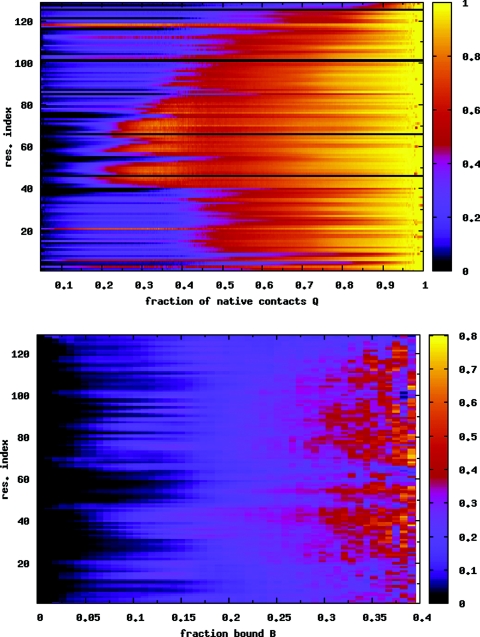
When a protein is adsorbed onto the surface of a carbon nanotube, the processes of protein folding and surface binding are in competition. In the presence of the weakly coupled nanotube (λ = 0.5, see Sec. 2), the PMF as a function of Q in Fig. 5a shows that the protein still folds in a two state manner. However, the folded state minimum at high Q is wider, and the free energy barrier between the folded and unfolded states is lower, relative to the isolated protein [Fig. 3b]. Thus, it appears that the folded state is stabilized, and the folding and unfolding rates are enhanced in the presence of the nanotube. Figure 5b shows a coupled view of the folding and binding processes in the form of a 2D PMF at T = 0.99, the transition temperature for this system. The free energy contours show that the protein is predominantly completely unbound (B = 0), whether folded or unfolded. For low values of B (≲ 0.1), the protein can fold and unfold while maintaining the same binding fraction. For perspective, we note that when B = 0.1, approximately 13 of the 129 residues are within a distance 1.2σT of the nanotube surface. The states with the highest binding fractions (B ≳ 0.2) are all unfolded. With increasing temperature, the equilibrium shifts to the unfolded state at all binding fractions.34 Figure 6a shows that the folding mechanism is very similar to that of the isolated protein (Fig. 4). The β-domain folds first, followed by the rest of the protein. Just as Fig. 6a gives a detailed look at the folding process, Fig. 6b gives a residue level look at the binding process. The density graded scale shows the binding probability of each residue P(bi), as a function of B. Consistent with the fact that the β-domain has a higher propensity to fold, it has a low probability of binding when B ≲ 0.15. For higher values of B when the protein is unfolded, all residues have more or less equal probabilities of being bound.
Figure 5.
(a) The PMF along Q in the case of weak coupling to the nanotube (λ = 0.5). Compared to the isolated protein at the same temperature [Fig. 3b], the free energy barrier is lowered and shifted to lower values of Q. Consequently, the folded basin becomes wider. (b) Free energy contours as a function of Q and B, the fraction of residues bound to the nanotube surface, for the λ = 0.5 case, at T = 0.99. This is the transition temperature for this system, corresponding to the peak of the specific heat vs temperature curve. The free energy is a minimum when the protein is completely unbound (B = 0), either folded (Q ∼ 0.8) or unfolded (Q ∼ 0.2). At low binding fractions (B ≲ 0.1), the protein can interconvert between the folded and unfolded states in a two state manner. At higher values of B the protein is unfolded.
Figure 6.
(a) Average nativeness qi of each residue i as a function of Q, for the λ = 0.5 case. The folding behavior is very similar to the case of the isolated protein (Fig. 4). (b) Probability of binding for each residue P(bi), as a function of the global order parameter B. Data are averaged over temperatures T = 0.97–1.07 in both (a) and (b).
Moderately attractive nanotube (λ = 0.6)
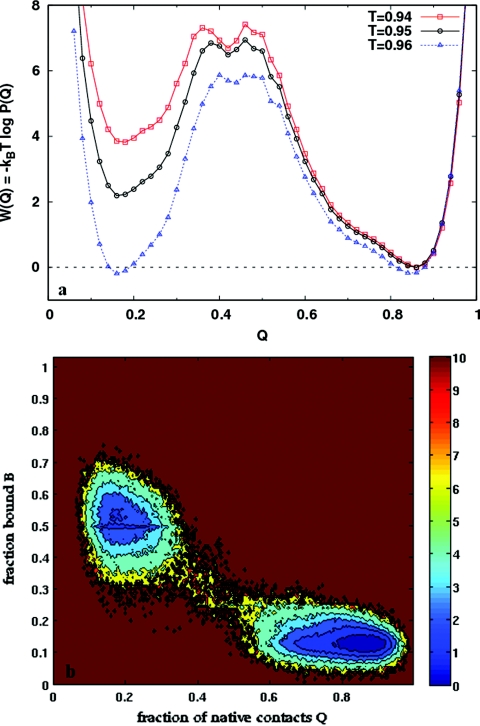
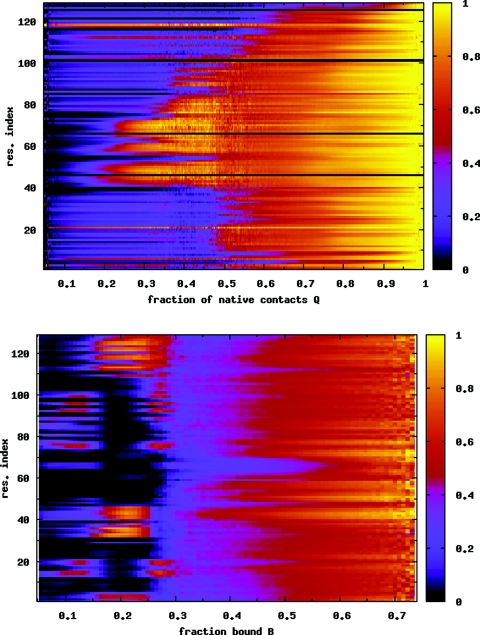
When the nanotube coupling constant λ increases to 0.6, the PMF in Fig. 7a is significantly affected. The folded basin narrows over the λ = 0.5 case, and a third minimum emerges at the top of the free energy barrier. The 2D PMF (at T = 0.96) in Fig. 7b shows that at this intermediate coupling strength, the protein does not change between folded and unfolded conformations at a fixed value of B. For the protein to fold, the binding fraction must decrease. Conversely, when the protein unfolds, the number of bound residues increases. For this coupling and the given system size, there are no completely unbound states (B = 0). For B ≲ 0.25, the protein is folded, while it is unfolded for B ≳ 0.35. Figure 8a shows that the folding mechanism is largely unchanged by the increased surface attraction. With increasing temperature, as the protein unfolds, the high B state is more favored.34 Figure 8b, for P(bi) as a function of B, shows that in the folded state when B ≲ 0.25, the β-domain and the adjacent α-helix (residues 88–100) are largely unbound. For higher binding fractions, when the protein is unfolded, all residues have virtually identical probabilities of binding to the surface.
Figure 7.
(a) PMF along Q for the λ = 0.6 system. At the transition temperature for this system (T = 0.96), the free energy barrier is higher and wider than the λ = 0.5 case. A shallow minimum is seen at the top of the barrier, but the protein is still folds in a two state manner. (b) Free energy contours as a function of Q and B for λ = 0.6, at T = 0.96. The protein is either unfolded and bound (low Q, high B), or folded and unbound (high Q, low B).
Figure 8.
(a) Average nativeness qi of each residue i as a function of Q, for the λ = 0.6 case. The folding behavior is very similar to the case of the isolated protein (Fig. 4) and the λ = 0.5 case (Fig. 6). (b) Probability of binding for each residue P(bi) as a function of B. Residues 62–70 in the β-sheet region have a low probability of binding. These residues also retain a large fraction of their native contacts [see (a)]. Data are averaged over temperatures T = 0.90–1.00 in both figures.
Strongly attractive nanotube (λ = 0.7)
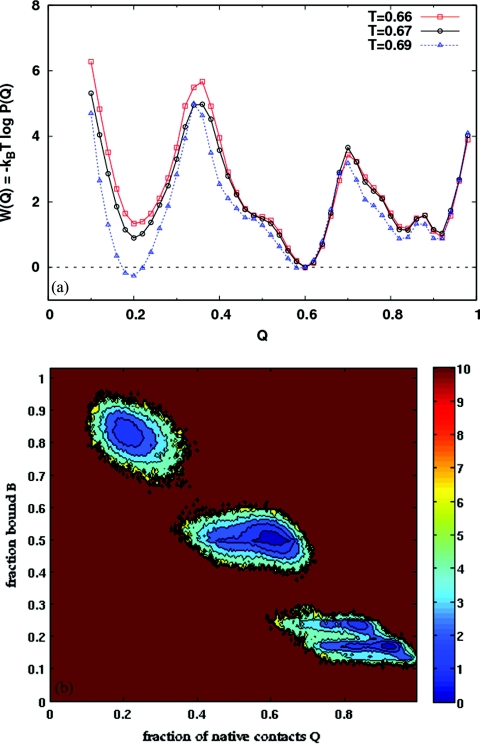
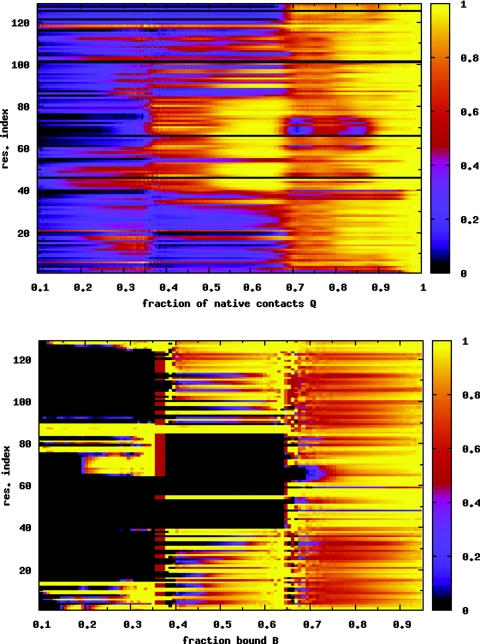
At the highest surface-protein coupling studied (λ = 0.7), the 1D PMF [Fig. 9a] shows that a folding intermediate is strongly stabilized. The 2D PMF, shown at the transition temperature of T = 0.68 in Fig. 9b, clearly distinguishes three states with the folding and binding being anticorrelated. The stability of the folded state is largely insensitive to temperature changes.34 The average residue nativeness in Fig. 10a shows that the β-domain is in its native state in the folding intermediate. Residues 42–54 in this region retain most of their structure even in the unfolded state (Q < 0.35). As the binding fraction decreases and the protein transitions from the intermediate to the folded state, the β-domain melts and the protein sequence gains contacts uniformly along its length. A striking observation is that residues 67–74 are substantially less structured in the native state than in the intermediate. Figure 10b shows that in the folding intermediate, the β-domain which is fully formed, does not bind to the nanotube.
Figure 9.
(a) PMF along Q for the λ = 0.7 system. A folding intermediate is strongly stabilized for this strong coupling case and the protein is no longer a two state folder. (b) Free energy contours as a function of Q and B for λ = 0.7, at T = 0.68. Folding and binding are anticorrelated.
Figure 10.
(a) Average nativeness qi of each residue i as a function of Q, for the strong coupling case (λ = 0.7). The folding intermediate (0.4 ⩽ Q ⩽ 0.7) is mostly structured in the β-sheet region, while the rest of the protein is unfolded. (b) The β-sheet is also completely unbound in the intermediate. Data are averaged over temperatures T = 0.65 − 0.74.
Surface effects on protein stability
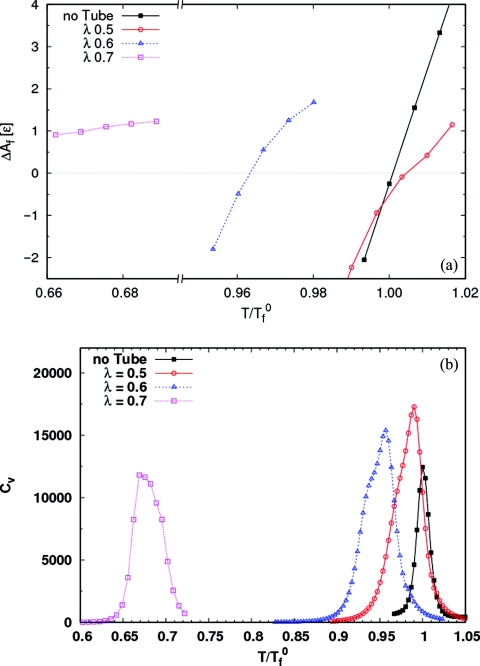
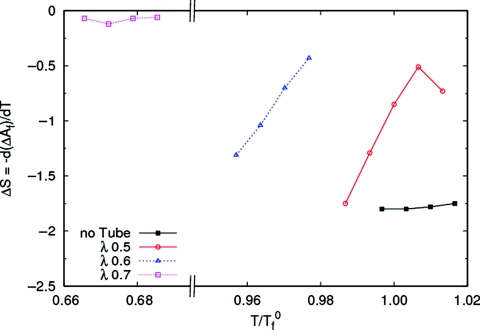
Figure 11a shows the free energy of the folded state relative to the unfolded state ΔAf = −kBTlog (Pf∕(1 − Pf)), where Pf is the probability of being in the folded basin, for the protein in the four different environments. The folding temperature of the protein in each case is defined as the temperature at which ΔAf = 0. For the isolated protein, this definition of the folding temperature is equivalent to the one used earlier, as the temperature at which the specific heat is a maximum. However, in the presence of the nanotube the calculated specific heat [Fig. 11b] refers to the coupled binding and folding process, and the maximum does not coincide with the temperature at which the folded and unfolded states are equally probable. For the case of weak nanotube-protein interaction (λ = 0.5), the folding temperature is greater than for the isolated protein, implying that the protein stability is enhanced. As λ increases, the protein is destabilized and the folding temperature decreases. In Fig. 12 we plot the entropy change on folding, ΔSf = −d(ΔAf)∕dT. ΔSf < 0 in all cases, implying that the protein loses entropy on folding. However, the magnitude of the difference decreases with increasing λ. Thus, the entropic penalty for folding decreases with increasing surface coupling, and vanishes in the case of the strongly interacting nanotube.
Figure 11.
(a) Free energy of folding ΔAf as a function of temperature for all four systems. The folding temperature in each case is the temperature at which ΔAf = 0. For the weakly coupled nanotube (λ = 0.5), the folding temperature increases over the isolated protein, i.e., the folded state is stabilized. For larger values of the coupling parameter, the folding temperature decreases. (b) Specific heat as a function of temperature for the isolated protein and the three systems with carbon nanotubes. The maximum of the specific heat for each system identifies the transition temperature for the coupled folding and binding of the protein. For the isolated protein, this is a second, equivalent definition of the folding temperature.
Figure 12.
The entropic penalty of folding ΔSf, is reduced in the presence of the nanotubes.
Adsorption to the carbon nanotube surface lowers the entropy of the unfolded state, thereby stabilizing the native state of the protein. In this sense, surface adsorption affects a protein in the same manner as confinement. The surface also has a destabilizing enthalpic effect when it binds to the protein and competes with the folding process. This destabilization increases with increasing nanotube-protein attraction. The corresponding effect is ignored in considerations of inert confinement. Thus, the stability of an adsorbed protein depends on the balance between favorable entropy changes and unfavorable changes in enthalpy.
CONCLUSIONS
Our results show that a weakly attractive surface can stabilize an adsorbed protein. Free energy barriers to folding∕unfolding can be lowered, enhancing the kinetics of transition. Adsorption to a surface reduces the entropy of the unfolded protein, thereby enhancing the stability of the folded state relative to the unfolded state. This favorable entropic effect is balanced by an unfavorable enthalpic effect which increases with increasing surface-protein attraction. In the regime where the entropic stabilization dominates, the protein can fold and unfold at a fixed binding fraction. When the unfavorable enthalpic effect dominates, the protein does not change between folded and unfolded conformations at a given binding fraction. As the surface becomes more attractive, protein stability becomes increasingly insensitive to temperature changes. At the highest surface-protein coupling studied, a folding intermediate is strongly stabilized by partial adsorption to the nanotube surface. In this intermediate state the stable core of the protein, the β-domain, is fully structured. The relative stabilities of the two domains of lysozyme can be rationalized on the basis of the contact order of each residue, which is a measure of how local its native contacts are. When a low contact order residue gains its native contacts, the entropy loss is less than when a high contact order residue becomes structured. The β-sheet has more local contacts than the α-domain, and is therefore more stable. This argument applies not only to lysozyme but to proteins in general. We therefore expect antiparallel β-sheets, which have low contact order, to be more stable than α-helices, at least in minimally frustrated models such as the present one.
The minimalist model used here undoubtedly has its limitations. The structure-based potential describing the protein assumes a near-perfect folding funnel, and does not account for favorable non-native interactions and the resulting ruggedness in the energy landscape.49, 50 Furthermore, all amino acid residues have the same interaction with the nanotube—there is no distinction between electrostatic or hydrophobic origins for the surface attraction. We also note that the effects of surface chemistry and curvature dependence have not been addressed here. In spite of these obvious limitations, the present study offers useful insights into the coupled binding and folding behavior of an adsorbed protein, and opens up avenues for further investigations. Hydrophilic or nonpolar surfaces can be modeled by restricting the surface attraction to either charged or hydrophobic residues, respectively. A further refinement can be made by calibrating the potential on the basis of the residue identity, for instance, using the hydropathy scale for amino acids51 in the case of a hydrophobic surface. With these improvements, the activity of the adsorbed enzyme can be investigated along with its structure.
ACKNOWLEDGMENTS
S.V. thanks Paul Whitford for help with implementing the structure-based model and the WHAM calculations, and Jeff Noel for insightful comments on an earlier version of this paper. We greatly appreciate discussions with R.S. Kane and J.S. Dordick. This work has been supported by the National Science Foundation (Grant Nos. MCB-053769, MCB-1050966 and DMR-0117792).
References
- Gray J. J., Curr. Opin. Struct. Biol. 14, 110 (2004). 10.1016/j.sbi.2003.12.001 [DOI] [PubMed] [Google Scholar]
- Euston S. R., Curr. Opin. Colloid Interface Sci. 9, 321 (2004). 10.1016/j.cocis.2004.09.005 [DOI] [Google Scholar]
- Asuri P., Bale S. S., Karajanagi S. S., and Kane R. S., Curr. Opin. Biotechnol. 17, 562 (2006). 10.1016/j.copbio.2006.09.002 [DOI] [PubMed] [Google Scholar]
- Kane R. S. and Stroock A. D., Biotechnol. Prog. 23, 316 (2007). 10.1021/bp060388n [DOI] [PubMed] [Google Scholar]
- Vertegel A. A., Siegel R. W., and Dordick J. S., Langmuir 20, 6800 (2004). 10.1021/la0497200 [DOI] [PubMed] [Google Scholar]
- Lundqvist M., Sethson I., and Jonsson B.-H., Langmuir 20, 10639 (2004). 10.1021/la0484725 [DOI] [PubMed] [Google Scholar]
- Asuri P., Karajanagi S. S., Yang H., Yim T.-J., Kane R. S., and Dordick J. S., Langmuir 22, 5833 (2006). 10.1021/la0528450 [DOI] [PubMed] [Google Scholar]
- Asuri P., Karajanagi S. S., Vertegel A. A., Dordick J. S., and Kane R. S., J. Nanosci. Nanotechnol. 7, 1675 (2007). 10.1166/jnn.2007.453 [DOI] [PubMed] [Google Scholar]
- Asuri P., Bale S. S., Pangule R. C., Shah D. A., Kane R. S., and Dordick J. S., Langmuir 23, 12318 (2007). 10.1021/la702091c [DOI] [PubMed] [Google Scholar]
- Roach P., Farrar D., and Perry C. C., J. Am. Chem. Soc. 128, 3939 (2006). 10.1021/ja056278e [DOI] [PubMed] [Google Scholar]
- Karajanagi S. S., Yang H., Asuri P., Sellitto E., Dordick J. S., and Kane R. S., Langmuir 22, 1392 (2006). 10.1021/la0528201 [DOI] [PubMed] [Google Scholar]
- Klumpp C., Kostarelos K., Prato M., and Bianco A., Biochim. Biophys. Acta 1758, 404 (2006). 10.1016/j.bbamem.2005.10.008 [DOI] [PubMed] [Google Scholar]
- Pangule R. C., Brooks S. J., Dinu C. Z., Bale S. S., Salmon S. L., Zhu G., Metzger D. W., Kane R. S., and Dordick J. S., ACS Nano 7, 3993 (2010). 10.1021/nn100932t [DOI] [PMC free article] [PubMed] [Google Scholar]
- Ravichandran S., Madura J. D., and Talbot J., J. Phys. Chem. B 105, 3610 (2001). 10.1021/jp010223r [DOI] [Google Scholar]
- Xie Y., Zhou J., and Jiang S., J. Chem. Phys. 132, 065101 (2010). 10.1063/1.3305244 [DOI] [PubMed] [Google Scholar]
- Ganazzoli F. and Raffaini G., Phys. Chem. Chem. Phys. 7, 3651 (2005). 10.1039/b506813d [DOI] [PubMed] [Google Scholar]
- Latour R. A., BioInterphases 3, FC2 (2008). 10.1116/1.2965132 [DOI] [PMC free article] [PubMed] [Google Scholar]
- Skepö M., J. Chem. Phys. 129, 185101 (2008). 10.1063/1.3002317 [DOI] [PubMed] [Google Scholar]
- Shen J.-W., Wu T., Wang Q., and Kang Y., Biomaterials 29, 3847 (2008). 10.1016/j.biomaterials.2008.06.013 [DOI] [PubMed] [Google Scholar]
- Johnson R. R., Rego B. J., Johnson A. T. C., and Klein M. L., J. Phys. Chem. B 113, 11589 (2009). 10.1021/jp901999a [DOI] [PubMed] [Google Scholar]
- Kubiak K. and Mulheran P. A., J. Phys. Chem. B 113, 12189 (2009). 10.1021/jp901521x [DOI] [PubMed] [Google Scholar]
- Raffaini G. and Ganazzoli F., Langmuir 26, 5679 (2010). 10.1021/la903769c [DOI] [PubMed] [Google Scholar]
- T. A.KnottsIV, Rathore N., and de Pablo J. J., Proteins 61, 385 (2005). 10.1002/prot.20581 [DOI] [PubMed] [Google Scholar]
- Friedel M., Baumketner A., and Shea J.-E., J. Chem. Phys. 126, 095101 (2007). 10.1063/1.2464114 [DOI] [PubMed] [Google Scholar]
- T. A.KnottsIV, Rathore N., and de Pablo J. J., Biophys. J. 94, 4473 (2008). 10.1529/biophysj.107.123158 [DOI] [PMC free article] [PubMed] [Google Scholar]
- Wei S. and T. A.KnottsIV, J. Chem. Phys. 133, 115102 (2010). 10.1063/1.3479039 [DOI] [PubMed] [Google Scholar]
- Friedel M., Baumketner A., and Shea J.-E., Proc. Natl. Acad. Sci. U.S.A. 103, 8396 (2006). 10.1073/pnas.0601210103 [DOI] [PMC free article] [PubMed] [Google Scholar]
- Zhuang Z., Jewett A. I., Soto P., and Shea J.-E., Phys. Biol. 6, 015004 (2009). 10.1088/1478-3975/6/1/015004 [DOI] [PubMed] [Google Scholar]
- Sharma S., Berne B. J., and Kumar S. K., Biophys. J. 99, 1157 (2010). 10.1016/j.bpj.2010.05.030 [DOI] [PMC free article] [PubMed] [Google Scholar]
- Matagne A. and Dobson C. M., Cell. Mol. Life Sci. 54, 363 (1998). 10.1007/s000180050165 [DOI] [PMC free article] [PubMed] [Google Scholar]
- Clementi C., Nymeyer H., and Onuchic J. N., J. Mol. Biol. 298, 937 (2000). 10.1006/jmbi.2000.3693 [DOI] [PubMed] [Google Scholar]
- Noel J. K., Whitford P. C., Sanbonmatsu K. Y., and Onuchic J. N., Nucleic. Acids Res. 38, W657 (2010). 10.1093/nar/gkq498 [DOI] [PMC free article] [PubMed] [Google Scholar]
- Wildöer J. W.G., Venema L. C., Rinzler A. G., Smalley R. E., and Dekker C., Nature (London) 391, 59 (1998). 10.1038/34139 [DOI] [Google Scholar]
- See supplementary material at http://dx.doi.org/10.1063/1.3558776 for a plot of the potentials in Fig. S1; Fig. S2 showing multiple folding/unfolding transitions in the λ = 0.7 case; Fig. S3 verifying convergence in the λ = 0.7 case; for Fig. S4; for Fig. S5; and for Fig. S6.
- van der Spoel D., Lindahl E., Hess B., Groenhof G., Mark A. E., and Berendsen H. J. C., J. Comput. Chem. 26, 1701 (2005). 10.1002/jcc.20291 [DOI] [PubMed] [Google Scholar]
- Sugita Y. and Okamoto Y., Chem. Phys. Lett. 314, 141 (1999). 10.1016/S0009-2614(99)01123-9 [DOI] [Google Scholar]
- Bennett C. H., J. Comput. Phys. 22, 245 (1976). 10.1016/0021-9991(76)90078-4 [DOI] [Google Scholar]
- Sanbonmatsu K. Y. and Garcia A. E., Proteins 46, 225 (2002). 10.1002/prot.1167 [DOI] [PubMed] [Google Scholar]
- Garcia A. E., Herce H. D., and Paschek D., Annu. Rep. Comp. Chem. 2, 83 (2006). 10.1016/S1574-1400(06)02005-6 [DOI] [Google Scholar]
- Kumar S., Bouzida D., Swendsen R., Kollman P., and Rosenberg J., J. Comput. Chem. 13, 1011 (1992). 10.1002/jcc.540130812 [DOI] [Google Scholar]
- Plaxco K. W., Simons K. T., and Baker D., J. Mol. Biol. 277, 985 (1998). 10.1006/jmbi.1998.1645 [DOI] [PubMed] [Google Scholar]
- Sethuraman A., Vedantham G., Imoto T., Przybycien T., and Belfort G., Proteins 56, 669 (2004). 10.1002/prot.20183 [DOI] [PubMed] [Google Scholar]
- Williams M. A., Thornton J. M., and Goodfellow J. M., Protein Eng. 10, 895 (1997). 10.1093/protein/10.8.895 [DOI] [PubMed] [Google Scholar]
- Plotkin S. S., Proteins 45, 337 (2001). 10.1002/prot.1154 [DOI] [PubMed] [Google Scholar]
- Clementi C. and Plotkin S. S., Protein Sci. 13, 1750 (2004). 10.1110/ps.03580104 [DOI] [PMC free article] [PubMed] [Google Scholar]
- Kyte J. and Doolittle R. F., J. Mol. Biol. 157, 105 (1982). 10.1016/0022-2836(82)90515-0 [DOI] [PubMed] [Google Scholar]


