

Abstract
Epithelial mesenchymal transition (EMT) is strongly associated with cancer progression, but its potential role during premalignant development has not been studied. Here we show that a four-week exposure of immortalized human bronchial epithelial cells (HBECs) to tobacco carcinogens can induce a persistent, irreversible, and multifaceted dedifferentiation program marked by EMT and the emergence of stem cell-like properties. EMT induction was epigenetically driven, initially by chromatin remodeling through H3K27me3 enrichment and later by ensuing DNA methylation to sustain silencing of tumor suppressive microRNAs miR-200b, miR-200c, and miR-205, which were implicated in the dedifferentiation program in HBECs and also in primary lung tumors. Carcinogen-treated HBECs acquired stem-like features characterized by their ability to form spheroids with branching tubules and enrichment of the CD44high/CD24low, CD133, and ALDH1 stem cell-like markers. miRNA overexpression studies indicated that regulation of the EMT, stem-like, and transformed phenotypes in HBECs were distinct events. Our findings extend present concepts of how EMT participates in cancer pathophysiology by showing that EMT induction can participate in cancer initiation to promote the clonal expansion of premalignant lung epithelial cells.
Keywords: methylation, miRNA, EMT, stem cells, transformation
Introduction
Lung cancer associated with tobacco use may soon become the leading cause of cancer related death worldwide due to the advanced stage at detection and the ineffectiveness of chemotherapy to achieve long-term remission (1). Investigations using malignant tumors and precursor lesions to adenocarcinoma and squamous cell carcinoma have provided insight into some of the genes and pathways that contribute to malignancy (2, 3). Studies using animal models and human tumors have established a link between exposure to chemical carcinogens in tobacco smoke with genomic instability (3), gene mutation (4), loss of heterozygosity (5), and epigenetic silencing of genes through DNA methylation of cytosines and histone modifications (2). Moreover, DNA methylation is now recognized as a causal epigenetic event that occurs during lung cancer progression to affect gene expression (6).
Recently, the activation of the EMT program has been implicated as an important step in the metastasis of lung and other tumors (7). This process in cancer pathogenesis involves disruption of normal epithelial integrity, with loss of morphological features of polarized epithelia, and gain of mesenchymal markers accompanied by the progressive acquisition of a motile and invasive phenotype (8). EMT is characterized by changes in several molecular pathways and networks, with the loss of E-cadherin expression emerging as a critical step driving this developmental program in human cancers, including lung (9-11). Mechanisms for loss of E-cadherin function include promoter CpG hypermethylation, histone modifications, and direct inhibition by zinc finger transcriptional repressors ZEB1, ZEB2, Snail1, and Twist1 (12-17). Recently, specific microRNAs (miRNAs) have been described as crucial regulators of the EMT process. MiRNAs are evolutionary conserved small RNAs able to modulate gene expression by inhibiting the protein translation process and/or degrading the respective target messenger RNA (18). The miR-200 family and miR-205 are key determinants of the epithelial phenotype by directly targeting ZEB1 and ZEB2, demonstrating that miRNAs can indirectly regulate E-cadherin expression (19, 20). Adding to the complexity of the EMT regulatory program is the recent discovery of a reciprocal feedback loop in which transcriptional repressors such as ZEB1 and ZEB2 bind to E-boxes within the promoter regions of the miR-200 family to repress their transcription (21, 22).
The morphological heterogeneity seen in lung tumors, suggests that EMT could be an active process driving differentiation and dedifferentiation in early tumor development (23). The E-cadherin gene is somatically inactivated in many cancers types, such as lobular carcinoma of the breast and diffuse gastric carcinoma, in which neoplastic cells throughout the entire tumor mass have lost epithelial characteristics and display a highly invasive phenotype with features of EMT(7). Reduced expression of E-cadherin is also seen in solid cancers at the tumor-stromal boundary where single invading cells exhibit growth patterns that resemble EMT (7). Local invasion of carcinoma in situ spreading through the basement membrane may also involve increased expression of zinc finger transcriptional repressors, such as ZEB1, which in turn promotes EMT (24). We have developed an in vitro premalignancy lung model that uses HBECs to identify genes and pathways critical for neoplastic transformation associated with exposure to tobacco carcinogens (25). Our initial study showed differences in transformation efficiency associated with DNA repair capacity for two HBECs after low-dose treatment with the carcinogens methylnitrosourea (MNU), benzo(a)pyrene-diolepoxide (BPDE), or both for 12 weeks (25). Protein levels of cytosine DNA methyltransferase 1 (DNMT1) increased significantly during carcinogen exposure and were associated with promoter hypermethylation of 5–10 genes in each transformed cell line (25). The HBECs displayed a change in morphology to a mesenchymal-like appearance, suggestive of EMT, after four weeks of carcinogen treatments that persisted throughout the remaining treatments and in transformed cells (colonies recovered from soft agar). The purpose of this study was to characterize the cellular and molecular changes associated with morphology and the impact on transformation.
Materials and Methods
Cell Lines and Samples
HBECs (from Drs. Shay and Minna, Southwestern Medical Center, Dallas, TX) were established from two different people (HBEC1; smoker without lung cancer; HBEC2; smoker with cancer) (26). Carcinogen exposures were previously described (25). Thirteen lung cancer-derived cell lines (Calu6, Calu3, A549, H358, H522, H23, H1435, H1975, H1993, H2023, H2085, H2228 and HCC827) obtained from and authenticated by the American Type Culture Collection (Manassas, VA). Experiments were conducted in cell lines passed for a maximum of 6-months post resuscitation.
Twenty-four frozen carcinomas (Stage I, TNM staging system) with distant normal lung tissue were obtained from our New Mexico Lung Cancer Cohort. White bloods cells (WBCs) and normal human bronchial epithelial cells (BECs) from cancer-free smokers were used as controls. All persons providing tissue specimens signed informed consent and the Institutional Review Board of Lovelace Respiratory Research Institute approved this study.
Soft agar assays
Soft agar assays were performed as described previously (27). Cultures were photographed and the colonies with diameters larger than 100 μm were counted using ImageJ software (28).
Sphere formation assay
A total of 6 × 10³ cells were plated in 24-well plates and analyzed in a non-adherent culture conditions using 10% Matrigel matrix (BD Biosciences, San Jose, CA). Plates were inspected for colony growth and branching morphology on day 10.
FACS analysis
Cells were labeled with antibodies conjugated with fluorescent dyes, anti-CD44-PE (clone G44-26; BD Bioscience), anti-CD24-FITC (clone ML5; BD Bioscience), and anti-CD133/2-APC (clone 293C3; Miltenyi Biotec, Auburn, CA). The antibodies were diluted in FACS buffer (1XPBS, 5% FBS) containing 15% blocking reagent (Miltenyi Biotec) and sorted with flow cytometer. The Aldefluor kit (STEMCELL Technologies Inc., Vancouver, Canada) was used to isolate a cell population with ALDH1 enzymatic activity (29).
Gene expression analysis
RNA was isolated with TRI-reagent (Sigma, St. Louis, MO) and reverse transcribed using the High Capacity cDNA Reverse Transcription Kit (Applied Biosystems, Carlsbad, CA). RT-qPCR was performed with the ABI PRISM 7900HT using inventoried Taqman assays (Applied Biosystems). Experiments were normalized to GAPDH. Data were analyzed with respect to a calibrator sample using the 2-ΔΔCt method (30).
Immunoblot Analysis
The anti-E-cadherin, anti-Vimentin, anti-Zeb1, anti-bactin were from Santa Cruz Biotechnology (Santa Cruz, CA) and used at 1:1000 dilution.
miR expression analysis
Total RNA (1 μg) was reverse transcribed using the miScript Reverse Transcription Kit (Qiagen, Valencia, CA). RT-qPCR was performed using the miScript PCR Kit (Qiagen). Experiments were normalized to RNU5A. Results were reported as RQ with respect to a calibrator sample using the 2-ΔΔCt method.
Chromatin immunoprecipitation assay
Antibodies specific for histone H3, dimethyl H3K4, dimethyl H3K9 (Abcam, Cambridge, MA), DNMT1 (Imgenex, San Diego, CA), and trimethyl H3K27 (from Dr. Thomas Jenuwein, IMP, Austria; (31)) were used to capture protein–DNA complexes. Rabbit and mouse IgGs were used for isotype controls. Results were generated by real-time qPCR performed in triplicate using Power SYBR® Green PCR Master Mix (Applied Biosystems). Primer sequences and PCR conditions are available upon request. Results were quantified using a 2-ΔΔCt method.
CpG cluster prediction
The enrichment for CpG dinucleotides were predicited using the online sliding window algorithm CpGPlot in the EMBOSS package from EMBL-EBI (32).
DNA methylation analysis
DNA was isolated from cell lines and tumor samples using a standard phenol–chloroform extraction. DNA was modified using the EZ DNA Methylation-Gold Kit™ (ZYMO Research, Orange, CA) and 50 ng of modified DNA was used for PCR in COBRA or bisulfite sequencing. PCR products were cloned into the pCR® 4 TOPO® Vector (Invitrogen), and 10 clones per promoter were sequenced (Sequetech, Mountain View, CA). The promoter regions of the miRNAs studied are upstream of the premiRNA transcript (+1); miR-200b -3318 to -2978 (20 CpGs), miR-200c -1301 to -920 (16 CpGs), and miR-205 -467 to -175 (3 CpGs). Primer sequences and PCR conditions are available upon request.
Decitabine (DAC) and trichostatin A (TSA) treatment
Cells were treated in duplicate as follows: Vehicle (0.6 μl ethanol in 10 ml medium), TSA (Sigma, St. Louis, MO) 300 nM for 18 h or DAC (Sigma) 500 nM for 96 h with fresh medium containing the drug changed every 24 h.
Migration and invasion assays
Cells were serum starved for 48 h and cell migration and invasion were measured using the CytoSelect™ 24-Well Cell Migration Assay (8μm, Colorimetric) and Invasion Assay (Basement Membrane, Colorimetric) kits (Cell Biolabs, San Diego, CA). Both assays were done according to the protocol and serum containing growth media of the respective cell lines were used as a chemo-attractant for 24 h.
Transfections
Cells were seeded at 70% confluency. After 24 h, cells were transfected using Lipofectamine 2000 (Invitrogen) with miRNA or control mimics (Applied Biosystems). Plasmids for stable expression of miR-200c and miR-205 were purchased from Cell Biolabs and cotransfected with linear hygromycin selection marker (Clontech, Mountain View, CA). The pSilencer™2.1 (Ambion, Austin, TX) siRNA expression vector with hygromycin resistance was used for stable gene knockdown.
Statistical analysis
All data are presented as mean ± SEM. Correlation of the quantitative data was determined using the Pearson's correlation coefficient among the different normalized expression values. Statistical significance was P <0.05.
Results
Tobacco Carcinogens induce EMT
Our previous study demonstrated that treatment of HBEC1 and HBEC2 for 12 weeks (once a week for 1 h) with genotoxic, but not cytotoxic doses of MNU, BPDE, or both induced transformation assessed by growth in soft agar (25). Moreover, the cells recovered from soft agar (transformed cells) had acquired a fibroblast-like appearance (Fig. 1A; Supplementary Fig. S1). HBEC2 cells treated with this combination of tobacco carcinogens for 4, 8, or 12 weeks were compared to the transformed cell line. After four weeks of exposure to MNU/BPDE, HBEC2 had acquired a fibroblast-like mesenchymal appearance consistent with EMT. The mesenchymal-like morphology remained throughout the remaining eight weeks of treatment and persisted after removal of the carcinogens at all time points, and in transformed cells (Fig. 1A). Transformation efficiency was greatest in HBEC2 treated with MNU/BPDE; therefore this cell line was selected for detailed temporal characterization of the mechanisms underlying the changes in their growth pattern. HBEC1 MNU/BPDE transformed cells were used to confirm studies related to EMT.
Figure 1.
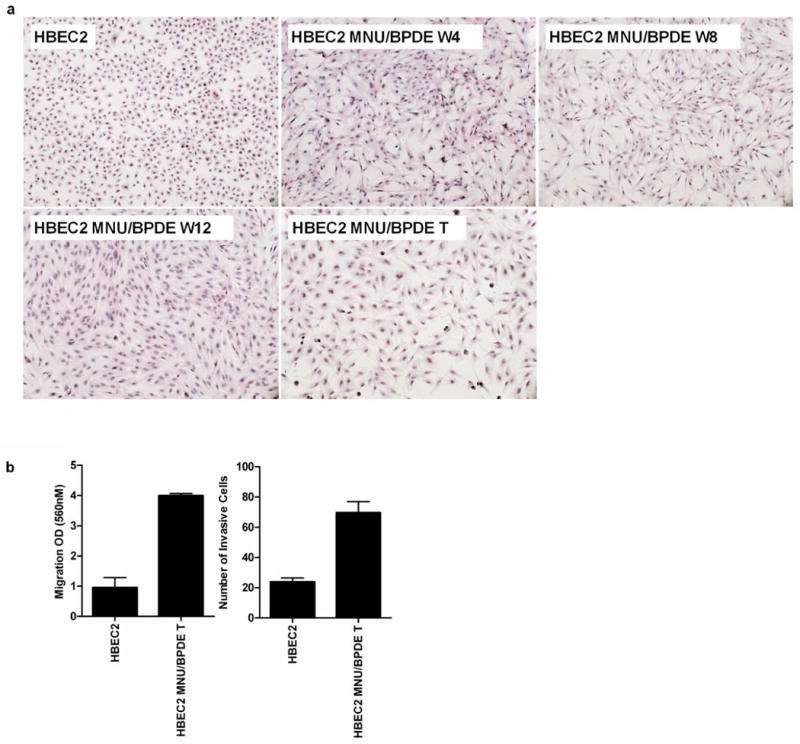
Tobacco carcinogens induce EMT and invasiveness of transformed HBEC2. (A) Morphology of HBEC2 during carcinogen treatment; HBEC2 MNU/BPDE week 4 (W4), week 8 (W8), week 12 (W12), Transformed (T) cells; 10× magnification. (B) Migration and invasion of HBEC2 MNU/BPDE T is increased compared to HBEC2. Mean ± SEM from three experiments.
In vitro motility and invasion assays were used to determine whether the induction of EMT affected the motility and invasive potential of the transformed cells. While EMT was evident after four weeks of carcinogen exposure, only the transformed cells were migratory and invasive compared to untreated HBEC2 (Fig. 1B). The molecular hallmark of EMT is decreased expression of E-cadherin and KRT19, and expression of these genes was reduced 99- and 8-fold after four weeks and 659- and 474-fold in HBEC2 transformed cells (Fig. 2; Supplementary Fig. S2; Table 1). An increase in expression was seen for the mesenchymal markers N-cadherin (150–237-fold), vimentin (6–7-fold), and fibronectin (1–21-fold) over 4 to 12 weeks (Fig. 2; Supplementary Fig. S2; Table 1). Expression of the EMT-inducing transcription factors ZEB1, ZEB2, Snail1, and Twist1 were significantly increased 2–1418-fold at week four and 5–2219-fold in transformed HBEC2 cells (Fig. 2; Supplementary Fig. S2; Table 1). HBEC1 transformed cells exhibited reduced expression of epithelial markers E-cadherin and KRT19 (2–5-fold), increased expression of mesenchymal markers N-cadherin, vimentin, and fibronectin (2–19-fold), and increased expression of EMT-inducing transcription factors ZEB1, ZEB2, Snail1, and Twist1 (3–109-fold) (Table 1). Expression of the miRNAs regulating EMT (miR-200b, miR-200c, and miR-205) was reduced 4–12-fold at 4 weeks and 10–55-fold in the HBEC2 transformed line (Fig. 3A). A 2-fold reduction in expression of these miRs was also seen in HBEC1 transformed cells (Table 1). Transient overexpression of miR-200b, miR-200c, or miR-205 in HBEC2 transformed cells did not induce a morphological mesenchymal-to-epithelial transition (MET). However, re-expression of these miRNAs with mature mimics in HBEC2 transformed cells prevented growth in soft agar (Fig. 4A). Expression of E-cadherin increased 85- and 68-fold with transient expression of miR-200b and miR-200c, respectively while a modest increase in expression (1.2 fold) was seen following transfection of miR-205 (Fig. 4B). These findings were replicated in HBEC2 transformed cells with stable integration and expression of miR-200c and miR-205 (not shown; not tested for miR-200b because the construct was not available). While, knockdown of ZEB1, ZEB2, Snail1, and Twist1 or combinations (ZEB1/ZEB2, ZEB1/Snail1, ZEB1/Twist1, ZEB2/Snail1, ZEB2/Twist1, and Snail1/Twist1) in HBEC2 transformed cells did not induce morphological MET, transformation was reversed as reflected by a dramatic reduction in the number and size of the colonies in soft agar (Supplementary Table S1).
Figure 2.
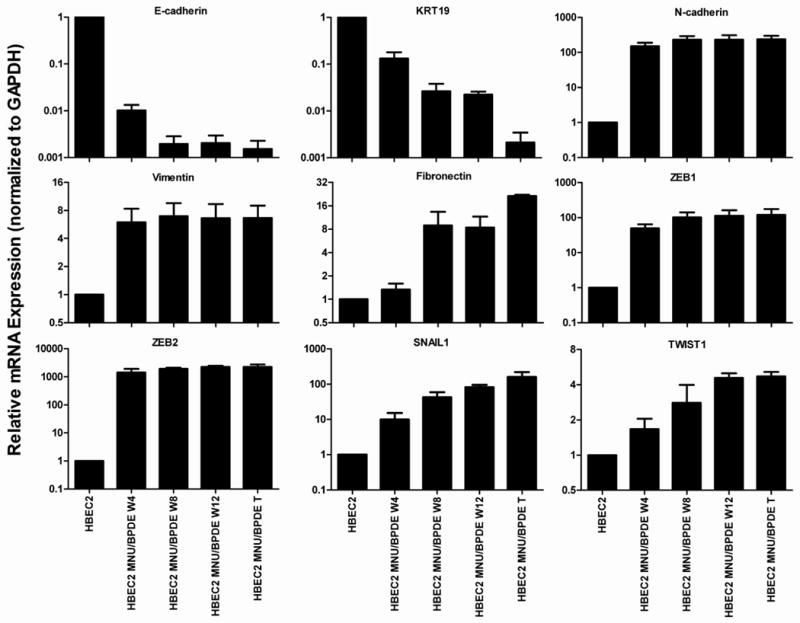
Change in expression of EMT markers in HBEC2 during 12 weeks of carcinogen exposure. Mean ± SEM of triplicate PCR assays.
Table 1. Expression of EMT and Stem-like Cell Markers, and Methylation Status of miR-200b, miR-200c, and miR-205 in Carcinogen Transformed HBECs and Lung Cancer Cell Lines.
| HBEC1MB | HBEC2MB | H1435 | HCC827 | Calu6 | A549 | ||
|---|---|---|---|---|---|---|---|
| EMT Marker Fold Change | |||||||
| E-cadherin | -2 | -659 | 2 | 0 | -373 | -5 | |
| KRT19 | -5 | -474 | 2 | 2 | -250 | -5 | |
| N-cadherin | 19 | 237 | -4 | 0 | -10 | 19 | |
| Vimentin | 2 | 7 | -7 | -16 | 13 | 2 | |
| Fibronectin | 3 | 21 | 0 | 0 | 0 | 3 | |
| ZEB1 | 3 | 119 | -3 | 2 | 122 | 26 | |
| ZEB2 | 109 | 2219 | 7 | 5 | 220 | 18 | |
| SNAIL1 | 5 | 160 | 104 | 31 | 138 | 34 | |
| TWIST1 | 6 | 5 | -9 | -2444 | -930 | -4 | |
| Stem Cell Markers (%) | |||||||
| CD44high/CD24low | 2.25 | 73.38 | 0.11 | 6.93 | 81.81 | 2.63 | |
| CD133 | 2.96 | 0.69 | 1.00 | 5.88 | 0.74 | 3.62 | |
| ALDH1 | 0.65 | 9.14 | 36.71 | 10.43 | 15.00 | 3.76 | |
| miR Fold Change (Methylation Status) | |||||||
| miR-200b | -2 (M) | -55 (M) | 0 (U) | 0 (U) | -156 (M) | -107 (M) | |
| miR-200c | -2 (M) | -10 (M) | 0 (U) | 0 (U) | -50 (M) | -42 (M) | |
| miR-205 | -2 (M) | -30 (M) | -55 (M) | -56 (M) | -77 (M) | -109 (M) | |
Gene and miRNA expression determined by qPCR. Data are mean of duplicate qPCR assays. Methylation status determined by COBRA. U, unmethylated; M, methylated.
Figure 3.
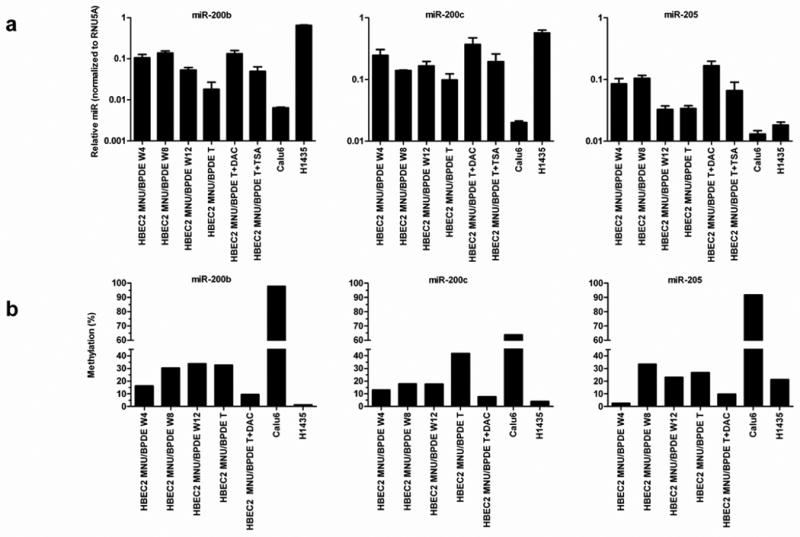
Reduced expression and increased promoter methylation of miR-200b, miR-200c, and miR-205 in HBEC2 during carcinogen exposure and in lung cancer cell lines. (A) miRNA expression was quantified by real-time qPCR after 4, 8, or 12 weeks of MNU/BPDE carcinogen exposure in HBEC2, in transformed (T) HBEC2 cells, lung cancer lines, and transformed HBEC2 cells treated with DAC or TSA. Mean ± SEM of triplicate PCR assays. (B) DNA methylation of miRNA promoters increases during carcinogen treatment and is reversed by DAC. Dense methylation of these miRNA promoters is also seen in Calu6 cells, but not in H1435 cells.
Figure 4.
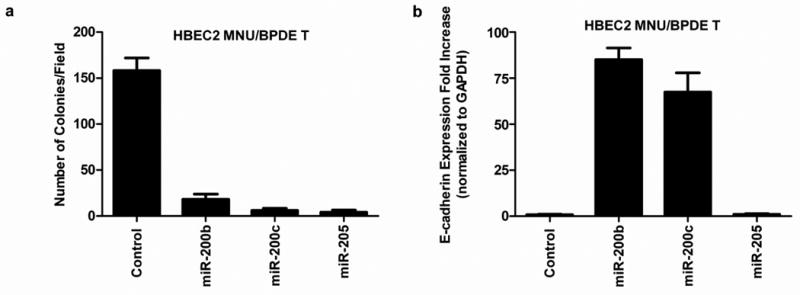
Re-expression of miR-200b, miR-200c, and miR-205 in HBEC2 MNU/BPDE transformed (T) cells abrogate colony formation and increases expression of E-cadherin. (A) miRNA mature mimics were transiently transfected into HBEC2 MNU/BPDE T and effect on growth in soft agar at day 10. Mean ± SEM of colony formation from five fields. (B) E-cadherin expression is increased 85- and 68-fold at day 10 after transfection with mature miR-200b and miR-200c mimics, respectively. Mean ± SEM of triplicate TaqMan PCR assays.
Transformed HBECs Acquire Stem-Like Features
The induction of EMT has been associated with the acquisition of stem-like features that include non-adherent growth and change in expression of cell-surface glycoproteins (33, 34). Therefore, we analyzed the ability of the transformed versus HBEC2 treated for 4, 8, or 12 weeks with carcinogens to grow in a laminin-rich growth factor-reduced Matrigel assay indicative of a non-adherent growth property of cancer stem-like/tumor progenitor cells. While EMT was present after four weeks of carcinogen treatment only the 12-week treated cells grew from single cells into small aggregate colonies, and formed spherical structures 50 μm in diameter by the 10th day. Moreover, the transformed cells formed large spheroids ≥ 100 μm with branching tubules, an in vitro characteristic of invasive cells (Fig. 5A). Re-expression of miR-200b or miR-200c with mature mimics in the transformed cells prevented growth in Matrigel (Fig. 5B). In contrast, transformed cells with transient expression of miR-205 grew as small aggregate colonies forming spheroids (50 μm in diameter), but did not form branching tubules. A similar growth pattern in the transformed cells with stable expression of miR-200c and miR-205 was observed (not shown). The stem cell-like phenotype of HBEC2 and HBEC1 was further characterized by assessing the expression of recently reported stem cell surface markers CD44, CD24, CD133, and ALDH1 (29, 33, 35). The CD44high/CD24low cell population was absent in HBEC2 and HBEC1. In marked contrast, after only four weeks of carcinogen exposure the CD44high/CD24low cell population had increased ∼14% with a striking increase of ∼73% of the HBEC2 transformed cells displaying this stem cell marker (Fig. 5C and D; Table 1). Interestingly, the transformed cells with stable re-expression of miR-200c and miR-205 retained the stem cell CD44high/CD24low cell population (65% and 82%, respectively). The CD133 marker was expressed in ∼3% and <1%, while ALDH1 was detected in <1% and 9% of HBEC1 and HBEC2 transformed cells, respectively. CD44high/CD24low, CD133, and ALDH1 were also present in 1–82% of lung cancer cell lines; however, stem cell surface markers were not associated with expression changes of the EMT markers (Fig. 5C and D; Table 1).
Figure 5.
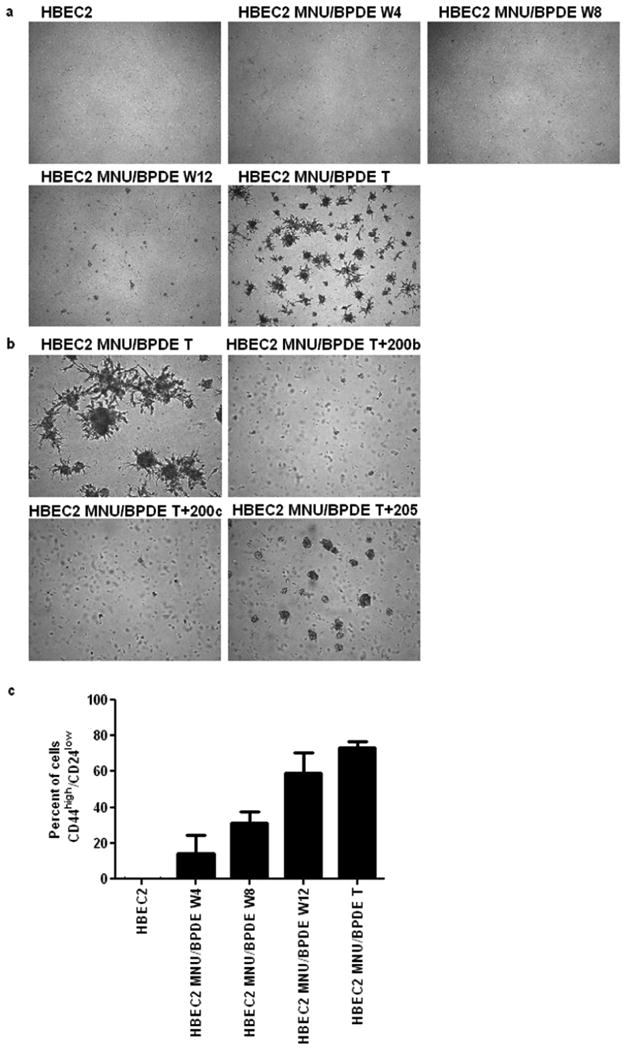
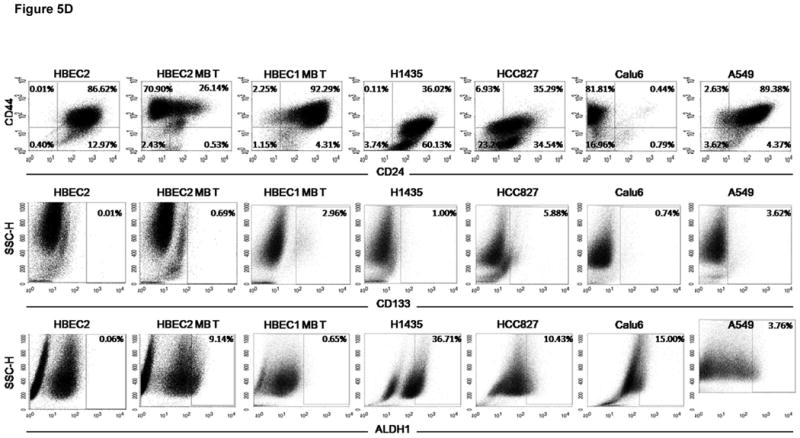
Stem-like properties are induced in HBEC2 MNU/BPDE transformed (T) cells. (A) transformed cells grow as spheroids with branching tubules in matrigel; 4× magnification. (B) Transfection of mature miR-200b and miR-200c mimics inhibit spheroid development and tubule formation. Mature miR-205 mimic inhibits tubule formation and reduces spheroid development; 10× magnification. (C) The percentage of cells expressing the CD44high/CD24low surface markers increases during carcinogen exposure. Mean ± SEM of triplicate experiments. (D) Representative FACS scatter plots of CD44high/CD24low, CD133, and ALDH1 in HBEC2, HBEC2 MNU/BPDE (MB) Transformed (T) cells, HBEC1 MNU/BPDE (MB) Transformed (T) cells, and lung cancer cell lines.
Epigenetic silencing of miR-205 and miR-200 family
The regulatory regions of miR-200b and miR-200c contain CpG-rich sequences. The recently characterized promoter of miR-200b has a CpG-island (length 2541, %GC 65.0, O/E ratio 0.69, 183 CpGs). The miR-200c promoter resides within a CpG-enriched region (length 1796, %GC 50, O/E ratio 0.60, 66 CpGs). In contrast, the regulatory region of miR-205 is nearly devoid of CpGs. HBEC2 transformed cells were treated with the demethylating agent DAC or histone deacetylase inhibitor TSA to assess the impact of cytosine DNA methylation and chromatin remodeling on the expression of these miRNAs. DAC induced robust re-expression (4–7-fold) of each miRNA, while expression increased 2–3-fold with TSA (Fig. 3A). Bisulfite sequencing revealed a small increase in CpG methylation in these promoters at week 4 (3–16%) that increased to 27–42% in the transformed cell line (Fig. 3B). The steady increase in hypermethylation was associated with a more profound reduction in expression of the miRNAs. Following treatment with DAC, the transformed cells showed near complete demethylation (∼10% methylation remaining) of CpGs within these miRNA promoters that was associated with up to a 7-fold increase in expression. The 4–12-fold reduction in expression of these miRNAs in conjunction with ≤16% CpG promoter methylation after 4 weeks of carcinogen exposure suggests that histone modifications may contribute to their transcriptional silencing. Chromatin immunoprecipitation coupled to real-time qPCR was used to investigate changes in active and repressive histone marks. The H3K4me2 (indicative of active/open chromatin) mark was absent at the promoters of these miRNAs during carcinogen exposure relative to HBEC2 (Fig. 6). In striking contrast, H3K27me3 (indicative of inactive/closed chromatin) was enriched 14–30-fold at week 4, but declined dramatically to 0.7–7-fold by week eight (Fig. 6). The occupancy of H3K9me2 (inactive/closed chromatin mark) was 0.3–1-fold at week four and increased up to 8-fold in transformed cells. Enrichment of DNMT1 at these miRNA promoters was observed at week 4 with the highest level of occupancy observed at week 12 (Fig. 6).
Figure 6.
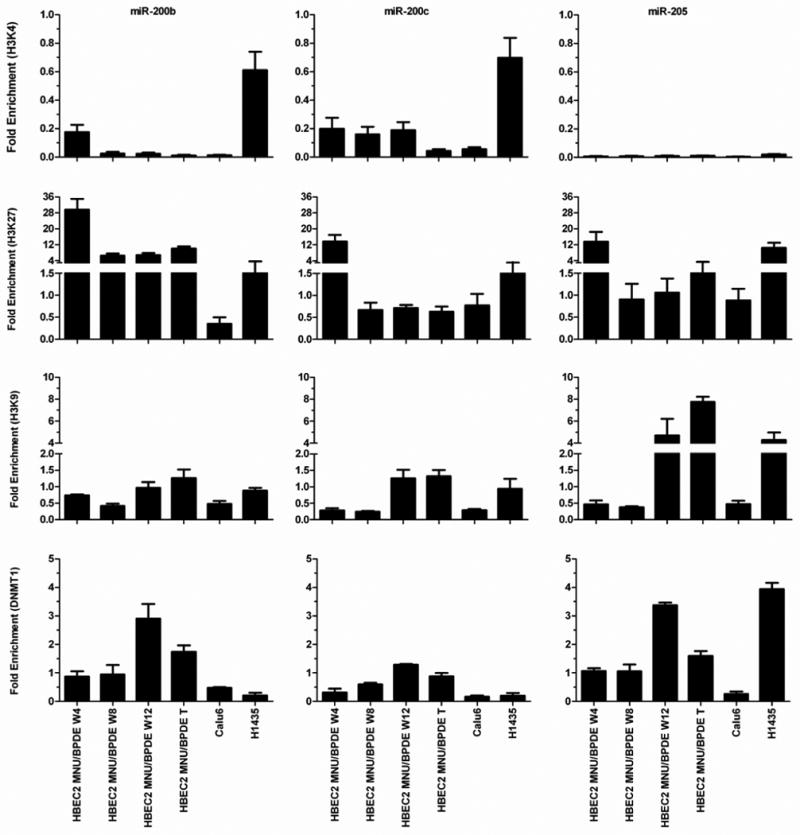
Time course for enrichment of chromatin marks at miR-200b, miR-200c, and miR-205 promoters in HBEC2 during carcinogen exposure and in lung cancer cell lines Calu6 and H1435. Active (H3K4me2) and repressive (H3K9me2, H3K27me3) chromatin marks and DNMT1 are quantified at the miRNA promoters. Mean ± SEM of triplicate qPCR assays.
Markers of EMT in lung cancer cells
Established lung cancer cell lines Calu6 and A549 display morphological features of EMT reflected by reduced expression of E-cadherin and KRT19 that is associated with methylation of miR-200b, miR-200c, and miR-205 (Table 1; Supplementary Fig. S1). The lung cancer cell lines H1435 and HCC827 have an epithelial morphology associated with normal levels of E-cadherin, KRT19, miR-200b, miR-200c, and miR-205 expression (Table 1; Supplementary Fig. S1). COBRA was used to evaluate the methylation status of these miRNAs in HBEC1 transformed cells, lung cancer cell lines, and BECs. Reduced expression of miR-200b, miR-200c, and miR-205 was strongly correlated with hypermethylation of these promoters in HBEC1 transformed cells and was associated with an EMT phenotype (Table 1). Cancer-specific methylation within the promoter of miR-200b, miR-200c, and miR-205 was found in 69, 54, and 92% of lung cancer cell lines respectively (Table 1; Supplementary Table S2), while no methylation was detected in BECs (Supplementary Table S3). Bisulfite sequencing detected dense methylation in Calu6 cells (64–98%) that correlated with reduced miRNA expression and modest enrichment of H3K27me3, H3K9me2, and DNMT1 (Fig. 3 and 6). In contrast, miR-200b and miR-200c were sparsely methylated (∼4%) and highly expressed in H1435 cells (Fig. 3). Moderate methylation (21% of CpGs) and lower expression of miR-205 was seen in H1435 along with enrichment of H3K27me3, H3K9me2, and DNMT1 (Fig. 3 and 6). The expression of E-cadherin and ZEB1 reflected the methylation and expression status of these miRNAs in lung cancer cell lines (Table 1). A recent study (36) reported cell-type specific methylation of miR-200c in fibroblasts, suggesting differential regulation in this cell type. Primary tumors are heterogeneous and contain stromal cells consisting of fibroblasts, endothelial, and inflammatory cells. Assessing the prevalence of DNA methylation in these miRNAs from primary blood lymphocytes (WBCs) revealed extensive and frequent methylation of these promoters (Supplementary Table S3), an effect that may support the non-adherent properties of this circulating cell population. The high prevalence for methylation in stromal cells confounds the evaluation of promoter methylation of these miRNAs in primary lung tumors. As an alternative approach, qRT-PCR was used to investigate miRNA expression patterns in 24 primary lung carcinomas relative to distant normal lung tissue (Supplementary Table S4). Reduced expression of at least one miRNA was observed in 9 of 24 (38%) primary lung tumors. The expression of miR-200b and miR-200c was significantly correlated (r = 0.595, p = 0.002). The EMT markers ZEB1 (r= -0.365, p = 0.07) and KRT19 (r = 0.396, p = 0.05) were associated with reduced expression of miR-200b suggesting that EMT is a feature of some non-metastatic lung tumors.
Discussion
These studies show that the exposure of immortalized HBECs to tobacco carcinogens rapidly induces a multifaceted dedifferentiation program characterized by EMT and stem-like properties. The induction of EMT is epigenetically driven, initially by chromatin remodeling with ensuing promoter DNA methylation sustaining stable silencing of the miRNAs implicated in this developmental program. Finally, and of great importance is the finding that the regulation of EMT morphology, induction of stem-like phenotype, and transformation are distinct events in response to carcinogen exposure.
EMT occurs during embryogenesis to support tissue remodeling and has been proposed as a key step in the metastasis of epithelial tumors (9, 37). Experimental models to characterize the genotypic and phenotypic changes of EMT during tumor invasion have used ectopic expression of transcription factors such as Twist or Snail or alternatively stimulation of these transcription factors by the growth factors TGFβ and TNFα; which are present in the tumor microenvironment (14, 22). Abrogating the increased expression of these transcription factors induced MET and reversed phenotypic (growth in soft agar) and gene expression changes (e.g., E-cadherin and miR-200 family) linked to this developmental program. Our studies offer new insight into the role and regulation of EMT in lung carcinogenesis. We demonstrate that EMT can be induced by DNA damage generated from carcinogens present within tobacco smoke. An attribute of this premalignancy model is the ability to define the timing of events occurring during carcinogen exposure. Although EMT was induced after 4 weeks, these cells failed to exhibit enhanced proliferative and invasive phenotypes (growth in soft agar and Matrigel). Rather, after 12 weeks of carcinogen exposure HBEC2 became highly enriched for the CD44high/CD24low stem cell marker and transformed cells exhibited non-adherent growth associated with invasive properties of branching morphogenesis and increased migration and invasion. Interestingly, the acquisition of this stem-like cell feature is not required for the enhanced proliferative and invasive properties displayed by the transformed HBECs. This conclusion is based on the fact that stable overexpression of miR-200c or miR-205 reverses branching morphogenesis and non-adherent growth of the transformed cells without reducing the population of cells enriched for the CD44high/CD24low cell marker or changing the morphology (EMT to MET). These results may reflect the multitude of signaling networks regulating EMT (e.g., WNT and receptor tyrosine kinase signaling) that are likely impacted by carcinogen exposure (24, 38). Thus, the deregulation of pathways controlling cell morphology, miRNAs, transcriptional regulators, and phenotype associated with EMT are not always coordinately regulated. This conclusion is further substantiated by the extension of our findings in this model of premalignancy to malignant lung tumor-derived cell lines and primary tumors. The plasticity of EMT is clearly evident based on the fact that some cancer cell lines display many of the hallmarks of EMT: reduced expression of E-cadherin and requisite miRNAs and increased expression of ZEB1, while exhibiting an epithelial rather than a mesenchymal morphology. Nonmetastatic primary lung tumors also displayed features of EMT as evident by the reduced expression of miRNAs in our study. Interestingly, Yanagawa et al. (39) demonstrated that increased expression of Snail in adenocarcinoma was associated with poor prognosis and heterogeneous E-cadherin expression, with a greater reduction seen in the poorly differentiated component of the tumors. Together, these findings extend the role of EMT from cancer metastasis to initiation and progression of lung cancer.
The histone methyltransferase EZH2 along with EED and SUZ12 comprise the Polycomb Repressive Complex 2 (PRC) to catalyze the repressive trimethylation mark at lysine 27 of histone H3 (H3K27me3). Stem cells rely on polycomb-group proteins to reversibly repress genes encoding transcription factors required for differentiation (40). Several recent studies support the hypothesis of a stem cell signature in cancer in which differentiated cells undergoing transformation acquire stem cell characteristics through a process of dedifferentiation by enrichment of the H3K27me3 and de novo cytosine DNA methylation (41). This scenario was observed during transformation of HBECs in which carcinogen exposure first led to a reduction in expression of these EMT-regulating miRNAs by recruitment of H3K27me3 followed by epigenetic switching in which this histone modification was replaced by cytosine DNA methylation within the miRNA promoters. Epigenetic switching has recently been described for genes in a prostate cancer cell line (42).
Substantial evidence linking DNA damage to the acquisition of epigenetic silencing via chromatin remodeling and cytosine DNA methylation is now emerging. One factor contributing to aberrant de novo cytosine DNA methylation during DNA damage is the rapid recruitment of DNMT1 to sites of DNA damage (43). Le Gac et al. (44) found that in cells treated with doxorubicin that induces double strand breaks, DNMT1 is recruited by activated p53 and binds to functional Sp1 sites within promoters of the Survivin, CDC2, and CDC25 genes. Moreover, the transcriptional repressor HDAC1 and the repressive chromatin mark H3K9me2 were also found at these promoters following DNA damage (44, 45). Cuozzo et al. (46) provides stronger support for a mechanistic link between DNA damage and DNA methylation. In that study, a recombinant plasmid containing a 1-SCE1 restriction site within one copy of two inactivated tandem repeated green fluorescent protein (GFP) genes was introduced into HeLa or mouse embryonic stem cells. The restriction endonuclease 1-Sce1 was added to the cells to induce a double strand break in the GFP gene at this site. Rapid gene silencing associated with homologous recombination and DNA methylation of GFP was seen and could be blocked by treatment with DAC. The initiation of epigenetic silencing in our study of miR-200b, miR-200c, and miR-205 by trimethylation of H3K27 provides another link between chromatin remodeling and transcriptional repression in response to DNA damage. Finally, our previous study revealed that reduced DNA repair capacity is associated with increased gene promoter methylation in the aerodigestive tract of smokers (47). Collectively, these findings provide both in vitro and in vivo support for a major role of tobacco carcinogens in affecting epigenetic regulation of miRNAs and genes involved in lung carcinogenesis.
Our model of tobacco carcinogen-induced premalignancy shows temporally that initiation of EMT occurs after just four weeks of carcinogen exposure followed by the acquisition of other stem-like cell traits: spheroids with branching tubules and a marked enrichment for stem-like cell markers CD44high/CD24low, and/or CD133/ALDH1 in HBEC transformed cells. However, in spite of displaying in vitro characteristics of highly invasive cells, the HBEC transformed cell lines did not grow orthotopically in nude mice (25). The ability to confer a complete malignant and metastatic phenotype has been associated with the presence of EMT, K-ras, and p53 mutations in murine cell lines (9). Mutation of the K-ras and p53 genes, generally late events in tumor development (48, 49), was not observed in carcinogen treated HBECs (25). However, our in vitro model establishes a link between tobacco carcinogen exposure, epigenetic induction of EMT, and the development of stem-like cell phenotype that together may represent some of the early events driving the clonal expansion of premalignant lung cells.
Supplementary Material
Acknowledgments
Supported by a research grant from National Institutes of Health (R01 ES008801).
Footnotes
Disclosure of Potential Conflicts of Interest: No potential conflicts of interest were disclosed
References
- 1.Parkin DM, Bray F, Ferlay J, Pisani P. Global cancer statistics, 2002. CA Cancer J Clin. 2005;55:74–108. doi: 10.3322/canjclin.55.2.74. [DOI] [PubMed] [Google Scholar]
- 2.Belinsky SA. Silencing of genes by promoter hypermethylation: key event in rodent and human lung cancer. Carcinogenesis. 2005;26:1481–87. doi: 10.1093/carcin/bgi020. [DOI] [PubMed] [Google Scholar]
- 3.Mao L, Lee JS, Kurie JM, et al. Clonal genetic alterations in the lungs of current and former smokers. J Natl Cancer Inst. 1997;89:857–62. doi: 10.1093/jnci/89.12.857. [DOI] [PubMed] [Google Scholar]
- 4.Franklin WA, Gazdar AF, Haney J, et al. Widely dispersed p53 mutation in respiratory epithelium. A novel mechanism for field carcinogenesis. J Clin Invest. 1997;100:2133–7. doi: 10.1172/JCI119748. [DOI] [PMC free article] [PubMed] [Google Scholar]
- 5.Powell CA, Klares S, O'Connor G, Brody JS. Loss of heterozygosity in epithelial cells obtained by bronchial brushing: clinical utility in lung cancer. Clin Cancer Res. 1999;5:2025–34. [PubMed] [Google Scholar]
- 6.Anglim PP, Alonzo TA, Laird-Offringa IA. DNA methylation-based biomarkers for early detection of non-small cell lung cancer: an update. Mol Cancer. 2008;7:81. doi: 10.1186/1476-4598-7-81. [DOI] [PMC free article] [PubMed] [Google Scholar]
- 7.Guarino M, Rubino B, Ballabio G. The role of epithelial-mesenchymal transition in cancer pathology. Pathology. 2007;39:305–18. doi: 10.1080/00313020701329914. [DOI] [PubMed] [Google Scholar]
- 8.Islam S, Carey TE, Wolf GT, Wheelock MJ, Johnson KR. Expression of N-cadherin by human squamous carcinoma cells induces a scattered fibroblastic phenotype with disrupted cell-cell adhesion. J Cell Biol. 1996;135:1643–54. doi: 10.1083/jcb.135.6.1643. [DOI] [PMC free article] [PubMed] [Google Scholar]
- 9.Gibbons DL, Lin W, Creighton CJ, et al. Contextual extracellular cues promote tumor cell EMT and metastasis by regulating miR-200 family expression. Genes Dev. 2009;23:2140–51. doi: 10.1101/gad.1820209. [DOI] [PMC free article] [PubMed] [Google Scholar]
- 10.Huber MA, Kraut N, Beug H. Molecular requirements for epithelial-mesenchymal transition during tumor progression. Curr Opin Cell Biol. 2005;17:548–58. doi: 10.1016/j.ceb.2005.08.001. [DOI] [PubMed] [Google Scholar]
- 11.Dohadwala M, Yang SC, Luo J, et al. Cyclooxygenase-2-dependent regulation of E-cadherin: prostaglandin E(2) induces transcriptional repressors ZEB1 and snail in non-small cell lung cancer. Cancer Res. 2006;66:5338–45. doi: 10.1158/0008-5472.CAN-05-3635. [DOI] [PubMed] [Google Scholar]
- 12.Yang J, Mani SA, Donaher JL, et al. Twist, a master regulator of morphogenesis, plays an essential role in tumor metastasis. Cell. 2004;117:927–39. doi: 10.1016/j.cell.2004.06.006. [DOI] [PubMed] [Google Scholar]
- 13.Comijn J, Berx G, Vermassen P, et al. The two-handed E box binding zinc finger protein SIP1 downregulates E-cadherin and induces invasion. Mol Cell. 2001;7:1267–78. doi: 10.1016/s1097-2765(01)00260-x. [DOI] [PubMed] [Google Scholar]
- 14.Cano A, Perez-Moreno MA, Rodrigo I, et al. The transcription factor snail controls epithelial-mesenchymal transitions by repressing E-cadherin expression. Nat Cell Biol. 2000;2:76–83. doi: 10.1038/35000025. [DOI] [PubMed] [Google Scholar]
- 15.Eger A, Aigner K, Sonderegger S, et al. DeltaEF1 is a transcriptional repressor of E-cadherin and regulates epithelial plasticity in breast cancer cells. Oncogene. 2005;24:2375–85. doi: 10.1038/sj.onc.1208429. [DOI] [PubMed] [Google Scholar]
- 16.Lombaerts M, van Wezel T, Philippo K, et al. E-cadherin transcriptional downregulation by promoter methylation but not mutation is related to epithelial-to-mesenchymal transition in breast cancer cell lines. Br J Cancer. 2006;94:661–71. doi: 10.1038/sj.bjc.6602996. [DOI] [PMC free article] [PubMed] [Google Scholar]
- 17.Peinado H, Ballestar E, Esteller M, Cano A. Snail mediates E-cadherin repression by the recruitment of the Sin3A/histone deacetylase 1 (HDAC1)/HDAC2 complex. Mol Cell Biol. 2004;24:306–19. doi: 10.1128/MCB.24.1.306-319.2004. [DOI] [PMC free article] [PubMed] [Google Scholar]
- 18.Bartel DP. MicroRNAs: target recognition and regulatory functions. Cell. 2009;136:215–33. doi: 10.1016/j.cell.2009.01.002. [DOI] [PMC free article] [PubMed] [Google Scholar]
- 19.Gregory PA, Bert AG, Paterson EL, et al. The miR-200 family and miR-205 regulate epithelial to mesenchymal transition by targeting ZEB1 and SIP1. Nat Cell Biol. 2008;10:593–601. doi: 10.1038/ncb1722. [DOI] [PubMed] [Google Scholar]
- 20.Park SM, Gaur AB, Lengyel E, Peter ME. The miR-200 family determines the epithelial phenotype of cancer cells by targeting the E-cadherin repressors ZEB1 and ZEB2. Genes Dev. 2008;22:894–907. doi: 10.1101/gad.1640608. [DOI] [PMC free article] [PubMed] [Google Scholar]
- 21.Bracken CP, Gregory PA, Kolesnikoff N, et al. A double-negative feedback loop between ZEB1-SIP1 and the microRNA-200 family regulates epithelial-mesenchymal transition. Cancer Res. 2008;68:7846–54. doi: 10.1158/0008-5472.CAN-08-1942. [DOI] [PubMed] [Google Scholar]
- 22.Burk U, Schubert J, Wellner U, et al. A reciprocal repression between ZEB1 and members of the miR-200 family promotes EMT and invasion in cancer cells. EMBO Rep. 2008;9:582–9. doi: 10.1038/embor.2008.74. [DOI] [PMC free article] [PubMed] [Google Scholar]
- 23.Borczuk AC, Toonkel RL, Powell CA. Genomics of lung cancer. Proc Am Thorac Soc. 2009;6:152–8. doi: 10.1513/pats.200807-076LC. [DOI] [PMC free article] [PubMed] [Google Scholar]
- 24.Polyak K, Weinberg RA. Transitions between epithelial and mesenchymal states: acquisition of malignant and stem cell traits. Nat Rev Cancer. 2009;9:265–73. doi: 10.1038/nrc2620. [DOI] [PubMed] [Google Scholar]
- 25.Damiani LA, Yingling CM, Leng S, Romo PE, Nakamura J, Belinsky SA. Carcinogen-induced gene promoter hypermethylation is mediated by DNMT1 and causal for transformation of immortalized bronchial epithelial cells. Cancer Res. 2008;68:9005–14. doi: 10.1158/0008-5472.CAN-08-1276. [DOI] [PubMed] [Google Scholar]
- 26.Ramirez RD, Sheridan S, Girard L, et al. Immortalization of human bronchial epithelial cells in the absence of viral oncoproteins. Cancer Res. 2004;64:9027–34. doi: 10.1158/0008-5472.CAN-04-3703. [DOI] [PubMed] [Google Scholar]
- 27.Cifone MA, Fidler IJ. Correlation of patterns of anchorage-independent growth with in vivo behavior of cells from a murine fibrosarcoma. Proc Natl Acad Sci U S A. 1980;77:1039–43. doi: 10.1073/pnas.77.2.1039. [DOI] [PMC free article] [PubMed] [Google Scholar]
- 28.Abramoff MD, Magelhaes PJ, Ram SJ. Image Processing with ImageJ. Biophotonics International. 2004;11 [Google Scholar]
- 29.Jiang F, Qiu Q, Khanna A, et al. Aldehyde dehydrogenase 1 is a tumor stem cell-associated marker in lung cancer. Mol Cancer Res. 2009;7:330–8. doi: 10.1158/1541-7786.MCR-08-0393. [DOI] [PMC free article] [PubMed] [Google Scholar]
- 30.Schmittgen TD, Livak KJ. Analyzing real-time PCR data by the comparative C(T) method. Nat Protoc. 2008;3:1101–8. doi: 10.1038/nprot.2008.73. [DOI] [PubMed] [Google Scholar]
- 31.Peters AH, Kubicek S, Mechtler K, et al. Partitioning and plasticity of repressive histone methylation states in mammalian chromatin. Mol Cell. 2003;12:1577–89. doi: 10.1016/s1097-2765(03)00477-5. [DOI] [PubMed] [Google Scholar]
- 32.Rice P, Longden I, Bleasby A. EMBOSS: the European Molecular Biology Open Software Suite. Trends Genet. 2000;16:276–7. doi: 10.1016/s0168-9525(00)02024-2. [DOI] [PubMed] [Google Scholar]
- 33.Mani SA, Guo W, Liao MJ, et al. The epithelial-mesenchymal transition generates cells with properties of stem cells. Cell. 2008;133:704–15. doi: 10.1016/j.cell.2008.03.027. [DOI] [PMC free article] [PubMed] [Google Scholar]
- 34.Morel AP, Lievre M, Thomas C, Hinkal G, Ansieau S, Puisieux A. Generation of breast cancer stem cells through epithelial-mesenchymal transition. PLoS One. 2008;3:e2888. doi: 10.1371/journal.pone.0002888. [DOI] [PMC free article] [PubMed] [Google Scholar]
- 35.Zhu Z, Hao X, Yan M, et al. Cancer stem/progenitor cells are highly enriched in CD133+CD44+ population in hepatocellular carcinoma. Int J Cancer. 2010;126:2067–78. doi: 10.1002/ijc.24868. [DOI] [PubMed] [Google Scholar]
- 36.Vrba L, Jensen TJ, Garbe JC, et al. Role for DNA methylation in the regulation of miR-200c and miR-141 expression in normal and cancer cells. PLoS One. 2010;5:e8697. doi: 10.1371/journal.pone.0008697. [DOI] [PMC free article] [PubMed] [Google Scholar]
- 37.Yang J, Weinberg RA. Epithelial-mesenchymal transition: at the crossroads of development and tumor metastasis. Dev Cell. 2008;14:818–29. doi: 10.1016/j.devcel.2008.05.009. [DOI] [PubMed] [Google Scholar]
- 38.Liu F, Killian JK, Yang M, et al. Epigenomic alterations and gene expression profiles in respiratory epithelia exposed to cigarette smoke condensate. Oncogene. 2010;29:3650–64. doi: 10.1038/onc.2010.129. [DOI] [PMC free article] [PubMed] [Google Scholar]
- 39.Yanagawa J, Walser TC, Zhu LX, et al. Snail promotes CXCR2 ligand-dependent tumor progression in non-small cell lung carcinoma. Clin Cancer Res. 2009;15:6820–29. doi: 10.1158/1078-0432.CCR-09-1558. [DOI] [PMC free article] [PubMed] [Google Scholar]
- 40.Lee TI, Jenner RG, Boyer LA, et al. Control of developmental regulators by Polycomb in human embryonic stem cells. Cell. 2006;125:301–13. doi: 10.1016/j.cell.2006.02.043. [DOI] [PMC free article] [PubMed] [Google Scholar]
- 41.Ohm JE, McGarvey KM, Yu X, et al. A stem cell-like chromatin pattern may predispose tumor suppressor genes to DNA hypermethylation and heritable silencing. Nat Genet. 2007;39:237–42. doi: 10.1038/ng1972. [DOI] [PMC free article] [PubMed] [Google Scholar]
- 42.Gal-Yam EN, Egger G, Iniguez L, et al. Frequent switching of Polycomb repressive marks and DNA hypermethylation in the PC3 prostate cancer cell line. Proc Natl Acad Sci U S A. 2008;105:12979–84. doi: 10.1073/pnas.0806437105. [DOI] [PMC free article] [PubMed] [Google Scholar]
- 43.Mortusewicz O, Schermelleh L, Walter J, Cardoso MC, Leonhardt H. Recruitment of DNA methyltransferase I to DNA repair sites. Proc Natl Acad Sci U S A. 2005;102:8905–09. doi: 10.1073/pnas.0501034102. [DOI] [PMC free article] [PubMed] [Google Scholar]
- 44.Le Gac G, Esteve PO, Ferec C, Pradhan S. DNA damage-induced down-regulation of human Cdc25C and Cdc2 is mediated by cooperation between p53 and maintenance DNA (cytosine-5) methyltransferase 1. J Biol Chem. 2006;281:24161–70. doi: 10.1074/jbc.M603724200. [DOI] [PubMed] [Google Scholar]
- 45.Esteve PO, Chin HG, Pradhan S. Molecular mechanisms of transactivation and doxorubicin-mediated repression of survivin gene in cancer cells. J Biol Chem. 2007;282:2615–25. doi: 10.1074/jbc.M606203200. [DOI] [PubMed] [Google Scholar]
- 46.Cuozzo C, Porcellini A, Angrisano T, et al. DNA damage, homology-directed repair, and DNA methylation. PLoS Genet. 2007;3:e110. doi: 10.1371/journal.pgen.0030110. [DOI] [PMC free article] [PubMed] [Google Scholar]
- 47.Leng S, Stidley CA, Willink R, et al. Double-strand break damage and associated DNA repair genes predispose smokers to gene methylation. Cancer Res. 2008;68:3049–56. doi: 10.1158/0008-5472.CAN-07-6344. [DOI] [PMC free article] [PubMed] [Google Scholar]
- 48.Sugio K, Kishimoto Y, Virmani AK, Hung JY, Gazdar AF. K-ras mutations are a relatively late event in the pathogenesis of lung carcinomas. Cancer Res. 1994;54:5811–5. [PubMed] [Google Scholar]
- 49.Wakamatsu K, Nakanishi Y, Takayama K, Miyazaki H, Hayashi K, Hara N. Frequent expression of p53 protein without mutation in the atypical epithelium of human bronchus. Am J Respir Cell Mol Biol. 1999;21:209–15. doi: 10.1165/ajrcmb.21.2.3524. [DOI] [PubMed] [Google Scholar]
Associated Data
This section collects any data citations, data availability statements, or supplementary materials included in this article.