

Abstract
Mitochondria play critical roles in oxidative phosphorylation and energy metabolism. Increasing evidence supports that mitochondrial DNA (mtDNA) damage and dysfunction play vital roles in the development of many mitochondria-related diseases, such as obesity, diabetes mellitus, infertility, neurodegenerative disorders, and malignant tumors in humans. Human 8-oxoguanine-DNA glycosylase 1 (hOGG1) transgenic (TG) mice were produced by nuclear microinjection. Transgene integration was analyzed by PCR. Transgene expression was measured by RT-PCR and Western blot analysis. Mitochondrial DNA damage was analyzed by mutational analyses and measurement of mtDNA copy number. Total fat content was measured by a whole-body scan using dual-energy X-ray absorptiometry. The hOGG1 overexpression in mitochondria increased the abundance of intracellular free radicals and major deletions in mtDNA. Obesity in hOGG1 TG mice resulted from increased fat content in tissues, produced by hyperphagia. The molecular mechanisms of obesity involved overexpression of genes in the central orexigenic (appetite-stimulating) pathway, peripheral lipogenesis, down-regulation of genes in the central anorexigenic (appetite-suppressing) pathway, peripheral adaptive thermogenesis, and fatty acid oxidation. Diffuse hepatosteatosis, female infertility, and increased frequency of malignant lymphoma were also seen in these hOGG1 TG mice. High levels of hOGG1 expression in mitochondria, resulting in enhanced oxidative DNA damage processing, may be an important factor in human metabolic syndrome, infertility, and malignancy.
Mitochondria are dynamic intracellular organelles that play central roles in energy metabolism (ie, production of ATP and heat), reactive oxygen species (ROS) generation, and apoptosis regulation1 in response to cellular metabolic needs or environmental temperature changes. Because of their critical roles in these important cellular functions, mitochondria are implicated in a wide variety of human diseases, including obesity and type 2 diabetes mellitus,2,3 neurodegenerative diseases,4 infertility,5 and human malignancies.6 A more direct cause-and-effect relationship between mitochondrial dysfunction and human diseases was demonstrated in the report7 that antiviral agents used to treat patients with AIDS could damage mitochondrial function by inhibiting the mitochondrial DNA (mtDNA) polymerase γ, resulting in hyperlactatemia, lipodystrophy (ie, the accumulation of visceral fat, breast adiposity, and cervical fat pads), and insulin resistance.
The mitochondrion is the only organelle with its own extranuclear DNA, which comprises a closed, circular, 16.6-kb double-stranded DNA molecule. Although mitochondria harbor hundreds of proteins, mtDNA contains only 13 genes that encode proteins exclusively involved in oxidative phosphorylation. Because of its close proximity to electron transport proteins and the lack of protection by histone proteins, mtDNA is particularly susceptible to damage from ROS released during mitochondrial oxidative phosphorylation. Indeed, the mutation rate of mtDNA is estimated to be several orders of magnitude higher than that of nuclear DNA.8
Base excision repair is a major pathway for repairing DNA damage caused by ROS in mitochondria. The precisely regulated multistep pathway involves sequential activities of four key enzymes: DNA glycosylase/apyrimidinic site lyase, apurinic/apyrimidinic endonuclease, DNA polymerase, and DNA ligase.9,10 Altered expression levels of any of these enzymes often attenuate the overall repair efficiency, resulting in increased levels of persistent DNA damage.
The predominant base oxidation product in mitochondria is 8-oxoguanine (8-oxoG), a highly mutagenic lesion. If not repaired by base excision repair pathway's first and rate-limiting enzyme, 8-oxoG-DNA glycosylase 1 (OGG1), it can mispair with A to yield G:C to T:A transversion mutations.11 Overexpression of OGG1 in cellular systems has produced conflicting results; several groups12–14 reported beneficial effects after experimentally induced oxidative stress, but others15–17 described increased levels of DNA damage because of excessive processing by overexpressed human OGG1 (hOGG1). In the latter case, it has been proposed that above a certain level of damage, the individual lesions are increasingly produced in close proximity on the opposite strands of DNA so that subsequent repair by overexpressed DNA glycosylases can convert them into lethal double-strand breaks.15,17 When this paradoxical increase in DNA damage with enhanced DNA glycosylase expression levels occurs in mitochondria, mitochondrial respiration and oxidative phosphorylation would be adversely affected and energy metabolism (ie, ATP production) would be disrupted. Possibly, to maintain normal cellular functions, the mitochondria with less damage would have to increase their respiration rate and oxidative phosphorylation to make up for the loss of energy production. The increase in mitochondrial respiration and oxidative phosphorylation can lead to increased ROS production by the mitochondria. Indeed, increased ROS production has been reported, along with an increased mitochondrial respiration rate and membrane potential in cells overexpressing the hOGG1 gene.18 To investigate the roles of mtDNA damage in disease development, we generated transgenic (TG) mice that targeted hOGG1 to the mitochondria of a wide variety of tissues. These mice displayed increased intracellular ROS production and widespread mtDNA damage and developed spontaneous obesity and marked hepatosteatosis. These results support the idea that hOGG1 expression levels in mitochondria may play a critical role in the development of obesity and provide an animal model of generalized mtDNA damage to study the molecular mechanisms and possible therapeutic intervention of mitochondria-related diseases in humans.
Materials and Methods
Generation of TG Mice
The mouse metallothionein (mMT) 1 gene promoter–hOGG1 mammalian expression vector (Figure 1A) that overexpresses hOGG1 in mitochondria was constructed as previously described.18 The 1.5-kb segment containing the full-length hOGG1 (mitochondrial isoform type 2a) cDNA was removed from the pSPORT1-hOGG1 plasmid (a gift from Dr. Deborah Barnes and Tomas Lindahl, Imperial Cancer Research Fund, London, UK) and inserted into the BamHI cloning site of the MThGH vector (a gift from Dr. Geoffrey P. Margison, CRC Paterson Institute for Cancer Research, Manchester, UK).18 This MThGH vector contains a 1.7-kb mMT1 regulatory element at the 5′ end and a 1.8-kb transcription unit of human growth hormone gene. This construct was digested with HindIII to release a 5-kb fragment for pronuclear microinjection and generation of TG mice. The integrity of the full-length hOGG1 cDNA was confirmed by sequencing. All animal experiments were approved by the Institutional Animal Care and Use Committee at the University of Arkansas for Medical Sciences (Little Rock, AK).
Figure 1.
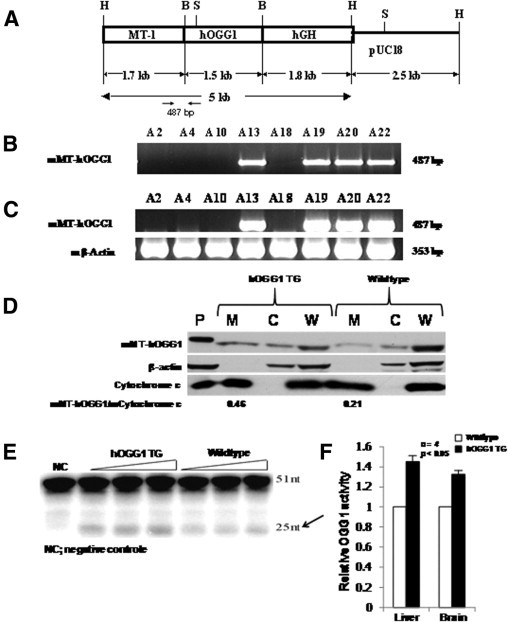
Integration and overexpression of mMT-hOGG1 transgene in TG mice. A: Schematic representation of the MT-hOGG1 construct. The 1.5-kb hOGG1 cDNA was ligated into the unique BamHI site of the pMThGH vector (H, HindIII; B, BamHI; S, ScaI; hGH, transcription unit of the human growth hormone gene that contains several introns and a polyadenylation signal). The 5-kb HindIII fragment was used for pronuclear microinjection. B: The PCR identification of the hOGG1 transgene. The transgene was integrated in A13, A19, A20, and A22 mice. C: Overexpression of hOGG1 transgene mRNA. The hOGG1 transcript was only detected in liver tissues of hOGG1 TG mice that harbor the transgene (A13, A19, A20, and A22). D: Overexpression of mMT-hOGG1 protein in TG mice. Mitochondrial (M), cytosolic (C), and whole cell (W) extracts from the liver of TG and wild-type control mice (CO) were subjected to Western blot analysis using antibodies against OGG1, β-actin, and cytochrome c. Estimates of mMT-hOGG1 protein in mitochondrial extract are presented as a ratio of intensities for bands representing the mMT-hOGG1 protein over those of mouse mitochondrial cytochrome c. E: Increased mMT-hOGG1 activity in liver mitochondrial extracts of hOGG1 TG mice compared with CO. The arrow indicates a 25-n product cleaved by the hOGG1 enzyme from a 51-nt substrate. NC indicates negative control. F: Average OGG1 glycosylase activity from four samples of liver and brain of mMT-hOGG1 TG mice expressed relative to the samples from CO. The bars indicate the mean ± SE (n = 4).
For transgene identification, primer sequences were designed as follows: 5′-ACTATGCGTGGGCTGGA-3′ (forward), derived from the mMT1 promoter; and 5′-CTAGCCTGGCTCTTGTCT-3′ (reverse), derived from exon 2 of hOGG1. This primer set will only amplify the hOGG1 transgene and will not amplify the endogenous mouse OGG1 (mOGG1) gene.
RT-PCR for hOGG1 mRNA
Total RNA was extracted from 50 mg of mice livers using a reagent (TRIzol; Invitrogen Corp, Carlsbad, CA), according to the manufacturer's instructions. The hOGG1 mRNA expression in these TG mice was analyzed by RT-PCR using a commercially available system (SuperScript One-Step RT-PCR with Platinum Taq System; Invitrogen Corp). The mRNA expression of the β-actin gene was run in parallel as an internal control. The primer sets used in RT-PCR detection of hOGG1 mRNA expression were the same as those used in PCR detection of hOGG1 transgene integration.
Preparation of Mitochondrial, Cytosolic, and Whole Cell Extracts
Mitochondria were isolated from fresh tissues using nitrogen cavitation and differential centrifugation, as previously described.19 All procedures were performed on ice throughout the protocol. Mice were sacrificed; and the livers, brain, skeletal muscle, and brown fat were rapidly removed. After washing with cold PBS, the tissue was homogenized in the tube containing isolation buffer (250 mmol/L sucrose, 1 mmol/L EDTA, and 30 mmol/L Tris-HCL, pH 7.8), which was approximately five times the volume of tissue. The resultant suspension was placed inside the nitrogen cell bomb (model 4639; Parr Instrument Company, Moline, IL), which was precooled to 4°C and placed under a pressure of 350 psi for 5 minutes. Then, mitochondria were isolated by differential centrifugation. Briefly, the homogenate was first spun at 1500 × g for 30 seconds at 4°C to remove nuclei. The resulting supernatant was transferred to a new microcentrifuge tube and centrifuged at 12,000 × g for 10 minutes. The resultant supernatant (cytosolic extracts) and the pellet (mitochondrial extracts) were stored at −80°C until further use. The isolated mitochondrial extracts were used for hOGG1 activity assays; Western blots using antibodies against hOGG1, β-actin, and cytochrome c; and mtDNA deletion experiments. The cytosolic extracts were used for Western blots using antibodies against hOGG1, β-actin, and cytochrome c. Liver tissues from hOGG1 TG and normal control mice were homogenized, followed by incubation for 20 minutes on ice in lysis buffer containing 50 mmol/L Tris-HCl, pH 7.5; 150 mmol/L NaCl; 0.5% Triton X-100; 1 μg/mL aprotinin; and 100 μg/mL phenylmethylsulfonyl fluoride. Afterward, samples were centrifuged at 13,000 rpm for 10 minutes at 4°C. The resultant supernatants were collected as total soluble protein for Western blots using antibodies against hOGG1, β-actin, and cytochrome c.
Expression of hOGG1 Protein
The mitochondrial and cytosolic extracts from the liver of the mMT-hOGG1 TG and control mice were incubated for 20 minutes on ice in lysis buffer containing 50 mmol/L Tris-HCl, pH 7.5; 150 mmol/L NaCl; 0.5% Triton X-100; 1 μg/mL aprotinin; and 100 μg/mL phenylmethylsulfonyl fluoride. Afterward, samples were centrifuged at 13,000 rpm for 10 minutes at 4°C. The resultant supernatants were collected as total soluble mitochondrial and cytosolic protein. A total of 30 μg of mitochondrial, cytosolic, and whole cell protein extracts and Jurkat whole cell lysate containing purified hOGG1 protein (Novus Biologicals Inc., Littleton, CO) were used for Western blot analyses using primary rabbit anti-hOGG1 polyclonal antibody (1:1000) (provided by Dr. Sankar Miltra, University of Texas Medical Branch, Galveston, Texas) for the detection of hOGG1 protein. A mouse anti-actin monoclonal antibody (1:2000) (Sigma-Aldrich Corp, St Louis, MO) and a mouse anti–cytochrome c monoclonal antibody (1:2000) (BD Biosciences, San Diego, CA) were used as internal controls. The Western membranes that reacted with primary antibodies were then incubated with either goat anti-rabbit or goat anti-mouse horseradish peroxidase–conjugated IgG antibodies (1:2000 dilution in blocking buffer) (Sigma-Aldrich Corp), followed by incubation with detection reagent (SuperSignal West Pico Chemiluminescent Substrate System; Pierce Biotechnology Inc., Rockford, IL) and exposure to X-ray films.
Oligonucleotide Incision Assay
The activity of hOGG1 in mitochondrial lysates was determined by excising 8-oxoG from a 32P-labeled oligonucleotide substrate, as previously described.20 Radioactivity in the cleaved DNA bands was measured with an imaging system (PhosphorImager) and computer software (IMAGEQUANT; Molecular Dynamics, Sunnyvale, CA). Preliminary enzyme activity assays were conducted to ensure linearity of product formation with respect to both time of incubation and amount of extract.20 The excision reactions (in 20 μL) were performed in 40 mmol/L HEPES-KOH (pH 7.6), 5 mmol/L EDTA, 1 mmol/L dithiothreitol, 75 mmol/L KCl, and 10% glycerol buffer containing 0.2 pmol of 32P-labeled duplex oligonucleotide (51-mer containing 8-oxoG: 5′-GCTTAGCTTGGAATCGTATCATGTA8-oxoGACTCGTGTGCCGTGTAGACCGTGCC-3′).
Quantitative Analysis of mtDNA Copy Number
Male hOGG1 TG and control mice, aged 1 year, were used in the studies. The mtDNA content was determined by comparing the ratio of mtDNA copy number/nuclear DNA copy number by real-time quantitative PCR, as previously described.21,22 A 217-bp mtDNA fragment within the NADH-ubiquinone oxidoreductase subunit 1 (ND1) gene was selected for detection of mtDNA. The sequences of PCR primers and fluorogenic probe for this ND1 region were as follows: 5′-ATTACTTCTGCCAGCCTGAC-3′ (forward), 5′-GGGTCCTAGGAAGATAATAGTTG-3′ (reverse), and 6-FAM-5′-CAACCCTAGCAGAAACAAACCGGGC-3′-TAMRA-Q (probe). For comparison, a 290-bp fragment of nuclear gene, mMT1, was also selected. The sequences of primers and fluorogenic probe for mMT1 were as follows: 5′-TCCAGGAAAGGAGAAGCTGA-3′ (forward), 5′-TCCAGCCCACGCATAGT-3′ (reverse), and 6-FAM-5′-CACGCTGCGAATGGGTTTACGGAGA-3′-TAMRA-Q (probe).
To prepare calibrators, the PCR products of these two genes were separately cloned into a plasmid vector using a cloning reagent set (TOPO TA; Invitrogen Corp), according to the manufacturer's protocol, and verified by DNA sequencing. The DNA of the two constructed vectors was then purified using a kit (QIAGEN Plasmid Midi Kit; QIAGEN Inc., Valencia, CA) and quantified using a different kit (Fluoreporter Blue Fluorometric dsDNA Quantitation Kit; Invitrogen Corp and Molecular Probes Inc., Eugene, OR). Standard curves from 10-fold serial dilutions of plasmids containing cloned ND1 and the mMT1 gene with calculated copy numbers for each gene were generated according to the manufacturer's manual (Applied Biosystems, Foster City, CA). Calibrators from the ND1 vector contained 25 to 250,000,000 ND1 copies/5 μL, whereas calibrators from the mMT1 vector contained 5 to 50,000,000 mMT1 copies/5 μL.
The quantification assay was performed in a total volume of 20 μL containing 2 μL of DNA template (10 ng/μL), 10 μL of ×2 mix (Taqman Universal PCR Master Mix; Applied Biosystems), and 1 μL each of the primer and probe. Amplification and detection were performed (ABI PRISM 7700 Sequence Detector; Applied Biosystems) under the following conditions: 1 cycle of 2 minutes at 50°C and 10 minutes at 95°C, followed by 40 cycles of 15 seconds at 95°C and 1 minute at 60°C. The relative mtDNA copy number (ND1/mMT1) was calculated from quantified data. The exact mtDNA copy number per cell was obtained by multiplying the mtDNA/nuclear DNA ratio by two (because there are two nuclear DNA copies present in each cell). A t-test was used to analyze the differences in mtDNA copy number from tissues of wild-type and hOGG1 TG mice.
Detection of mtDNA Deletions
DNA was extracted from mitochondrial extracts from liver, brain, skeletal muscle, and brown fat tissues of both hOGG1 TG and wild-type control mice and subjected to PCR detection of mtDNA deletions using three primer sets that flank the break points of known mtDNA deletions in mice (3729, 12,622, and 15,139 bp), according to the method previously described.23 The 3729-bp deletion was previously identified in aged mice,23 whereas the 12,622- and 15,139-bp deletions were newly identified in our laboratory in the mtDNA from hOGG1 TG mice (data not shown). The primer sequences for mtDNA deletions are as follows: for the 3729-bp deletion, 5′-GCATTCTGACTCCCCCAAAT-3′ [9519-9538 (forward)] and 5′-GAGGTGGATTTTGGGATGGT-3′ [13,441-13,422 (reverse)]; for the 12,622-bp deletion, 5′-GCAATCCAGGTCGGTTTCTA-3′ [2524-2543 (forward)] and 5′-GAATACCAGCTTTGGGTGCT-3′ [15,404-15,385 (reverse)]; for the 15,139-bp deletion, 5′-AAGGCATGAAAGGACAGCAC-3′ [15,954-15,973 (forward)] and 5′-TGAGCGTAGAATGGCGTATG-3′ [14,993-14,974 (reverse)].
For detection of intact mtDNA that corresponds to any given mtDNA deletion, we used the same forward primer for the mtDNA deletion in combination with a new reverse primer designed within the deleted mtDNA sequence. The reverse primer sequences for intact mtDNA are as follows: for the 3729-bp deletion, 5′-GGTTGAAGAAGGTAGATGGCA-3′ [9898-9878 (reverse)]; for the 12,622-bp deletion, 5′-TGCCGTATGGACCAACAATG-3′ [2883-2864 (reverse)]; for the 15,139-bp deletion, 5′-ATAAGGCCAGGACCAAACCT-3′ [91-72 (reverse)]. The designations of nucleotide positions to the primers, deletion break points, and short direct repeats for mtDNA deletions were based on the published complete mouse mtDNA genome (National Center for Biotechnology Information accession No. NC_005089).
Tissue H2O2 Measurement
The H2O2 produced by mouse liver and kidney tissues was measured by a colorimetric method, as previously described, with a few alterations.24 Wild-type and hOGG1 TG mice at the age of 11 months were selected for this assay (n = 5 each). Approximately 10 mg of liver and kidney tissues from these mice was homogenized in 1 mL of lysis buffer (0.2 mol/L Tris-HCl, pH 8.0; 0.1 mol/L EDTA; two percent SDS; and 20 mmol/L NaN3). Tissue homogenate, 10 μL, was then incubated with 1 mL of phenol red solution (0.1 g/L phenol red and 50 μg/mL horseradish peroxidase type II in PBS buffer) for 5 minutes at room temperature, followed by the addition of 10 μL of 1 N NaOH to stop the reaction. The samples were read at 610 nm in a spectrophotometer against a blank of 1 mL of phenol red solution and 10 μL of 1 N NaOH. Standard curves were made using the same batch of phenol red solution and H2O2 solutions to result in final concentrations of H2O2 of 1, 2, 4, 6, 8, 10, 20, 40, and 60 μmol/L. The protein concentrations were determined by the Bradford assay (Bio-Rad Laboratories Inc., Hercules, CA). The results were expressed as nmol H2O2/mg protein per length of incubation (5 minutes).
Total Body Fat Content Determination
Total body fat content was measured using a dual-energy X-ray absorptiometry scanner (PIXImus; Lunar Corp, Madison, WI). A total of 18 male mice (four TG and five control mice, aged 3 months; five TG and four control mice, aged 1 to 1.5 years) were analyzed. Data from the dual-energy X-ray absorptiometry scans were analyzed using software (Lunar, version 1.3 z; Lunar Corp).
Plasma Glucose Measurements
Plasma glucose concentration was measured by a glucose oxidase assay using a Beckman glucose analyzer that measures the rate of oxygen depletion from an oxygen-saturated solution of glucose oxidase. All measurements were performed in triplicate (as mg/dL).
Pair-Feeding Experiments
Three male and three female mice of each type (mMT-hOGG1 TG and wild type; aged 5 months; weight, 25 to 50 g) were used. Before performing a standard pair-feeding procedure, all mice were allowed ad libitum access to pelleted mouse chow for 4 weeks (designated as the pre–pair-feed stage). At the end of the pre–pair-feed stage, a pair-feeding experiment (pair-feed stage; 4 weeks) was conducted, as previously described.25 The wild-type control mice were fed ad libitum, receiving an amount of food largely in excess of daily consumption; TG mice were given the average amount of food consumed by the control mice on the previous day. At the end of the pair-feed stage, all mice (TG and wild-type control) were allowed ad libitum access to food (post–pair-feed stage; 2 weeks). For all three stages, food intake was monitored daily and body weight was measured every other day.
Real-Time RT-PCR Analysis of Gene Expression
Quantitative mRNA expression of hOGG1, mOGG1, and mtND1 genes and genes involved in the leptin signaling pathway, adaptive thermogenesis, and fatty acid metabolism in the TG mice was measured by real-time RT-PCR with the reagents supplied by Applied Biosystems. Total RNA samples from various tissues of TG mice and control mice were isolated and converted into cDNA by a kit (TaqMan Reverse Transcription Reagents Kit; Applied Biosystems) using random primers according to the manufacturer's recommendations. The PCR amplifications were performed in a plate (ABI PRISM 96-Well Optical Reaction Plate with Barcode; Applied Biosystems) on a system (ABI PRISM 7700 Sequence Detection System; Applied Biosystems). The total reaction volume of 20 μL contained 20 ng of cDNA template, 10 μL of ×2 mix (Taqman Universal PCR Master Mix, with AmpErase UNG), and 1 μL of gene products (Assays-on-Demand Gene Expression Products, ×20 Target Assay Mix or ×20 Endogenous Control Assay Mix, containing sequence-specific primers and the 6-FAM dye-labeled TaqMan MGB probe). The mouse β-actin gene was used as the endogenous control. The comparative Ct method was used to determine relative quantification. The amplification amount of all target genes was normalized against that of mouse β-actin.
Statistical Analyses
Mean ± SE values for H2O2 production, fat content, body weight, food intake, and gene expression were summarized separately for the TG and control mice. Student's two-sample t-tests were used to compare the groups with respect to these values. For cases in which group variances were significantly different, a Welch-Satterthwait t-test was used. An α level of five percent was used to determine the statistical significance of each test, and no adjustments for multiple comparisons were made.
Results
Overexpression of the mMT-hOGG1 Transgene
Eleven founder mMT-hOGG1 TG mice were identified among 31 mice generated by pronuclear microinjection of fertilized eggs from B6SJLF1 hybrid mice with the 5-kb fragment (Figure 1A) containing the mMT1 gene promoter and a full-length hOGG1 (mitochondrial isoform type 2a) cDNA.26 Transgene integration was confirmed by PCR (Figure 1B). Transgenic mice derived from the breeding of three lines (ie, 7732, 7776, and 7739) were used to obtain the reported data. Among these three founders, one was female (7732), which produced two generations of offspring. Two were males (7776 and 7739) were males, which produced four generations of offspring. For each litter of mice born to a positive TG mouse, we performed PCR identification to the transgene. The transgene was transmitted stably and faithfully at an expected rate of 50% in all founder mice from generation to generation. Only the PCR-positive offspring were used in the following experiments. The remaining eight TG founder mice were all female and were not able to reproduce. Most of these female founder TG mice developed the obesity phenotype and were sacrificed when they became sick at ages raging from 1 to 1.5 years.
The RT-PCR revealed that TG mice expressed high levels of hOGG1 mRNA, with wild-type littermates showing no evidence of transgene expression (Figure 1C). Quantitative real-time RT-PCR was performed to determine mRNA levels of both hOGG1 transgene and endogenous mOGG1 in various organs and tissues (Table 1). The expression of mOGG1 was similar in parallel organs from TG and wild-type control mice. High levels of hOGG1 transgene mRNA were detected only in the TG mice.
Table 1.
Expression of mOGG1 and hOGG1 in TG and Control Mice
| Organ or tissue | TG mice |
Wild-type mice |
||
|---|---|---|---|---|
| mOGG1 | hOGG1 | mOGG1 | hOGG1 | |
| Liver | 0.41 | 227 | 0.7 | ND |
| Kidney | 0.7 | 42 | 1.1 | ND |
| Heart | 1.69 | 136 | 1.55 | ND |
| Spleen | 0.24 | 1.4 | 0.11 | ND |
| Lung | 0.36 | 12 | 0.38 | ND |
| Brain | 1.82 | 22 | 1.0 | ND |
| Bone marrow | 0.2 | 31 | 0.22 | ND |
| Brown fat | 2.6 | 110 | 3.6 | ND |
| White fat | 0.53 | 4 | 0.9 | ND |
| Skeletal muscle | 2.65 | 347 | 1.82 | ND |
| Stomach | 0.21 | 21 | 0.13 | ND |
| Small intestine | 0.07 | 10 | 0.07 | ND |
| Colon | 0.3 | 7 | 0.13 | ND |
| Testis | 1.22 | 2.8 | 1.53 | ND |
The mRNA levels were normalized against endogenous mouse β-actin and expressed as the mean value from two mMT-hOGG1 TG mice and two wild-type control mice; all mice were male, aged 11 months, and derived from the same TG founder.
ND, not detectable.
Western blot analyses demonstrated that the hOGG1 protein was more abundant in the mitochondrial extract in the liver from mMT-hOGG1 TG mice than from wild-type control (Figure 1D). In contrast, the hOGG1 protein was similar in the cytosolic and whole cell extracts in the liver between mMT-hOGG1 TG mice and wild-type control (Figure 1D). The absence of β-actin and cytochrome c in the mitochondrial and cytosolic extracts, respectively, confirmed the purity of these preparations (Figure 1D). All three proteins (ie, hOGG1, β-actin, and cytochrome c) were abundantly expressed in Jurkat whole cell lysate (containing enriched hOGG1 protein) and in liver whole cell extracts, as expected. The OGG1 activity in the mitochondria was determined by oligonucleotide incision assays (Figure 1E). The relative mitochondrial OGG1 activities in the livers and brains from hOGG1 TG mice were 1.4 ± 0.22-fold and 1.3 ± 0.12-fold as much as those from wild-type control mice, respectively (Figure 1F). The differences in the mitochondrial OGG1 activity were statistically significant in both liver (P = 0.038) and brain (P = 0.014) between mMT-hOGG1 TG and wild-type control mice (Figure 1F). Four individual samples of liver and brain were used in the OGG1 activity assays. For skeletal muscle and brown fat, we pooled four tissue samples together for the preparation of mitochondrial extracts and OGG1 enzyme assays because the mitochondrial extracts from each individual sample of these two organs did not yield enough proteins for the enzyme assays. Therefore, we were only able to obtain the average relative OGG1 activity in the skeletal muscle and brown fat from mMT-hOGG1 TG mice compared with that from wild-type control mice. The average relative mitochondrial OGG1 activities in the skeletal muscle and brown fat of mMT-hOGG1 TG mice were 1.5- and 1.7-fold as much as those from the wild-type control mice, respectively.
Increased mtDNA Damage in TG Mice
We characterized mtDNA damage in mMT-hOGG1 TG mice by measuring mtDNA copy number per cell and assessing major mtDNA deletions. In the liver, kidney, brain, and skeletal muscle from hOGG1 TG mice, mtDNA copy numbers per cell were 83%, 58%, 59%, and 82%, respectively, of those for the corresponding organs from wild-type control mice (Figure 2A).
Figure 2.
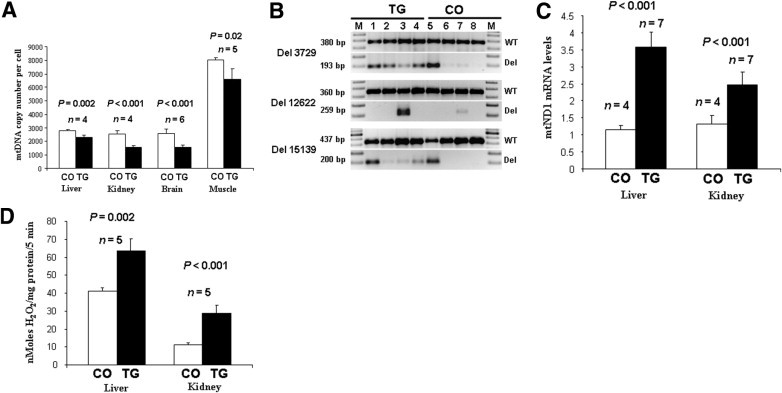
Increased mtDNA damage, mitochondrial (M) respiration function, and intracellular free radical production in mMT-hOGG1 TG mice. A: Decreased mtDNA copy numbers in the liver, kidney, brain, and skeletal muscle from mMT-hOGG1 TG mice compared with those from wild-type control mice (CO). The bars indicate the mean ± SE (n = 4 for liver and kidney; n = 5 for skeletal muscle; n = 6 for brain). B: Increased mtDNA deletions in hOGG1 TG mice compared with those in CO. The mtDNA deletions (Del) (3729, 12,622, and 15,139 bp) and corresponding wild-type (WT) mtDNA were analyzed in liver (lanes 1 and 5), brain (lanes 2 and 6), skeletal muscle (lanes 3 and 7), and brown fat (lanes 4 and 8) tissues from hOGG1 TG (lanes 1 to 4) and WT (lanes 5 to 8) control mice. C: Increased mitochondrial ND1 mRNA, indicating increased mitochondrial respiratory function, in liver and kidney tissues from hOGG1 TG mice compared with those from CO. The bars indicate the mean ± SE (n = 4 for control mice; n = 7 for TG mice). D: Increased production of H2O2 in liver and kidney tissues of mMT-hOGG1 TG mice compared with that of CO. The bars indicate the mean ± SE (n = 5).
To detect mtDNA deletions, we used primers flanking the break points of known deletions in mouse mtDNA (3729, 12,622, and 15,139 bp). The mtDNA deletions at 3729 and 15,139 bp were more abundant in all organs (with the exception of the liver) from hOGG1 TG mice than in those from wild-type control mice (Figure 2B). The 12,622-bp deletion was detected only in skeletal muscle but was much more abundant in mMT-hOGG1 TG than in wild-type control mice (Figure 2B). The 3729- and 15,139-bp deletions in the liver from wild-type control mice were surprising (Figure 2B, lane 5). When adjusted to the amount of internal controls (380- and 437-bp PCR products representing wild-type mtDNA), the amount of 3729-bp (193-bp PCR product) and 15,139-bp (200-bp PCR product) deletions seen in the liver is similar between the TG and control mice (Figure 2B, lanes 1 and 5). The liver is the most metabolically active organ that is involved in metabolizing and detoxifying a wild range of biological and foreign products. Therefore, this organ may have a higher degree of oxidative stress than that of other tissues/organs, resulting in more mtDNA damages. The detection of two types of mtDNA deletions in the control mouse liver may reflect the metabolic difference between liver and other organs.
Increased Mitochondrial ND1 Gene Expression in TG Mice
We used mitochondrial NADH dehydrogenase 1 (ND1) gene expression as an indirect measure of mitochondrial respiratory function. The ND1 mRNA levels in the liver and kidney of mMT-hOGG1 TG mice were 3.5- and 2-fold higher, respectively, than those in the corresponding organs of wild-type control mice (Figure 2C). The differences were statistically significant (P < 0.05). Previously, stable integration and overexpression of the same mMT-hOGG1 gene in cultured human hepatoma cells significantly enhanced mitochondrial oxygen consumption, mitochondrial membrane potential, and mtDNA damage in these cells.18 Thus, the increase in mitochondrial ND1 gene expression in mMT-hOGG1 TG mice suggests that the mitochondrial respiration in these mMT-hOGG1 TG mice may also increase.
Increased Intracellular Free Radicals in TG Mice
Whole cell extracts from the liver and kidney of mMT-hOGG1 TG and wild-type control mice were analyzed for H2O2 content. The amounts of H2O2 produced in the liver and kidney of mMT-hOGG1 TG mice were approximately 50% and 150% higher, respectively, than those in the corresponding organs from wild-type control mice (Figure 2D). The differences were statistically significant (P < 0.001).
Obesity, Hepatosteatosis, and Hyperglycemia in TG Mice
Before the age of 3 months, mMT-hOGG1 TG and wild-type control mice of either sex did not significantly differ in body weight (P = 0.07 and P = 0.8 at the ages of 1 and 2 months, respectively; Figure 3A). However, at 3 months, the female hOGG1 TG mice were 31.3% heavier (P < 0.001, Figure 3A) and the male mice were 19.6% heavier (P = 0.005, Figure 3A) than the controls. At 1 year, the female TG mice were 58.1% heavier (P < 0.003, Figure 3A) and the male mice were 43.1% heavier (P < 0.001, Figure 3A) than the controls. A representative photograph of the mMT-hOGG1 TG and the wild-type control mice at the age of 1 year appears in Figure 3B. Adipocytes from abdominal fat pads of mMT-hOGG1 TG mice were significantly larger than those from wild-type control mice (Figure 3C).
Figure 3.
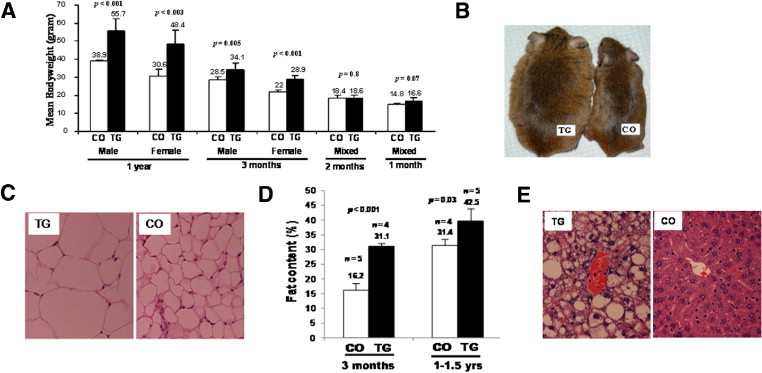
The mMT-hOGG1 TG mice developed obesity and hepatosteatosis. A: Changes in body weights of both sexes of mMT-hOGG1 TG and wild-type control mice (CO). The bars indicate the mean ± SE (n = 6 mice). For mice aged 1 and 2 months, six TG and CO included both males (n = 3) and females (n = 3) (mixed) because there was no difference in body weight between the sexes at these ages. B: Spontaneous obesity in an mMT-hOGG1 TG mouse (weight, 63 g) compared with CO (weight, 34 g), photographed at the age of 1 year. C: Increased volume of lipocytes in an abdominal fat pad from an mMT-hOGG1 TG mouse compared with that from CO (×400 magnification). D: Increased total fat content in mMT-hOGG1 TG mice compared with CO at the ages of 3 months and 1 to 1.5 years. Total fat content was measured by dual-energy X-ray absorptiometry. Scale bars indicate the mean ± SE (n = 4 to 5 mice). E: Marked hepatosteatosis in the liver from an mMT-hOGG1 TG mouse compared with that from CO (×400 magnification).
At the age of 3 months, the mean total body fat content, measured by dual-energy X-ray absorptiometry, was 31.3% for mMT-hOGG1 TG and 16.2% for wild-type control mice (P < 0.001, Figure 3D). At the age of 1 to 1.5 years, the mean total body fat content was 42.5% for hOGG1 TG and 31.4% for wild-type control mice (P = 0.03, Figure 3D).
Hepatosteatosis progressed with age and became prominent in all TG mice at the age of 6 months. Figure 3E shows diffuse and marked fat accumulation in the liver of mMT-hOGG1 TG mice compared with that of wild-type control mice. The mean liver weight at the age of 1 year was 3.6 g for mMT-hOGG1 TG mice (n = 3) and 1.2 g for wild-type control mice (n = 3) (P < 0.001).
At the age of 1 year, five male mMT-hOGG1 TG mice from two independent lines (mean body weight, 57 g) showed markedly elevated plasma glucose levels after a 4-hour fast (ie, 129, 158, 198, 231, and 222 mg/dL; mean, 187 mg/dL). In contrast, five age- and sex-matched control mice (mean body weight, 35 g) had plasma glucose levels of 132, 97, 135, 123, and 109 mg/dL (mean, 119 mg/dL). The difference in fasting glucose between mMT-hOGG1 TG and control mice was statistically significant (P = 0.01).
Increased Food Intake in TG Mice
When both mMT-hOGG1 TG and wild-type control mice were allowed ad libitum access to pelleted mouse chow (pre–pair-feed stage; 4 weeks), male and female TG mice consumed 14.5% and 23.6% more, respectively, than did control mice. Among the TG mice, males were 39.4% heavier and females were 24.6% heavier than control mice at the end of the pre–pair-feed stage (Figure 4). Differences in food intake and body weight between TG and control mice were statistically significant (Figure 4, P < 0.05).
Figure 4.
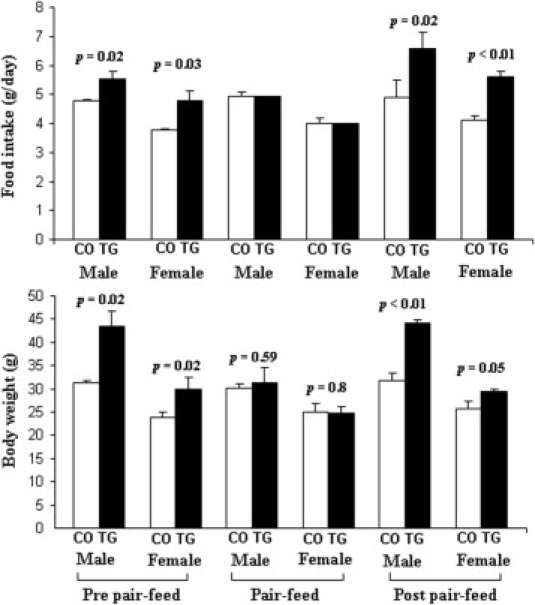
Food intake and body weight at pre–pair-feed, pair-feed, and post–pair-feed stages for both sexes of mMT-hOGG1 TG mice compared with those for wild-type control mice (CO) at the age of 5 months. Scale bars indicate the mean ± SE (n = 3 mice).
During the 4-week pair-feed stage, TG mice were allowed to eat only the average amount of food that their wild-type counterparts consumed the previous day. Transgenic mice gradually lost weight; at the end of the pair-feed stage, TG mice (males, 31.3 g; females, 24.7 g) weighed approximately the same as their control counterparts (males, 30 g; females, 25 g) (Figure 4).
After the pair-feed stage, both mMT-hOGG1 TG and wild-type control mice were allowed ad libitum access to food (post–pair-feed stage; 2 weeks). Male TG mice consumed 35.4% more and female TG mice consumed 36.5% more than did control mice. After 2 weeks, the male TG mice were 38.9% heavier and the female mice were 14.8% heavier than the control mice. The differences in food intake and body weight between TG and control mice were statistically significant (Figure 4, P < 0.05).
Aberrant Gene Expression Profiles in TG Mice
The leptin signaling pathway is critical in maintaining the balance between food (energy) intake and energy expenditure. We determined the expression of genes encoding leptin, leptin receptor, agouti-related peptide (AGRP), proopionomelanocortin (POMC), melanocortin-4 receptor (MC4R), and a leptin signaling inhibitor, suppressor of cytokine signaling 3. The levels of leptin mRNA were higher in white fat (P < 0.0001, Table 2), brown fat (P = 0.002, Table 2), and hypothalamus (P < 0.001, Table 2) from mMT-hOGG1 TG mice than in corresponding tissues of wild-type control mice. Comparing levels of leptin receptor with suppressor of cytokine signaling 3 mRNA in hypothalamus and white adipose tissue revealed no differences between mMT-hOGG1 TG and wild-type control mice (P > 0.05, Table 2). The mRNA expression levels of POMC in the hypothalamus of mMT-hOGG1 TG mice were much lower than those in control mice (P < 0.001, Table 2), whereas the mRNA expression levels of AGRP in the hypothalamus of mMT-hOGG1 TG mice were much higher than those in control mice (P < 0.001, Table 2). The expression of MC4R in the hypothalamus was similar between the TG and wild-type mice (P = 0.3, Table 2).
Table 2.
Expression of Genes Involved in the Leptin Signaling Pathway, Adaptive Thermogenesis, and Fatty Acid Metabolism in TG and Control Mice
| Tissue | Genes | TG mice | Wild-type mice | P value |
|---|---|---|---|---|
| Liver | AMPK | 1.12 ± 0.23 (n = 6) | 1.98 ± 0.23 (n = 4) | <0.0001 |
| CPT1 | 1.14 ± 0.19 (n = 6) | 2.26 ± 0.26 (n = 4) | 0.0005 | |
| ACCβ | 1.84 ± 0.18 (n = 6) | 1.0 ± 0.08 (n = 4) | <0.0001 | |
| Kidney | AMPK | 1.0 ± 0.17 (n = 3) | 1.34 ± 0.24 (n = 4) | 0.087 |
| CPT1 | 0.94 ± 0.1 (n = 4) | 1.35 ± 0.24 (n = 4) | 0.025 | |
| ACCβ | 1.6 ± 0.23 (n = 4) | 1.07 ± 0.16 (n = 4) | 0.01 | |
| Brown fat | Leptin | 2.57 ± 0.41 (n = 6) | 0.92 ± 0.15 (n = 4) | 0.002 |
| UCP1 | 0.64 ± 0.09 (n = 4) | 3.0 ± 0.15 (n = 3) | <0.0001 | |
| UCP2 | 1.0 ± 0.21 (n = 4) | 11.0 ± 2.18 (n = 3) | 0.014 | |
| AMPK | 0.27 ± 0.03 (n = 5) | 0.43 ± 0.06 (n = 4) | 0.0034 | |
| White fat | Leptin | 3.75 ± 0.47 (n = 5) | 1.07 ± 0.24 (n = 5) | <0.001 |
| Lepr-b | 1.1 ± 0.29 (n = 4) | 1.14 ± 0.15 (n = 4) | NS | |
| SOCS-3 | 0.95 ± 0.11 (n = 4) | 0.98 ± 0.33 (n = 4) | NS | |
| Hypothalamus | Lepr-b | 1.01 ± 0.23 (n = 4) | 1.03 ± 0.18 (n = 4) | NS |
| SOCS-3 | 1.24 ± 0.29 (n = 4) | 0.91 ± 0.17 (n = 4) | NS | |
| AGRP | 1.96 ± 0.28 (n = 4) | 1.29 ± 0.18 (n = 4) | <0.001 | |
| POMC | 0.5 ± 0.09 (n = 4) | 0.74 ± 11 (n = 4) | <0.001 | |
| Leptin | 3.99 ± 1.4 (n = 4) | 0.57 ± 21 (n = 4) | <0.001 | |
| MC4R | 1.0 ± 0.29 (n = 4) | 1.1 ± 0.26 (n = 4) | NS | |
| Skeletal muscle | AMPK | 1.05 ± 0.22 (n = 5) | 1.86 ± 0.13 (n = 4) | 0.001 |
| CPT1 | 1.35 ± 0.22 (n = 3) | 3.63 ± 0.46 (n = 3) | 0.001 | |
| UCP2 | 2.0 ± 0.27 (n = 3) | 2.1 ± 0.50 (n = 3) | NS | |
| UCP3 | 1.66 ± 0.47 (n = 3) | 4.11 ± 1.7 (n = 5) | 0.034 |
The mRNA levels were normalized against endogenous mouse β-actin and expressed as the mean ± SE (n = 3 to 6 mice); all mice were male, aged 11 months, and from the same TG founder.
ACC, acetyl CoA carboxylase; Lepr-b, leptin receptor; NS, statistically not significant (P > 0.05); SOCS, suppressor of cytokine signaling.
The expression of genes involved in adaptive thermogenesis, such as uncoupling proteins 1, 2, and 3 (UCP1, UCP2, and UCP3, respectively), was significantly lower in brown fat (UCP1 and UCP2) and in skeletal muscle (UCP3) of mMT-hOGG1 TG mice than in those tissues of wild-type controls (Table 2).
The AMP-activated protein kinase (AMPK) plays an important role in mobilizing fatty acids for oxidation, and carnitine palmitoyl transferase-1 (CPT1) functions in transporting fatty acids into mitochondria for further oxidation. Compared with wild-type controls, hOGG1 TG mice had significantly lower AMPK expression in brown fat, skeletal muscle, and liver and significantly lower CPT1 expression in skeletal muscle, liver, and kidney (Table 2). The acetyl CoA carboxylase-β is primarily involved in lipogenesis, and its expression was significantly higher in liver and kidney tissues of mMT-hOGG1 TG mice than in controls (Table 2).
Other Phenotypes
In addition to the phenotypes previously described, we also observed female infertility, malignant lymphoma, and, rarely, hepatocellular carcinoma. Among 11 founder hOGG1 TG mice, 9 were female and 2 were male. Except for one female founder mouse, which had one litter and then stopped reproducing, the other eight female founder mice were unable to reproduce, when bred with wild-type males, for up to 1 year. In addition, all female TG offspring derived from all TG founder lines were not able to reproduce when bred with wild-type males for up to 1 year. We also found a high incidence of malignant lymphoma in hOGG1 TG mice. Among 15 TG mice of five independent lines (aged 1 to 1.5 years) that became moribund and were subsequently sacrificed, 13 had evidence of malignant lymphoma of B-cell origin. One TG mouse developed hepatocellular carcinoma. No tumors were seen in any control mice of similar ages.
Discussion
In multiple lines of mMT-hOGG1 TG mice, we found major biological abnormalities affecting the mitochondrial genome and its functions. Although we detected significantly increased mRNA levels (up to 100- to 300-fold) in various organs from mMT-hOGG1 TG mice (Table 1), we consistently found only a slight increase (approximately twofold) in OGG1 protein and enzyme activity in mMT-hOGG1 TG compared with control mice (Figure 1, D–F). It is plausible that overexpression of hOGG1 in the mitochondria is highly toxic and incompatible with life and that only the mice with a mild increase in exogenous hOGG1 protein were able to survive and were selected in our studies.
Recent findings indicate that hOGG1 type 2a, the isoform used in the generation of this TG mouse model, may lack glycosylase activity.27 However, we believe that the abnormal phenotypes seen in both our in vitro cell culture18 and in vivo TG mouse models are because of an increase in DNA glycosylase activity of the hOGG1 type 2a isoform based on our data and those published in the literature. i) In in vitro conditions, the hOGG1 type 2a mitochondrial isoform clearly possessed DNA glycosylase activity, according to Roldan-Arjona et al,26 but showed no such activity according to Hashiguchi et al.27 These opposite results may be, in part, explained by differences in experimental conditions. A much higher concentration of recombinant hOGG1 type 2a protein (1 μg, 20 pmol) was used in the assay in the study by Roldan-Arjona et al.26 ii) By using in vitro transfection of cultured cells with fluorescent-tagged full-length cDNA of various hOGG1 isoforms, the nuclear isoform type 1a was almost exclusively targeted to the nuclei,28–30 whereas the mitochondrial isoform type 2a was almost exclusively targeted to the mitochondria.28,30 The previous observations indicated that, in the mitochondria, the predominant hOGG1 protein is the mitochondrial isoform, hOGG1 type 2a. iii) Both nuclear (type 1a) and mitochondrial (type 2a) isoforms share the first 316 amino acids that contain a highly conserved aspartic acid motif (HhH-GPD), required for DNA glycosylase activity.27,28 iv) Some investigators12,13,31 have shown that DNA glycosylases (ie, hOGG1) targeted to mitochondria are beneficial, rather than detrimental, and protect cells against oxidative DNA damage and apoptosis. These results raised the possibility that mitochondrial hOGG1 protein may have other biological functions, such as regulation of apoptosis. However, all these studies used the same mammalian expression vector, in which the nuclear isoform of the hOGG1 gene (type 1a) is overexpressed in mitochondria, driven by a cytomegalovirus promoter containing a mitochondrial targeting sequence for the human manganese superoxide dismutase gene.12,13,31 Thus, the cellular protective roles of hOGG1 protein, targeted to mitochondria, may only be applied to the nuclear isoform (type 1a) because both in vitro cell culture18 and in vivo hOGG1 TG mouse models, reported herein, used the mitochondrial isoform (type 2a) and only revealed detrimental and cell-damaging effects.
Energy metabolism is regulated by peripheral signals that are integrated in the hypothalamus. Leptin is the most important peripheral signal, the prime functions of which are to decrease appetite and induce satiety. After being secreted by adipocytes, leptin circulates in the blood and crosses the blood-brain barrier to reach the hypothalamus, where it binds to leptin receptors and acts directly on two different populations of neurons with opposite actions on food intake. One population of neurons expresses anorexigenic (appetite-suppressing) protein, POMC; and the other expresses orexigenic (appetite-stimulating) protein, AGRP. Leptin, through its receptor, inhibits AGRP production while stimulating POMC production. The activation of POMC neurons by leptin can promote the release of another anorexigenic hormone, α-melanocyte stimulating hormone. The AGRP and α-melanocyte stimulating hormone compete for MC4R. Although AGRP binding suppresses MC4R activity to generate an orexigenic signal, α-melanocyte stimulating hormone binding stimulates MC4R activity to generate an anorexigenic signal.32
The hOGG1 TG mice consumed more food (hyperphagia) (Figure 4) and accumulated more fat in various tissues, resulting in increased body weight (Figure 3); however, they produced higher levels of leptin by the brown fat, white fat, and hypothalamus (Table 2). This apparent loss of leptin's ability to inhibit food intake is termed leptin resistance, commonly seen in human obesity. The development of leptin resistance may involve the following mechanisms: i) defects in the blood-brain barrier transport system, leading to the inability of peripheral leptin to reach the hypothalamus; ii) a decreased hypothalamic leptin receptor number or a mutated receptor in leptin-responsive neurons in the hypothalamus; or iii) impaired leptin signal transduction because of postreceptor resistance to leptin's effects on other neural networks.33
We observe that mRNA levels of leptin are significantly higher in both peripheral fat tissues and hypothalamus in mMT-hOGG1 TG mice (Table 2), indicating that the blood-brain barrier transport system for leptin is intact. The increased expression of AGRP and the decreased expression of POMC in the hypothalamus (Table 2) of mMT-hOGG1 TG mice are in accordance with increased food intake and obesity seen in these mMT-hOGG1 TG mice. Quantitatively, the levels of leptin receptor were similar in the hypothalamus between mMT-hOGG1 TG and control mice. Thus, we speculate that the blockage to the action of leptin in these mMT-hOGG1 TG mice may be caused by nonfunctional leptin receptors because of mutations and/or defects in the postreceptor leptin signal transduction pathway.
Total energy expenditure can be subdivided into three components: obligatory energy expenditure (ATP) for basal metabolism, energy expenditure (ATP) for physical activities, and expenditure attributed to adaptive thermogenesis (uncoupling activities), which is defined as heat production in response to environmental temperature or diet. Brown adipose tissue and skeletal muscle are two important thermogenic organs, with UCP1 in brown adipose tissue34 and UCP2 and UCP3 in skeletal muscle35,36 functioning as major mediators for adaptive thermogenesis. In mMT-hOGG1 TG mice, expression of UCP1 and UCP2 in brown fat and UCP3 in skeletal muscle was significantly decreased (Table 2), indicative of defects in adaptive thermogenesis in these TG mice. Mitochondria are also responsible for coupled respiration, linking oxidation of fatty acids and glucose to production of ATP. The rate-limiting enzyme in mitochondrial β-oxidation of fatty acids is CPT-1,37 which is inhibited by malonyl-CoA, produced by acetyl CoA carboxylase β.38 The AMPK is another important protein in the metabolic pathways of lipogenesis and can stimulate β-oxidation of fatty acids in skeletal muscle and liver and adipocyte lipogenesis.39 In mMT-hOGG1 TG mice, the expression of AMPK and CPT1 genes significantly decreased, whereas the expression of acetyl CoA carboxylase-β significantly increased, in the liver, kidney, and skeletal muscle (Table 2). These results indicate aberrant energy metabolism, characterized by increased lipogenesis and decreased fatty acid oxidation and ATP production in these obese TG mice.
Although profound metabolic abnormalities involving adaptive thermogenesis, lipogenesis, and fatty acid oxidation were detected in liver, fat, and skeletal muscle in mMT-hOGG1 TG mice, the aberrant changes in peripheral tissues appear to play much smaller roles than the defective leptin signaling pathway observed in the hypothalamus in contributing to the obesity phenotype seen in mMT-hOGG1 TG mice. Pair-feeding experiments indicated that increased food intake is the most dominant contributing factor behind the obesity phenotype because when these obese TG mice were limited to their access to food, the obesity phenotype was completely abolished. Although the mechanisms and exact sequence by which overexpressed hOGG1 protein induces leptin signaling blockage in the hypothalamus remain unknown and beyond the scope of the current investigation, we speculate that enhanced mtDNA damages and oxidative stress in the hypothalamus may contribute significantly to the defective leptin signaling pathway, resulting in hyperphagia and the eventual development of obesity. Metabolic abnormalities seen in peripheral tissues (tissues excluding the brain), while not considered important in the development of obesity, may contribute significantly to other adverse phenotypes seen in these TG mice, such as fatty liver, infertility, and malignancy.
In contrast to the severe phenotypes seen in mMT-hOGG1 TG mice, homozygous null mice deficient for the OGG1 gene showed only mild phenotypes. In these OGG1-mutant mice, there was defective removal of 8-oxoG in DNA, resulting in accumulation of 8-oxoG in. However, the OGG1-mutant mice exhibited only moderately elevated spontaneous mutation rates and did not show an increased tumor incidence and any identifiable pathological changes.40,41 In mtDNA isolated from the liver of these OGG1-mutant mice, the amount of 8-oxoG was 20-fold as much as that in the mtDNA from the liver of wild-type control mice.42 However, mitochondrial oxidative phosphorylation in liver and heart samples from these OGG1-mutant mice was not compromised. Thus, it appears that deletion of the OGG1 gene alone is not sufficient to create any noticeable phenotypic abnormalities, such as those related to malignancy, aging, and mitochondrial respiratory dysfunction.43 The lack of apparent phenotype in OGG1-/- mice may be explained, in part, by the fact that other DNA repair mechanisms may function as backup systems for OGG1 to minimize the effects of an increased load of 8-oxoG. The newly identified human DNA glycosylases of the Fpg family, hFPG1/hFPG2 (or NEIL1/NEIL3), may function as such a backup repair enzyme for hOGG1 in human cells.44–46
The fact that hOGG1 can create mutations during base excision repair is clearly demonstrated in a study47 that links OGG1 to the somatic mutations, in the form of a CAG repeat expansion, that are commonly seen in neurodegenerative Huntington's disease. In this study, age-dependent somatic mutations were remarkably dependent on the action of hOGG1; these researchers47 proposed an escalating oxidation-excision cycle in a “toxic oxidation model,” resulting in progressive age-dependent DNA mutations.
Human obesity is a medical problem caused by behavioral and environmental changes that are typically characterized by increased energy (food) intake and diminished physical activity.48 We speculate that the sustained imbalance between energy (food) intake and expenditure (physical activity) would gradually overwhelm the capacity of mitochondria for handling excess energy, leading to mitochondrial dysfunction with increased oxidative stress. Experimentally, both in vitro and in vivo studies49,50 indicate that increased oxidative stress is capable of inducing hOGG1, presumably as a cellular defense mechanism to counter the DNA-damaging effects of oxidative stress.
Similarly, hOGG1 is up-regulated in the islet β cells of the pancreas from patients with type 2 diabetes51 and in the nigrostriatal dopaminergic neurons from patients with Parkinson's disease.52 Both type 2 diabetes and Parkinson's disease are etiologically linked to mtDNA oxidative damage and oxidative stress.
In relation to the mechanism of human obesity, we propose that, similarly, mitochondrial hOGG1 may accumulate to a “toxic level” as a host response to oxidative stress; this increase in hOGG1 would, in turn, exacerbate oxidative mtDNA damage, oxidative stress, and an imbalance in energy metabolism, as previously described. If this is the case, then it could also be speculated that the susceptibility to obesity in humans may be affected by factors, such as single-nucleotide polymorphisms, that can affect catalytic activity or expression levels of the hOGG1 gene. Several single-nucleotide polymorphisms have been identified in the hOGG1 gene. Although some studies found that a Cys-to-Gly transversion at nucleotide 1245, with the substitution of Cys for Ser at codon 326 (Ser326Cys) in exon 7,53 resulted in decreased catalytic activity and impaired base excision repair,53,54 others found no such correlation between the Ser326Cys polymorphism and OGG1 catalytic activity.55 Therefore, Ser326 homozygotes may be more susceptible to the development of obesity than Cys326 homozygotes in some populations, in which OGG1 activity is affected by this polymorphism.
In summary, our results suggest that overexpression of hOGG1 in mitochondria escalates oxidative stress and mtDNA damage, presumably through enhanced oxidative DNA damage processing, resulting in metabolic syndrome, infertility, and malignant tumors. This hOGG1 TG mouse model may serve as a tool to study human obesity, in which the link between mitochondria, oxidative stress, and complex molecular events leading to obesity can be carefully dissected and therapeutically addressed.
Acknowledgments
We are grateful to Northwestern University Children's Memorial Transgenic Mouse Facility (Chicago, IL) for the generation of hOGG1 transgenic mice; and the Office of Grants and Scientific Publications (University of Arkansas for Medical Sciences, Little Rock, AK) for editing the manuscript.
Footnotes
Supported by a pilot grant from the South Central Veterans' Health Care Network (VISN16), NIH grants (CA100846 to M.H.; DK39176 to P.A.K.; P01AG10514 to B.S. and S.M.; CA53791 to S.M.), Cancer Research-UK (G.P.M.); and a merit review grant from the Department of Veterans' Affairs (C.-Y.F.).
H.Z. and C.-Y.F. designed and performed the experiments and wrote the manuscript; C.X., C.Z., G.R., M.W.C., Q.H., B.S., S.M., and A.J.W. performed the experiments; H.J.S. performed statistical analysis; M.H., G.R., P.A.K., Q.H., B.S., S.M., and G.P.M. provided scientific discussions; and M.H., B.S., and G.P.M. edited the manuscript.
References
- 1.Wallace D.C. Mitochondrial diseases in man and mouse. Science. 1999;283:1482–1488. doi: 10.1126/science.283.5407.1482. [DOI] [PubMed] [Google Scholar]
- 2.de Ferranti S., Mozaffarian D. The perfect storm: obesity, adipocyte dysfunction, and metabolic consequences [review] Clin Chem. 2008;54:945–955. doi: 10.1373/clinchem.2007.100156. [DOI] [PubMed] [Google Scholar]
- 3.Maassen J.A., 't Hart L.M., Ouwens D.M. Lessons that can be learned from patients with diabetogenic mutations in mitochondrial DNA: implications for common type 2 diabetes. Curr Opin Clin Nutr Metab Care. 2007;10:693–697. doi: 10.1097/MCO.0b013e3282f0b774. [DOI] [PubMed] [Google Scholar]
- 4.Fukui H., Moraes C.T. The mitochondrial impairment, oxidative stress and neurodegeneration connection: reality or just an attractive hypothesis [review]? Trends Neurosci. 2008;31:251–256. doi: 10.1016/j.tins.2008.02.008. [DOI] [PMC free article] [PubMed] [Google Scholar]
- 5.Cummins J.M., Jequier A.M., Kan R. Molecular biology of human male infertility: links with aging, mitochondrial genetics, and oxidative stress [review]? Mol Reprod Dev. 1994;37:345–362. doi: 10.1002/mrd.1080370314. [DOI] [PubMed] [Google Scholar]
- 6.Penta J.S., Johnson F.M., Wachsman J.T., Copeland W.C. Mitochondrial DNA in human malignancy. Mutation Res. 2001;488:119–133. doi: 10.1016/s1383-5742(01)00053-9. [DOI] [PubMed] [Google Scholar]
- 7.Pinti M., Salomoni P., Cossarizza A. Anti-HIV drugs and the mitochondria [review] Biochim Biophys Acta. 2006;1757:700–707. doi: 10.1016/j.bbabio.2006.05.001. [DOI] [PubMed] [Google Scholar]
- 8.Ingman M., Kaessmann H., Paabo S., Gyllensten U. Mitochondrial genome variation and the origin of modern humans. Nature. 2000;408:708–713. doi: 10.1038/35047064. [DOI] [PubMed] [Google Scholar]
- 9.Lindahl T., Karran P., Wood R.D. DNA excision repair pathways. Curr Opin Genet Dev. 1997;7:158–169. doi: 10.1016/s0959-437x(97)80124-4. [DOI] [PubMed] [Google Scholar]
- 10.Sancar A. Mechanisms of DNA excision repair. Science. 1994;266:1954–1956. doi: 10.1126/science.7801120. [DOI] [PubMed] [Google Scholar]
- 11.Grollman A.P., Moriya M. Mutagenesis by 8-oxoguanine: an enemy within. Trends Genet. 1993;9:246–249. doi: 10.1016/0168-9525(93)90089-z. [DOI] [PubMed] [Google Scholar]
- 12.Dobson A.W., Xu Y., Kelley M.R., LeDoux S.P., Wilson G.L. Enhanced mitochondrial DNA repair and cellular survival after oxidative stress by targeting the human 8-oxoguanine glycosylase repair enzyme to mitochondria. J Biol Chem. 2000;275:37518–37523. doi: 10.1074/jbc.M000831200. [DOI] [PubMed] [Google Scholar]
- 13.Rachek L.I., Grishko V.I., Musiyenko S.I., Kelley M.R., LeDoux S.P., Wilson G.L. Conditional targeting of the DNA repair enzyme hOGG1 into mitochondria. J Biol Chem. 2002;277:44932–44937. doi: 10.1074/jbc.M208770200. [DOI] [PubMed] [Google Scholar]
- 14.Kobune M., Xu Y., Baum C., Kelley M.R., Williams D.A. Retrovirus-mediated expression of the base excision repair proteins, formamidopyrimidine DNA glycosylase or human oxoguanine DNA glycosylase, protects hematopoietic cells from N,N′,N“-triethylenethiophosphoramide (thioTEPA)-induced toxicity in vitro and in vivo. Cancer Res. 2001;61:5116–5125. [PubMed] [Google Scholar]
- 15.Blaisdell J.O., Wallace S.S. Abortive base-excision repair of radiation-induced clustered DNA lesions in Escherichia coli. Proc Natl Acad Sci U S A. 2001;98:7426–7430. doi: 10.1073/pnas.131077798. [DOI] [PMC free article] [PubMed] [Google Scholar]
- 16.Radyuk S.N., Michalak K., Rebrin I., Sohal R.S., Orr W.C. Effects of ectopic expression of Drosophila DNA glycosylases dOgg1 and RpS3 in mitochondria. Free Radic Biol Med. 2006;41:757–764. doi: 10.1016/j.freeradbiomed.2006.05.021. [DOI] [PMC free article] [PubMed] [Google Scholar]
- 17.Yang N., Galick H., Wallace S.S. Attempted base excision repair of ionizing radiation damage in human lymphoblastoid cells produces lethal and mutagenic double strand breaks. DNA Repair. 2004;3:1323–1334. doi: 10.1016/j.dnarep.2004.04.014. [DOI] [PubMed] [Google Scholar]
- 18.Zhang H.H., Mizumachi T., Carcel-Trullols J., Li L., Naito A., Spencer H.J., Spring P., Smoller B.R., Watson A.J., Margison G.P., Higuchi M., Fan C.Y. Targeting human 8-oxoguanine DNA glycosylase (hOGG1) to mitochondria enhances cisplatin cytotoxicity in hepatoma cells. Carcinogenesis. 2007;28:1629–1637. doi: 10.1093/carcin/bgm072. [DOI] [PubMed] [Google Scholar]
- 19.Kristián T., Hopkins I.B., McKenna M.C., Fiskum G. Isolation of mitochondria with high respiratory control from primary cultures of neurons and astrocytes using nitrogen cavitation. J Neurosci Methods. 2006;152:136–143. doi: 10.1016/j.jneumeth.2005.08.018. [DOI] [PMC free article] [PubMed] [Google Scholar]
- 20.Szczesny B., Hazra T.K., Papaconstantinou J., Mitra S., Boldogh I. Age-dependent deficiency in import of mitochondrial DNA glycosylases required for repair of oxidatively damaged bases. Proc Natl Acad Sci U S A. 2003;100:10670–10675. doi: 10.1073/pnas.1932854100. [DOI] [PMC free article] [PubMed] [Google Scholar]
- 21.Bogacka I., Xie H., Bray G.A., Smith S.R. Pioglitazone induces mitochondrial biogenesis in human subcutaneous adipose tissue in vivo. Diabetes. 2005;54:1392–1399. doi: 10.2337/diabetes.54.5.1392. [DOI] [PubMed] [Google Scholar]
- 22.He L., Chinnery P.F., Durham S.E., Blakely E.L., Wardell T.M., Borthwick G.M., Taylor R.W., Turnbull D.M. Detection and quantification of mitochondrial DNA deletions in individual cells by real-time PCR. Nucleic Acids Res. 2002;30:e68. doi: 10.1093/nar/gnf067. [DOI] [PMC free article] [PubMed] [Google Scholar]
- 23.Tanhauser S.M., Laipis P.J. Multiple deletions are detectable in mitochondrial DNA of aging mice. J Biol Chem. 1995;270:24769–24775. doi: 10.1074/jbc.270.42.24769. [DOI] [PubMed] [Google Scholar]
- 24.Pick E., Keisari Y. A simple colorimetric method for the measurement of hydrogen peroxide produced by cells in culture. J Immunol Methods. 1980;38:161–170. doi: 10.1016/0022-1759(80)90340-3. [DOI] [PubMed] [Google Scholar]
- 25.Conarello S.L., Li Z., Ronan J., Roy R.S., Zhu L., Jiang G., Liu F., Woods J., Zycband E., Moller D.E., Thornberry N.A., Zhang B.B. Mice lacking dipeptidyl peptidase IV are protected against obesity and insulin resistance. Proc Natl Acad Sci U S A. 2003;100:6825–6830. doi: 10.1073/pnas.0631828100. [DOI] [PMC free article] [PubMed] [Google Scholar]
- 26.Roldan-Arjona T., Wei Y.F., Carter K.C., Klungland A., Anselmino C., Wang R.P., Augustus M., Lindahl T. Molecular cloning and functional expression of a human cDNA encoding the antimutator enzyme 8-hydroxylguanine-DNA glycosylase. Proc Natl Acad Sci U S A. 1997;94:8016–8020. doi: 10.1073/pnas.94.15.8016. [DOI] [PMC free article] [PubMed] [Google Scholar]
- 27.Hashiguchi K., Stuart J.A., de Souza-Pinto N.C., Bohr V.A. The C-terminal alphaO helix of human Ogg1 is essential for 8-oxoguanine DNA glycosylase activity: the mitochondrial beta-Ogg1 lacks this domain and does not have glycosylase activity. Nucleic Acids Res. 2004;32:5596–5608. doi: 10.1093/nar/gkh863. [DOI] [PMC free article] [PubMed] [Google Scholar]
- 28.Nishioka K., Ohtsubo T., Oda H., Fujiwara T., Kang D., Sugimachi K., Nakabeppu Y. Expression and differential intracellular localization of two major forms of human 8-oxoguanine DNA glycosylase encoded by alternatively spliced OGG1 mRNAs. Mol Biol Cell. 1999;10:1637–1652. doi: 10.1091/mbc.10.5.1637. [DOI] [PMC free article] [PubMed] [Google Scholar]
- 29.Bjorâs M., Luna L., Johnsen B., Hoff E., Haug T., Rognes T., Seeberg E. Opposite base-dependent reactions of a human base excision repair enzyme on DNA containing 7,8-dihydro-8-oxoguanine and abasic sites. EMBO J. 1997;16:6314–6322. doi: 10.1093/emboj/16.20.6314. [DOI] [PMC free article] [PubMed] [Google Scholar]
- 30.Takao M., Aburatani H., Kobayashi K., Yasui A. Mitochondrial targeting of human DNA glycosylases for repair of oxidative DNA damage. Nucleic Acids Res. 1998;26:2917–2922. doi: 10.1093/nar/26.12.2917. [DOI] [PMC free article] [PubMed] [Google Scholar]
- 31.Panduri V., Liu G., Surapureddi S., Kondapalli J., Soberanes S., de Souza-Pinto N.C., Bohr V.A., Budinger G.R., Schumacker P.T., Weitzman S.A., Kamp D.W. Role of mitochondrial hOGG1 and aconitase in oxidant-induced lung epithelial cell apoptosis. Free Radic Biol Med. 2009;47:750–759. doi: 10.1016/j.freeradbiomed.2009.06.010. [DOI] [PMC free article] [PubMed] [Google Scholar]
- 32.Walley A.J., Asher J.E., Froguel P. The genetic contribution to non-syndromic human obesity. Nat Rev Genet. 2009;10:431–442. doi: 10.1038/nrg2594. [DOI] [PubMed] [Google Scholar]
- 33.El-Haschimi K., Lehnert H. Leptin resistance - or why leptin fails to work in obesity. Exp Clin Endocrinol Diabetes. 2003;111:2–7. doi: 10.1055/s-2003-37492. [DOI] [PubMed] [Google Scholar]
- 34.Klingenberg M., Huang S.G. Structure and function of the uncoupling protein from brown adipose tissue. Biochim Biophys Acta. 1999;1415:271–296. doi: 10.1016/s0005-2736(98)00232-6. [DOI] [PubMed] [Google Scholar]
- 35.Boss O., Samec S., Paoloni-Giacobino A., Rossier C., Dulloo A., Seydoux J., Muzzin P., Giacobino J.P. Uncoupling protein-3: a new member of the mitochondrial carrier family with tissue-specific expression. FEBS Lett. 1997;408:39–42. doi: 10.1016/s0014-5793(97)00384-0. [DOI] [PubMed] [Google Scholar]
- 36.Fleury C., Neverova M., Collins S., Raimbault S., Champigny O., Levi-Meyrueis C., Bouillaud F., Seldin M.F., Surwit R.S., Ricquier D., Warden C.H. Uncoupling protein-2: a novel gene linked to obesity and hyperinsulinemia. Nat Genet. 1997;15:269–272. doi: 10.1038/ng0397-269. [DOI] [PubMed] [Google Scholar]
- 37.McGarry J.D., Woeltje K.F., Kuwajima M., Foster D.W. Regulation of ketogenesis and the renaissance of carnitine palmitoyltransferase. Diabetes Metab Rev. 1989;5:271–284. doi: 10.1002/dmr.5610050305. [DOI] [PubMed] [Google Scholar]
- 38.McGarry J.D., Mannaerts G.P., Foster D.W. A possible role for malonyl-CoA in the regulation of hepatic fatty acid oxidation and ketogenesis. J Clin Invest. 1977;60:265–270. doi: 10.1172/JCI108764. [DOI] [PMC free article] [PubMed] [Google Scholar]
- 39.Browning J.D., Horton J.D. Molecular mediators of hepatic steatosis and liver injury. J Clin Invest. 2004;114:147–152. doi: 10.1172/JCI22422. [DOI] [PMC free article] [PubMed] [Google Scholar]
- 40.Klungland A., Rosewell I., Hollenbach S., Larsen E., Daly G., Epe B., Seeberg E., Lindahl T., Barnes D.E. Accumulation of premutagenic DNA lesions in mice defective in removal of oxidative base damage. Proc Natl Acad Sci U S A. 1999;96:13300–13305. doi: 10.1073/pnas.96.23.13300. [DOI] [PMC free article] [PubMed] [Google Scholar]
- 41.Minowa O., Arai T., Hirano M., Monden Y., Nakai S., Fukuda M., Itoh M., Takano H., Hippou Y., Aburatan H., Masumura K., Nohmi T., Nishimura S., Noda T. Mmh/Ogg1 gene inactivation results in accumulation of 8-hydroxyguanine in mice. Proc Natl Acad Sci U S A. 2000;97:4156–4161. doi: 10.1073/pnas.050404497. [DOI] [PMC free article] [PubMed] [Google Scholar]
- 42.de Souza-Pinto N.C., Eide L., Hogue B.A., Thybo T., Stevnsner T., Seeberg E., Klungland A., Bohr V.A. Repair of 8-oxodeoxyguanosine lesions in mitochondrial dna depends on the oxoguanine dna glycosylase (OGG1) gene and 8-oxoguanine accumulates in the mitochondrial dna of OGG1-defective mice. Cancer Res. 2001;61:5378–5381. [PubMed] [Google Scholar]
- 43.Stuart J.A., Bourque B.M., de Souza-Pinto N.C., Bohr V.A. No evidence of mitochondrial respiratory dysfunction in OGG1-null mice deficient in removal of 8-oxodeoxyguanine from mitochondrial DNA. Free Radic Biol Med. 2005;38:737–745. doi: 10.1016/j.freeradbiomed.2004.12.003. [DOI] [PubMed] [Google Scholar]
- 44.Morland I., Rolseth V., Luna L., Rognes T., Bjoras M., Seeberg E. Human DNA glycosylases of the bacterial Fpg/MutM superfamily: an alternative pathway for the repair of 8-oxoguanine and other oxidation products in DNA. Nucleic Acids Res. 2002;30:4926–4936. doi: 10.1093/nar/gkf618. [DOI] [PMC free article] [PubMed] [Google Scholar]
- 45.Hazra T.K., Izumi T., Boldogh I., Imhoff B., Kow Y.W., Jaruga P., Dizdaroglu M., Mitra S. Identification and characterization of a human DNA glycosylase for repair of modified bases in oxidatively damaged DNA. Proc Natl Acad Sci U S A. 2002;99:3523–3528. doi: 10.1073/pnas.062053799. [DOI] [PMC free article] [PubMed] [Google Scholar]
- 46.Bandaru V., Sunkara S., Wallace S.S. A novel human DNA glycosylase that removes oxidative DNA damage and is homologous to Escherichia coli endonuclease VIII. DNA Repair. 2002;1:517–529. doi: 10.1016/s1568-7864(02)00036-8. [DOI] [PubMed] [Google Scholar]
- 47.Kovtun I.V., Liu Y., Bjoras M., Klungland A., Wilson S.H., McMurray C.T. OGG1 initiates age-dependent CAG trinucleotide expansion in somatic cells. Nature. 2007;447:447–452. doi: 10.1038/nature05778. [DOI] [PMC free article] [PubMed] [Google Scholar]
- 48.Kopelman P.G. Obesity as a medical problem. Nature. 2000;404:635–643. doi: 10.1038/35007508. [DOI] [PubMed] [Google Scholar]
- 49.Kim H.N., Morimoto Y., Tsuda T., Ootsuyama Y., Hirohashi M., Hirano T., Tanaka I., Lim Y., Yun I.G., Kasai H. Changes in DNA 8-hydroxyguanine levels, 8-hydroxyguanine repair activity, and hOGG1 and hMTH1 mRNA expression in human lung alveolar epithelial cells induced by crocidolite asbestos. Carcinogenesis. 2001;22:265–269. doi: 10.1093/carcin/22.2.265. [DOI] [PubMed] [Google Scholar]
- 50.Tsurudome Y., Hirano T., Yamato H., Tanaka I., Sagai M., Hirano H., Nagata N., Itoh H., Kasai H. Changes in levels of 8-hydroxyguanine in DNA, its repair and OGG1 mRNA in rat lungs after intratracheal administration of diesel exhaust particles. Carcinogenesis. 1999;20:1573–1576. doi: 10.1093/carcin/20.8.1573. [DOI] [PubMed] [Google Scholar]
- 51.Tyrberg B., Anachkov K.A., Dib S.A., Wang-Rodriguez J., Yoon K.H., Levine F. Islet expression of the DNA repair enzyme 8-oxoguanosine DNA glycosylase (Ogg1) in human type 2 diabetes. BMC Endocr Disord. 2002;2:2. doi: 10.1186/1472-6823-2-2. [DOI] [PMC free article] [PubMed] [Google Scholar]
- 52.Nakabeppu Y., Tsuchimoto D., Yamaguchi H., Sakumi K. Oxidative damage in nucleic acids and Parkinson's disease. J Neurosci Res. 2007;85:919–934. doi: 10.1002/jnr.21191. [DOI] [PubMed] [Google Scholar]
- 53.Kohno T., Shinmura K., Tosaka M., Tani M., Kim S.R., Sugimura H., Nohmi T., Kasai H., Yokota J. Genetic polymorphisms and alternative splicing of the hOGG1 gene, that is involved in the repair of 8-hydroxyguanine in damaged DNA. Oncogene. 1998;16:3219–3225. doi: 10.1038/sj.onc.1201872. [DOI] [PubMed] [Google Scholar]
- 54.Smart D.J., Chipman J.K., Hodges N.J. Activity of OGG1 variants in the repair of pro-oxidant-induced 8-oxo-2′-deoxyguanosine. DNA Repair. 2006;5:1337–1345. doi: 10.1016/j.dnarep.2006.06.001. [DOI] [PubMed] [Google Scholar]
- 55.Weiss J.M., Goode E.L., Ladiges W.C., Ulrich C.M. Polymorphic variation in hOGG1 and risk of cancer: a review of the functional and epidemiologic literature. Mol Carcinog. 2005;42:127–141. doi: 10.1002/mc.20067. [DOI] [PubMed] [Google Scholar]