

Abstract
Liver metastasis is a fatal step in the progression of colorectal cancer (CRC); however, the epigenetic evolution of this process is largely unknown. To decipher the epigenetic alterations during the development of liver metastasis, the DNA methylation status of 12 genes, including 5 classical CpG island methylator phenotype (CIMP) markers, was analyzed in 62 liver metastases and in 78 primary CRCs (53 stage I–III; 25 stage IV). Genome-wide methylation analysis was also performed in stage I–III CRCs and in paired primary and liver metastatic cancers. Methylation frequencies of MGMT and TIMP3 increased progressively from stage I–III CRCs to liver metastasis (P = 0.043 and P = 0.028, respectively). The CIMP-positive cases showed significantly earlier recurrence of disease than did CIMP-negative cases with liver metastasis (P = 0.030), whereas no such difference was found in stage I–III CRCs. Genome-wide analysis revealed that more genes were methylated in stage I–III CRCs than in paired stage IV samples (P = 0.008). Hierarchical cluster analysis showed that stage I–III CRCs and stage IV CRCs were clustered into two distinct subgroups, whereas most paired primary and metastatic cancers showed similar methylation profiles. This analysis revealed distinct methylation profiles between stage I–III CRCs and stage IV CRCs, which may reflect differences in epigenetic evolution during progression of the disease. In addition, most methylation status in stage IV CRCs seems to be established before metastasis.
Colorectal cancer (CRC) is one of the most aggressive types of cancer, and it occurs at a high incidence in most countries.1 Despite several advances in diagnosis and treatment of CRC, the overall survival rate has changed little in the past decade. A major reason is the high occurrence of distant metastasis, the liver being the most common site. As many as 25% of patients with CRC present with liver metastases at the time of diagnosis, and approximately 50% of patients who undergo radical resection for primary CRC are affected by metastatic disease in the liver in the first couple of years after surgery, probably owing to the existence of micrometastasis when the primary tumor is resected.2,3 Although there have been recent advances in chemotherapy of colorectal liver metastasis, treatment options for patients with advanced disease are limited to only a subset of cases because not all patients are eligible for curative surgical resection, which makes the prognosis of this disease poor.4,5 A multidisciplinary effort is required to elucidate better means to overcome the current limitations of surgical, chemotherapeutic, and radiotherapeutic intervention.3 Therefore, understanding the molecular mechanisms underlying metastasis in CRC is important and may, in turn, foster the development of potent therapeutic strategies to combat this disease.
Cancer progression to metastasis has been thought to occur through clonal genomic and epigenetic evolution.6–8 Liver metastasis from primary CRC involves a multistep process that is tightly regulated and may require a cancer cell to express genes associated with proteolysis of local extracellular matrix attachments, adhesive alterations, angiogenesis, viable vascular dissemination, distant embolization, and survival in a new environment.9,10 In this context, a variety of molecular factors have been investigated. Matrix metalloproteinase 7 is involved in proteolysis of the extracellular matrix.11 Osteopontin mediates anchorage-independent growth, cell adhesion, and cell invasion.12,13 Vascular endothelial growth factor is a well-known angiogenic factor that stimulates endothelial migration, proliferation, proteolytic activity, and capillary morphogenesis.14 The expression of these genes is linked to advancing tumor stage, making them potential markers for assessing the risk of liver metastasis.15 However, not all of these genetic alterations occur during the process of liver metastasis, with other molecular mechanisms potentially being involved.8,9,16
DNA hypermethylation, an important epigenetic mechanism, has been reported in many cancers. It can affect multiple cellular processes, including proliferation and apoptosis, by silencing tumor suppressor genes.17,18 To date, studies have demonstrated that various genes are hypermethylated and associated with tumor progression.6,9,13,16 A high frequency of p16/INK4A methylation has been suggested in stage IV CRC.19 Hypermethylation of tissue inhibitor of metalloproteinase 3 (TIMP3), which encodes for an extracellular matrix–bound protein, in breast cancer is associated with high tumor grade and lymph node metastasis.20 Aberrant promoter methylation of RASSF1A has been linked to progression of nasopharyngeal carcinoma.21 Recent studies suggested that a subset of CRCs has a unique hypermethylation phenotype, termed CpG island methylator phenotype (CIMP).22 Tumors affected by this phenotype are characterized by a high degree of concordant CpG island methylation and exhibit characteristic clinicopathologic and molecular features.23,24 However, only a limited number of genes have been examined in this respect in paired primary and metastatic tumors, and no data are available regarding the global profile of DNA methylation during the process of liver metastasis.
In this study, we examined global DNA methylation status in stage I–III CRCs and in paired primary and metastatic tumors using a methylated CpG island amplification microarray (MCAM) approach; this technique provides reproducible results with a high validation rate and successfully detects genes that are methylated in cancerous tissues.25–29 Several genes, including five classical CIMP markers, were further examined by quantitative DNA methylation analysis in CRCs and liver metastases. We found characteristic methylation profiles for stage I–III CRCs and stage IV CRCs, which likely reflects different pathologic processes underlying stage IV CRCs compared with stage I–III CRCs. The DNA methylation pattern along a genome is generally inherited faithfully during mitosis, with it potentially being subject to evolution by natural selection during acquisition of the metastatic phenotype. This study sheds light on the underlying mechanisms associated with epigenetic regulation and provides evidence to clarify the nature of epigenetic evolution during progression to metastasis.
Material and Methods
Tissue Samples
We collected 78 primary CRC (53 stage I–III and 25 stage IV) and 62 liver metastasis tissue samples from patients who underwent surgical resection at the Aichi Cancer Center Central Hospital, Nagoya, Japan, between January 1, 2006, and December 31, 2008. Tumors were selected solely on the basis of availability during the period. Samples and clinical data were collected after appropriate approval of the Aichi Cancer Center review board was received and written informed consent had been obtained from all the patients. The backgrounds of examined cases are given in Table 1. Pathologic TNM classification was determined according to the criteria of the International Union Against Cancer.30 Tissue samples were flash frozen and stored at −80°C until analyses. The specimens examined showed a high proportion (>80%) of cancer cells without definite evidence of necrosis. Genomic DNA was extracted using a standard phenol-chloroform method. Regarding the metastasis period, synchronous liver metastasis was defined as metastasis that occurred within 6 months of resection of the primary CRC; metachronous liver metastasis was defined as metastasis that was noted more than 6 months after resection of the primary CRC.31
Table 1.
Backgrounds of Cases with Stage I–III CRCs, Stage IV CRCs, and Liver Metastases
| Stage I–III CRC (n = 53) | Stage IV CRC (n = 25) | Liver metastasis (n = 62) | |
|---|---|---|---|
| Age, mean ± SD, years | 64.7 ± 9.2 | 62.1 ± 8.4 | 62.8 ± 9.8 |
| Sex, No. (%) | |||
| Female | 21 (40) | 6 (24) | 18 (29) |
| Male | 32 (60) | 19 (76) | 44 (71) |
| Tumor location, No. (%)⁎ | |||
| Proximal | 17 (32) | 12 (48) | 21 (34) |
| Distal | 36 (68) | 13 (52) | 41 (66) |
| Stage, No. (%) | |||
| I | 6 (11) | NA | NA |
| II | 25 (47) | NA | NA |
| III | 22 (42) | NA | NA |
| Pathology, No. (%)† | |||
| Well | 4 (8) | 2 (8) | 3 (6) |
| Moderately | 46 (87) | 21 (84) | 44 (86) |
| Poorly | 3 (6) | 2 (8) | 4 (8) |
| Metastasis period, No. (%) | |||
| Synchronous | NA | NA | 25 (40) |
| Metachronous | NA | NA | 37 (60) |
NA, not applicable.
Proximal primary tumors were located in the cecum and the ascending and transverse colon; distal primary tumors were located in the descending and sigmoid colon and the rectum.
Pathologic findings are available in only 51 cases of liver metastasis.
Cell Lines
Six colon cell lines (SW48, SW480, LS174T, SW1083, RKO, and Lovo) and one hepatocellular carcinoma cell line (Huh7) were used for the study. The colon cell lines were obtained from the American Type Culture Collection (Rockville, MD) or the Japanese Collection of Research Bioresources (Osaka, Japan) and were cultured according to the relevant instructions. Huh7 was the kind gift of Dr. Tetsuro Suzuki (National Institute of Infectious Diseases, Tokyo, Japan). Cell lines were grown in Dulbecco's modified Eagle's medium (Sigma-Aldrich, St. Louis, MO) supplemented with 10% fetal bovine serum (Invitrogen, Carlsbad, CA) and antibiotic-antimycotic (Invitrogen) at 37°C in a humidified incubator with 5% CO2. Cells were treated with 5-aza-2′-deoxycytidine (Sigma-Aldrich; 1 μmol/L for 72 hours) as described previously.26
Quantitative RT-PCR Analyses
Total RNA was isolated using TRIzol (Invitrogen). Two micrograms of RNA was reverse transcribed using Moloney murine leukemia virus (Promega, Madison, WI). Quantitative TaqMan and SYBR Green RT-PCR (Applied Biosystems, Foster City, CA) were performed in triplicate for the target genes of interest. Primer sequences are shown in Table 2.
Table 2.
Primer Sets for Pyrosequencing Methylation Analysis, MSP, and RT-PCR
| Gene⁎ | Primers† | Annealing temperature (°C) | No. of CpGs | Sequencing primers |
|---|---|---|---|---|
| Primer sequences for pyrosequencing analysis | ||||
| RASSF1A (+268 ∼ +565) |
|
55 | 3 | 5′-GATTTTATTTGGGG-3′ |
| CDH1 (+9 ∼ +116) |
|
55 | 2 | 5′-GGAAGTTAGTTTAGATTTTA-3′ |
| MGMT (−357 ∼ −200) |
|
60/57/54/51 | 3 | 5′-GGAAGTTGGGAAGG-3′ |
| TIMP3 (+540 ∼ +798) |
|
55 | 2 | 5′-GTTTTTTTTTTGGAG-3′ |
| hMLH1 (−105 ∼ +152) |
|
58/56/54/52 | 2 | 5′-AGTTATAGTTGAAGGAAGAA-3′ |
| MINT1 |
|
55 | 3 | 5′-TTTAGTAAAAATTTTTTGGG-3′ |
| MINT2 |
|
50/48/46/44 | 2 | 5′-GAATTTTAGTATTTAAGTT-3′ |
| MINT31 |
|
55 | 3 | 5′-TGGTGATGGAGGTTATT-3′ |
| P16 (+263 ∼ +95) |
|
58/56/54/52 | 2 | 5′-GGAGTTAATAGTATTTTT-3′ |
| ANK1 (+211 ∼ +370) |
|
60 | 2 | 5′-TTTTTTAAGTTTTTAAGGTT-3′ |
| UPK3A (−274 ∼ −203) |
|
68/66/64/62 | 2 | 5′-AACAAAACCTTCTCCAAC-3′ |
| CYBRD1 (+439 ∼ +565) |
|
58 | 3 | 5′-AAAAATTAACCAAATAAAAC-3′ |
| ARAF (−1 ∼+153) |
|
58 | 2 | 5′-CCATCCTAAAACTAAACTTT-3′ |
| Primer Sequences for MSP | ||||
| ANK1 | ||||
| Methylated (−205 ∼ −37) |
|
68/66/64/62 | NA | NA |
| Unmethylated (−207 ∼ +19) |
|
68/66/64/62 | NA | NA |
| CYBRD1 | ||||
| Methylated (−40 ∼ +132) |
|
62/60/58/55 | NA | NA |
| Unmethylated (−52 ∼ +132) |
|
62/60/58/55 | NA | NA |
| Primer Sequences for RT-PCR | ||||
| UPK3A |
|
55 | NA |
F, forward; R, reverse; NA, not applicable.
The primer location relative to the transcription start site (obtained from the University of California at Santa Cruz Genome Database, version hg17, May 2004) of each gene is indicated in parentheses.
U indicates the universal primer sequence: biotin-GGGACACCGCTGATCGTTTA.
DNA Methylation Analysis
We performed bisulfite treatment as reported previously.26 Briefly, 2 μg of genomic DNA was incubated with 3M sodium bisulfite (pH 5.0) for 16 hours at 50°C. DNA was purified using the Wizard DNA purification resin (Promega, Milano, Italy) and was resuspended in 30 μL of diluted water. Conventional methylation-specific PCR (MSP) was performed for the ankyrin 1 gene (ANK1) and cytochrome b reductase 1 gene (CYBRD1). The PCR products were visualized on 3% agarose gels stained with ethidium bromide. The MSP products were subsequently confirmed by bisulfite sequencing analysis. DNA methylation levels were also measured via a quantitative method using pyrosequencing technology, with 12 methylation markers, including 5 classical CIMP markers (P16, hMLH1, MINT1, MINT2, and MINT31), being assessed (Pyrosequencing AB, Uppsala, Sweden).26 The PCR conditions and the main and sequencing primers for amplification of the 12 genes assessed are given in Table 2. Each assay included positive controls (samples after SssI treatment; New England Biolabs, Ipswich, MA) and negative controls (samples after whole genome amplification using GenomiPhi V2; GE Healthcare, Piscataway, NJ), with mixing experiments to rule out bias and repeated experiments to assess reproducibility. Optimization of annealing temperature for PCR amplification was used to overcome PCR bias.26 The methylation levels at different C sites, as measured by pyrosequencing, were averaged to represent the degree of methylation in each sample for each gene. Methylation status was analyzed as a continuous variable (methylation level) and as a categorical variable (methylation positive or negative). Genes with methylation levels greater than 15% were considered methylation positive because lower values could not be easily distinguished from background.28,32
MCAM Analysis
The MCAM analysis was performed using DNA from eight stage I–III CRCs and nine stage IV CRCs, along with their paired liver metastases and corresponding normal colon mucosa samples (controls). The backgrounds of cases examined by MCAM analysis are shown in Supplemental Table S1 at http://ajp.amjpathol.org. A detailed protocol for MCAM analysis has been described previously.25,26 Herein, we used a human custom promoter array (G4413A; Agilent Technologies, Santa Clara, CA) containing 15,134 probes corresponding to 6157 unique genes, which we had initially validated by the MCAM method in a previous study.26,28 After hybridization and washing according to the manufacturer's protocol, arrays were scanned using an Agilent scanner and were analyzed using Feature Extraction software; then, data normalization was performed using a linear per-array algorithm according to the manufacturer's protocol (Agilent Technologies). To determine the criteria for the identification of hypermethylated loci, five selected genes [p16, O-6-methylguanine-DNA methyltransferase (MGMT), ARAF, CYBRD1, and uroplakin 3A (UPK3A)] were subsequently assessed by pyrosequencing analysis in primary CRC and metastasis samples (genes with methylation levels >15% were considered methylation positive). A high concordance was observed between the methylation status as determined by MCAM and pyrosequencing analyses (specificity, 98.8%; sensitivity, 66.7%; and false discovery rate, 0.067; data not shown), as has been demonstrated in previous studies.25,26,28 Thus, we considered a signal ratio greater than 2.0 via MCAM analysis to be methylation positive.
Hierarchical Clustering Analysis
Cluster analysis was performed using an agglomerative hierarchical clustering algorithm.28,33 For specimen clustering, pairwise similarity measures among specimens were calculated using statistical software [Cluster 3.0 (http://rana.lbl.gov/EisenSoftware.htm) or Minitab 15 (Custom Solutions, Summerville, SC)] based on DNA methylation intensity measurements obtained across all genes assessed.
Statistical Analysis
All statistical analyses were performed using a software program [GraphPad Prism version 4.0 (GraphPad Software, San Diego, CA) or STATA version 11 (StataCorp LP, College Station, TX)]. Differences in clinicopathologic variables were analyzed using Fisher's exact test. Differences in DNA methylation were calculated using the U-test or the Kruskal-Wallis test. All reported P values were two sided, and P < 0.05 was considered statistically significant. Relapse-free survival (RFS) was calculated starting from the date of the surgical procedure to the date of finding new liver metastatic lesions or local recurrences from primary CRC. Survival curves were generated via the Kaplan-Meier method, and the log-rank test was used for statistical analysis. A multivariate analysis using the Cox proportional hazards model was performed for estimation of hazard ratio. The factors considered in the multivariate model included stage and CIMP status, which were marginally (P < 0.1) or statistically (P < 0.05) significant by Fisher's exact test, in addition to age and sex. All the variables for the multivariate analysis were categorical variables. Patients were observed until the incidence of recurrence after surgery or until September 2008, whichever came first. There were 14 and 26 recurrent cases in stage I–III CRCs and liver metastases, respectively. Median follow-up was 22 months in stage I–III CRCs and 14 months in liver metastases.
Results
Quantitative Methylation Analysis of Nine Candidate Genes in Stage I–III CRCs, Stage IV CRCs, and Liver Metastases
DNA methylation status was examined by pyrosequencing analysis in 53 stage I–III CRCs, 25 stage IV CRCs, and 62 liver metastases (Figure 1 and Table 3). There were no significant differences in terms of age, sex, and tumor location among the three study groups. We examined DNA methylation of five classical CIMP markers because it remains to be understood how CIMP affects the process of liver metastasis despite numerous studies showing its characteristic clinicopathologic and molecular features.23,24 In addition, we examined the DNA methylation status of MGMT, RASSF1A, TIMP3, and E-cadherin (CDH1) because methylation of each of these genes has already been studied in metastatic CRCs.19,34,35
Figure 1.
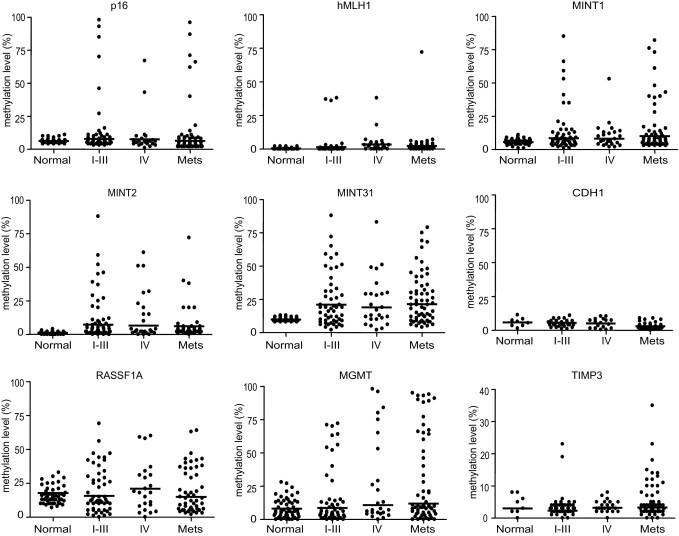
DNA methylation status of nine genes (p16, hMLH1, MINT1, MINT2, MINT31, CDH1, RASSF1A, MGMT, and TIMP3) in 53 stage I–III CRCs (I–III), 25 stage IV CRCs (IV), and 62 liver metastases (Mets) and corresponding normal colonic mucosae. The y axis indicates the level of DNA methylation of each gene, as measured by bisulfite pyrosequencing–based methylation analysis. Each dot represents the methylation level of the indicated gene in each sample from either primary CRCs of a differing stage or liver metastases. Horizontal lines denote median methylation levels in each group.
Table 3.
Frequency of DNA Methylation and CIMP Status in Stage I–III CRCs, Stage IV CRCs, and Liver Metastases
| Normal tissue | Stage I–III CRC | Stage IV CRC | Liver metastases | P value⁎ | |
|---|---|---|---|---|---|
| DNA methylation status | |||||
| CIMP markers | |||||
| P16 | 0/53 (0) | 7/53 (13.2) | 3/25 (12.0) | 7/62 (11.3) | 0.943 |
| hMLH1 | 0/53 (0) | 3/53 (5.6) | 2/25 (8.0) | 1/62 (1.6) | 0.233 |
| MINT1 | 0/53 (0) | 9/53 (17) | 4/25 (16.0) | 13/62 (21.0) | 0.843 |
| MINT2 | 0/53 (0) | 12/53 (22.6) | 7/25 (28.0) | 6/62 (9.7) | 0.060 |
| MINT31 | 0/53 (0) | 30/53 (56.6) | 13/25 (52.0) | 37/62 (59.7) | 0.810 |
| Candidate genes | |||||
| MGMT | 9/53 (17.0) | 11/53 (20.1) | 10/25 (40.0) | 25/59 (42.4) | 0.043 |
| RASSF1A | 22/64 (34.4) | 21/51 (41.2) | 13/23 (56.5) | 23/53 (43.4) | 0.448 |
| TIMP3 | 0/8 (0) | 2/53 (3.8) | 0/23 (0) | 9/58 (15.5) | 0.028 |
| CDH1 | 0/8 (0) | 0/53 (0) | 0/23 (0) | 0/59 (0) | NA |
| Identified genes | |||||
| UPK3A | 0/8 (0) | 0/53 (0) | 0/25 (0) | 5/59 (8.5) | 0.044 |
| CIMP status | |||||
| CIMP positive | 0/53 (0) | 12/53 (22.6) | 7/25 (28.0) | 15/62 (24.2) | 0.871 |
Data are given as number with methylation/total number, with hypermethylation-positive percentages in parentheses.
NA, not available.
DNA methylation frequencies were statistically analyzed between stage I–III CRCs, stage IV CRCs, and liver metastases.
The median DNA methylation level seems to be similar among the three groups (Figure 1). No evidence of substantial DNA methylation of CDH1 was seen with any of the three groups or with normal colon mucosae. We found that a subset of stage IV CRCs and of liver metastases cases showed a prominently high level of DNA methylation (>80%) in MGMT. In addition, some liver metastases showed increased DNA methylation of TIMP3, which encodes an inhibitor of the matrix metalloproteinases.
The frequency of positive cases with DNA methylation of the five classical CIMP markers and RASSF1A was not observed to be different among the three groups (Table 3). In contrast, DNA methylation–positive cases of MGMT were more frequent in stage IV CRCs (40.0%) and in liver metastases (42.4%) than in stage I–III CRCs (20.1%; P = 0.043; Table 3). In addition, we found that DNA methylation–positive cases of TIMP3 were significantly more frequent in liver metastases (15.5%) than in either stage I–III CRCs (3.8%) or stage IV CRCs (0%; P = 0.028). These data suggest that DNA methylation in a subset of genes progressively increased during the metastatic process in CRC.
Relationship between CIMP Status and Disease Outcome in Stage I–III CRCs and Liver Metastases
Samples with simultaneous methylation of at least two of the five classical CIMP markers were considered CIMP positive.23 Using this criterion, 12 stage I–III CRCs (22.6%), 7 stage IV CRCs (28.0%), and 15 liver metastases (24.2%) were classified as CIMP positive. There was no difference in relation to the frequency of CIMP-positive cases among the three groups (Table 3).
Several previous studies have demonstrated that CIMP confers variable prognostic effects in CRC.36–42 We next analyzed the relationship between CIMP status and outcome measurements in patients with stage I–III CRCs and liver metastases (Figure 2). No association was found between CIMP status and RFS in stage I–III CRCs (P = 0.23). In contrast, in the case of liver metastases, CIMP-positive tumors showed significantly earlier recurrence of liver metastasis than did CIMP-negative tumors after treatment (P = 0.030). Incidence of recurrence was marginally associated with the stage of tumors in stage I–III CRCs (P = 0.063) and was significantly associated with CIMP status in liver metastases (P = 0.036), factors that were further analyzed by multivariate analysis. A multivariate analysis using the Cox proportional hazards model showed that clinical stage affected the incidence of recurrence in stage I–III CRCs (hazard ratio = 3.10; 95% confidence interval = 1.04–9.26; P = 0.042; Table 4), whereas CIMP is an independent factor for determining recurrence in liver metastases (hazard ratio = 2.64; 95% confidence interval = 1.18–5.94; P = 0.019; Table 4). These different outcomes of CIMP-positive tumors in stage I–III CRCs and liver metastases raise the possibility that different sets of DNA methylation targets exist in stage I–III CRCs, stage IV CRCs, and liver metastases. To clarify this possibility, we conducted genome-wide DNA methylation analysis in stage I–III CRCs and in paired stage IV primary tumors and liver metastases.
Figure 2.
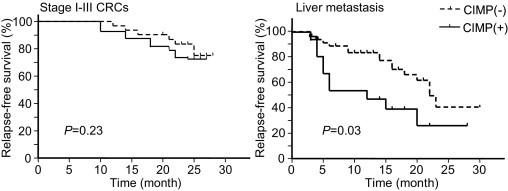
Kaplan-Meier analyses of the probability of RFS in patients with stage I–III CRCs or liver metastases. Both CIMP-negative (n = 31 stage I–III CRCs; n = 47 liver metastases) and CIMP-positive (n = 11 stage I–III CRCs; n = 15 liver metastases) tumors are shown.
Table 4.
Analyses of Recurrent Factors for Stage I–III CRC and Liver Metastasis
| Stage I–III CRC (n = 53) |
Liver metastasis (n = 62) |
|||
|---|---|---|---|---|
| Value⁎ | P value | Value⁎ | P value | |
| Fisher's Exact Test | ||||
| Age, years | 0.333 | 1.000 | ||
| <60 | 3/17 (18) | 2/6 (33) | ||
| ≥60 | 12/36 (33) | 24/56 (43) | ||
| Sex | 0.227 | 0.065 | ||
| Male | 9/24 (38) | 17/35 (49) | ||
| Female | 6/29 (21) | 9/27 (33) | ||
| Stage | 0.063 | NA | ||
| I and II | 5/30 (17) | NA | ||
| III | 10/23 (43) | NA | ||
| Tumor location | 0.736 | NA | ||
| Proximal | 3/13 (23) | NA | ||
| Distal | 12/40 (30) | NA | ||
| Metastasis time | NA | 0.203 | ||
| Synchronous | NA | 13/37 (35) | ||
| Metachronous | NA | 13/25 (52) | ||
| No. of metastatic lesions | NA | 0.442 | ||
| ≥3 | NA | 16/34 (47) | ||
| <3 | NA | 10/28 (36) | ||
| CIMP | 0.722 | 0.036 | ||
| Positive | 11/41 (27) | 16/47 (34) | ||
| Versus negative | 4/12 (33) | 10/15 (67) | ||
| Multivariate Analysis† | ||||
| Age: <60 versus ≥60 years | 1.55 (0.39–6.15) | 0.532 | 0.75 (0.17–3.24) | 0.702 |
| Sex: male versus female | 0.74 (0.24–2.25) | 0.594 | 0.43 (0.18–1.00) | 0.051 |
| Stage: III versus I and II | 3.10 (1.04–9.26) | 0.042 | NA | NA |
| CIMP: positive versus negative | 1.05 (0.33–3.39) | 0.931 | 2.64 (1.18–5.94) | 0.019 |
NA, not applicable.
For Fisher's exact test, values are given as number of recurrences/total number (percentage); for multivariate analysis, values are given as hazard ratio (95% confidence interval).
Multivariate analysis of recurrent factors by Cox proportional hazards model for stage I–III CRCs and liver metastasis.
Genome-Wide DNA Methylation Analysis in Stage I–III CRCs and in Paired Stage IV Primary and Liver Metastatic Tumors
To examine genome-wide DNA methylation status according to CRC stage, a microarray-based profiling approach, MCAM, was performed in eight stage I–III CRCs and in nine paired stage IV primary and liver metastatic tumors. The backgrounds of the samples used are shown in Supplemental Table S1 at http://ajp.amjpathol.org. Initial validation of the MCAM data showed that a high concordance was observed between the methylation status determined by this technique and pyrosequencing analysis (specificity, 98.8%; sensitivity, 66.7%; and false discovery rate, 0.067; see Materials and Methods), as has been demonstrated in previous studies.26,28,29
The MCAM analysis revealed that an average of 1213 genes (19.7%), 826 genes (13.4%) and 784 genes (12.7%) were methylated in stage I–III CRCs, stage IV primary CRCs, and liver metastases, respectively (Figure 3A). The number of methylated genes in stage I–III CRCs was significantly larger than that in the other two groups (P = 0.008).
Figure 3.
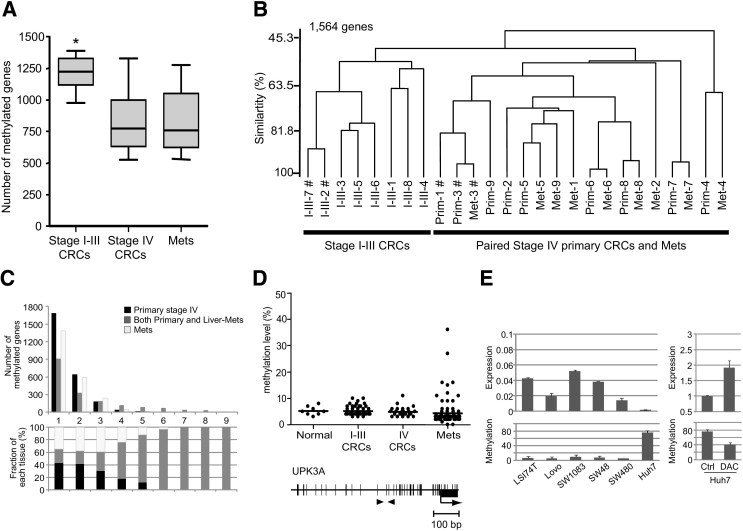
The MCAM analysis in stage I–III CRCs and paired stage IV CRCs and liver metastases. A: Box and whisker analysis of the number of methylated genes in stage I–III CRCs and in paired stage IV CRCs and liver metastases (Mets). The median is marked by a bold line inside the box, whose ends denote the upper and lower quartiles. Error bars represent 5 and 95 percentile values. DNA methylation levels were statistically analyzed between stage I–III CRCs, stage IV CRCs, and liver metastases. *P = 0.008. B: Dendrogram overview of unsupervised hierarchical cluster analysis using DNA methylation data from 1564 genes assessed via MCAM analysis. I–III, Prim, and Met followed by a number indicate each case of stage I–III CRC, stage IV primary CRC, and liver metastasis, respectively; #, CIMP-positive tumor. C: Number of genes (y axis) that were commonly methylated in x number of cases, where x is the axis in stage IV primary tumor (black), liver metastasis (white), or both primary and liver metastasis (gray) (top), and the fraction of each tissue that has commonly methylated genes in x number of cases (bottom). D: DNA methylation status of the UPK3A gene in 53 stage I–III CRCs, 25 stage IV CRCs, and 62 liver metastases (top) and a schematic diagram of the promoter of the UPK3A gene (bottom). The transcription start site (arrow) and the location of exon 1 (black box) are indicated. Black arrowheads indicate the regions analyzed by pyrosequencing. Scatterplot represents the same as in Figure 1. E: Gene expression (top left) and DNA methylation (bottom left) of UPK3A were measured by quantitative PCR and pyrosequencing analysis in six cell lines, respectively. After treatment with 5-aza-2′-deoxycytidine (1 μmol/L), UPK3A was reactivated (top right) with a decreased level of DNA methylation (top right). Ctrl, cells treated with distilled water. Relative values of mRNA expression for the UPK3A gene to glyceraldehyde-3-phosphate dehydrogenase are shown on the y axis (top). Error bars denote SDs from experiments in triplicate.
Unsupervised hierarchical clustering analysis of CRCs and liver metastases using the methylation status of 1564 genes, which were methylated in more than two cases of stage I–III CRCs, stage IV primary CRCs, or liver metastases, indicated two major subgroups: one was composed of stage I–III CRCs and another of paired primary and metastatic tumors (Figure 3B). Among the nine paired stage IV tumors, five (cases 3, 5, 6, 7, and 8) showed highly similar methylation profiles (similarity, 85% to 96%), with another (case 4) showing similar methylation profiles (similarity, 65%) between primary tumors and liver metastases (Figure 3B). A distinctly different methylation profile was observed in case 1 between primary tumor and liver metastasis. In this case, the primary tumor was observed to be CIMP positive and the metastatic tumor was less methylated and was deemed to be CIMP negative (see Supplemental Table S1 at http://ajp.amjpathol.org). Sampling from different places in the tumor in this case showed consistent results in terms of methylation status (data not shown). Notably, CIMP-positive cases fell into one cluster of each stage (cases 2 and 7 of stage I–III, primary tumors 1 and 3, and liver metastasis 3 of stage IV) (Figure 3B). These data are consistent with the previous MCAM analysis in CRC, which showed a distinct cluster of CIMP-positive CRCs from other CRC clusters.29
To assess whether sets of genes are commonly methylated across multiple cases in primary tumors or liver metastases, silencing of which may foster liver metastasis, we analyzed the methylated genes identified by MCAM analysis. Most of the methylated genes that were commonly methylated across multiple cases (ie, >4 cases) were found to be simultaneously methylated in primary tumors and liver metastases (Figure 3C). In contrast, most of the specific methylation targets in either primary CRCs or liver metastases were found in only one or two cases, suggesting that DNA methylation of a few genes is commonly associated with liver metastasis or that DNA methylation in such specific target genes might be a stochastic event during metastasis (Figure 3C).
Among the specifically hypermethylated genes in liver metastases, as determined by MCAM analysis, we confirmed that UPK3A was specifically methylated in these tissues by pyrosequencing analysis, as was found for TIMP3 (Figure 1, Figure 3D, and Table 3). DNA methylation of this gene was inversely correlated with gene expression levels (Figure 3E). In addition, DNA methylation inhibitor, 5-aza-2′-deoxycytidine, reactivated UPK3A gene expression along with DNA demethylation, suggesting that DNA methylation of the UPK3A promoter is the primary mechanism underlying silencing of this gene (Figure 3E). Taken together, these data indicate that the methylation profiles of primary and metastatic tumors were similar in most cases and that specific targets of DNA methylation in either primary CRCs or liver metastases might be associated with the metastatic process.
Comparison of Frequently Methylated Genes in Stage I–III CRCs and Stage IV CRCs
Next, we analyzed which genes were frequently methylated in multiple cases of stage I–III CRCs and stage IV CRCs. Unsupervised hierarchical clustering analysis using the methylation status of 630 genes, which were methylated in more than half of the samples in either stage I–III CRCs or stage IV CRCs, showed that stage I–III CRCs and stage IV CRCs were clustered into two subgroups (Figure 4A; see Supplemental Table S2 at http://ajp.amjpathol.org). This is consistent with the results of hierarchical clustering analysis using 1564 genes (Figure 3B). Of the 630 genes analyzed, 290 (46.0%) were frequently methylated in stage I–III CRCs and stage IV CRCs, suggesting that hypermethylation of these genes was involved in the transition from early-stage to progressed CRC. In addition, distinct targets were detected in stage I–III CRCs and stage IV CRCs [291 genes (46.2%) in stage I–III CRCs and 49 genes (7.8%) in stage IV CRCs], indicating that frequent methylation targets were different between stage I–III CRCs and stage IV CRCs, which may be associated with the different pathologic features of the two groups.
Figure 4.
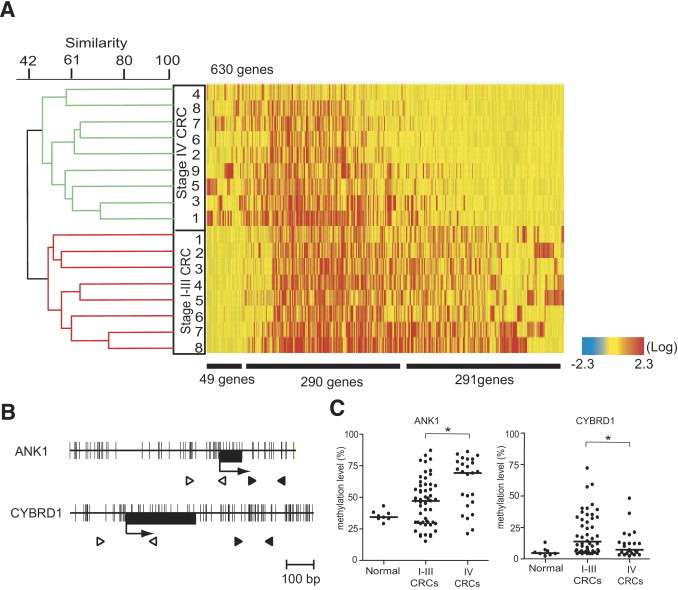
Dendrogram and heat map overview of unsupervised hierarchical cluster analysis of DNA methylation data from stage I–III CRCs and stage IV CRCs using 630 genes. A: Commonly methylated genes in either stage I–III CRCs or stage IV CRCs are analyzed. Each cell in the matrix represents the DNA methylation status of a gene in an individual sample. Red and blue in cells reflect high and low methylation levels, respectively, as indicated in the scale bar (log2-transformed scale). Numbers below the matrix indicate the methylated genes frequently found in stage IV CRCs, in both stage I–III CRCs and stage IV CRCs, and in stage I–III CRCs, respectively. The dendrogram represents the same as Figure 3. B: Schematic diagrams of the promoters of the ANK1 and CYBRD1 genes. The transcription start site (arrow) and the location of exon 1 (black box) are indicated. Black and white arrowheads indicate the regions analyzed by pyrosequencing and MSP, respectively. C: DNA methylation status of the ANK1 and CYBRD1 genes in 8 normal tissues, 53 stage I–III CRCs, and 25 stage IV CRCs. Scatterplot represents the same as Figure 1. DNA methylation levels were statistically analyzed between stage I–III CRCs and stage IV CRCs. *P < 0.05.
Based on the results of the MCAM assay, along with annotation analysis and characterization of target genes, two representative genes, ANK1 and CYBRD1, which have a typical CpG island containing two XmaI recognition sites closely located at the transcription start site of the genes, were selected and further examined by pyrosequencing analysis. Because CpG contents around the transcription start sites of the ANK1 and CYBRD1 genes are extensively high, we designed primers downstream of exon 1 for both genes (Figure 4B). We further designed MSP assays encompassing the transcription start sites and found that methylation status determined using the pyrosequencing and MSP assays were concordant (see Supplemental Figure S1 at http://ajp.amjpathol.org). Consistent with the MCAM data, pyrosequencing analysis revealed that ANK1 showed a higher level of DNA methylation in stage IV CRCs than in stage I–III CRCs (P = 0.002; Figure 4C), whereas CYBRD1 showed a higher DNA methylation level in stage I–III CRCs than in stage IV CRCs (P = 0.048; Figure 4C).
Discussion
Cancer metastasis is a complex process involving many biological steps, presumably requiring significant changes in gene expression.9 Several studies have suggested a contribution of epigenetic abnormalities during the process of CRC metastasis19,38,43; however, genome-wide epigenetic alterations have not so far been studied in this context. In this study, we comprehensively examined methylation status in primary CRCs and liver metastases to decipher the contribution of aberrant DNA methylation to liver metastasis. Frequencies of DNA methylation in the present study, which were assessed by pyrosequencing analysis, were a little lower than were those in the previous studies using MSP or combined bisulfite restriction analysis.32,35,44,45 The differences in the methylation status might be due to the different technology used for methylation analysis.
Methylation frequencies of MGMT and TIMP3 were progressively increased during the metastatic process in CRC. MGMT is a DNA repair gene that is frequently methylated in CRC and is correlated with G to A transition mutations in cancer-related genes, such as KRAS, TP53, and PIK3CA.46–49 MGMT hypermethylation has been reported to occur during the very early steps of colorectal carcinogenesis.32 In this study, we showed that the methylation frequency of MGMT is significantly increased from stage I–III CRC to stage IV CRC and liver metastasis, suggesting that hypermethylation of MGMT may also contribute to disease progression. TIMP3 is a natural inhibitor for matrix metalloproteinase and is involved in the degradation of extracellular matrix.50 Attenuated expression of TIMP3 protein is related to the infiltration and metastasis of CRC.51 The present data are consistent with a major role for TIMP3 in CRC metastasis, supporting the idea that silencing of TIMP3 in tumor cells might confer potency for metastasis to other organs. In addition to these two genes, we newly identified UPK3A as being methylated only in liver metastases in the present study. UPK3A encodes for a member of the uroplakin family, a group of transmembrane proteins that form complexes on the apical surface of the bladder epithelium.52 Loss of expression of uroplakin 3 is associated with aggressive bladder cancer.53 These data indicate that silencing of UPK3A by DNA methylation may contribute to the establishment of liver metastasis during the progression of CRC. In addition, our results have profound implications for screening and diagnosis of liver metastasis in CRC. The aberrant DNA methylation of TIMP3, MGMT, and UPK3A could serve as informative markers of liver metastasis and could be applicable to the samples obtained from less invasive procedures, such as serum.54 A larger study is needed to validate these three genes as useful diagnostic markers for liver metastasis.
Several studies have demonstrated variable prognostic effects with respect to the impact of DNA methylation in CRC.36–41,55–58 Studies showed CIMP as a predictor of better prognosis in CRCs.37,56 Another study examined CIMP in stage IV CRCs treated with 5-fluorouracil–based chemotherapy and found that CIMP predicts poor prognosis.58 Recent studies showed that worse outcome of CIMP-positive tumors is driven by BRAF mutation.37,38,40 However, despite the numerous studies in CRCs, the relative contributions of these parameters to survival outcome need to be further investigated to understand the effects and interactions of these variables.59
In this study, there was no difference in CIMP frequency among stage I–III CRCs, stage IV CRCs, and liver metastases, suggesting that CIMP is not a predictor of liver metastasis. However, in relation to the prognostic potential of CIMP status, CIMP-positive cases showed significantly earlier recurrence than did CIMP-negative cases when liver metastases were assessed, whereas there was no difference in RFS between CIMP-positive and CIMP-negative stage I–III CRCs. In the present cohort, we found on a preliminary basis that frequencies of BRAF mutation at codon 600, which was assessed by pyrosequencing analysis,29 are 3 of 77 (4%) and 1 of 54 (2%) in stage I–IV CRCs and liver metastases, respectively. This low incidence of BRAF mutation in this cohort did not affect the analysis for RFS (data not shown). One plausible explanation for the inconsistent links to outcome regarding CIMP status between different stages in the present study may due to an existence of certain sets of hypermethylated genes between stage I–III CRCs and stage IV CRCs. Indeed, the global MCAM analysis revealed distinctly altered methylation profiles between stage I–III CRCs and stage IV CRCs. The number of methylation targets in stage IV CRCs is smaller than that observed in stage I–III CRCs. Given the paradigm concept of progression to metastasis occurring through stepwise genetic and epigenetic evolution, this result is somewhat unexpected. A conceivable hypothesis is that tumors with high degrees of methylation are more likely to inactivate genes critical for tumor progression and metastasis.
More than 60% of cases showed similar methylation profiles between paired stage IV primary tumors and liver metastases. Although we found a few genes differentially methylated between primary stage IV tumors and liver metastases, in which aberrant methylation might occur after metastasis during expansion of the clone in the liver, these data suggest that most methylation changes in these tumors may be established before progression to liver metastasis.
Recent experimental and conceptual models are beginning to address the genetic basis for cancer metastasis.16 Cancer metastasis has been explained by at least two models, namely, a progression model and an initiating model.60–62 In the progression model, metastatic capacity is acquired during cancer progression in a subpopulation of cells through sequential genetic mutations or epigenetic alterations, whereas in the initiation model, cells with metastatic potential are determined by early mutational events.6,16 Because DNA methylation is generally inherited stably, methylation profiles may reflect a signature of tumor evolution. Distinct methylation profiles in stage I–III CRCs and stage IV CRCs are partially explained by the initiating model, where metastatic potential is determined by characteristic epigenetic events in each tumor cell.16,62 In the paired primary CRCs and liver metastases, one case was CIMP positive based on analysis of the primary lesion but CIMP negative when the metastatic lesion was assessed. This also seems to be consistent with the initiation model in which progenitor cells with different CIMP statuses coexist in a tumor and may develop independently. In this case, cells with metastatic potential are CIMP negative and a minor population in a primary tumor. Taken together, the global epigenetic analysis supports the initiating model in many CRCs. Although the underlying biological complexity of cancer suggests that both initiating and progression models probably contribute to liver metastasis, cancer metastasis potential is not necessarily acquired during progression.
In conclusion, we demonstrated significant implications for epigenetic alterations in stage I–III CRCs, stage IV CRCs, and liver metastases using genome-wide methylation profiling and comprehensive quantitative methylation analysis. Although the genome-wide DNA methylation analyses were performed in a discrete cohort, we showed that DNA methylation profiles may evolve differently in stage I–III CRCs and stage IV CRCs, which likely reflects different pathologic processes. Larger studies might be desired to clarify that stage IV CRCs and stage I–III CRCs have a fundamental difference in terms of epigenetic evolution. These results have strong implications for early detection, screening, and diagnosis of highly metastatic CRCs using differentially methylated genes between stage I–III CRCs and stage IV CRCs.
Acknowledgments
We thank Ikuko Tomimatsu for her technical assistance and Shana Straub for her critical reading of the manuscript.
Footnotes
Supported by grants-in-aid for cancer research from the Ministry of Health, Labor, and Welfare; by a grant from the Japan Society for the Promotion of Science, the Japanese Society of Gastroenterology, and the Sagawa Foundation for Promotion of Cancer Research; and by a Japan-China Sasakawa Medical Fellowship (H.J.).
None of the authors disclosed any relevant financial relationships.
Supplemental material for this article can be found at http://ajp.amjpathol.org or at doi:10.1016/j.ajpath.2010.12.045.
Supplementary data
MSP data for ANK1 (A) and CYBRD1 (B) in the colorectal cancer samples. DNA methylation examined by pyrosequencing analysis (Pyroseq) and MSP is indicated below the gels (%). Positive controls were SssI-treated DNA (SssI) for the methylated form, and GenomiPhi-treated DNA for the unmethylated form (Gen). Band intensity of MSP analysis were quantified using the BioRad image analyser. Ratios of M/M+UM (%) were calculated for each sample. DNA methylation status assessed by pyrosequencing and MSP analyses are concordant (R2 = 0.84 and 0.94 in A and B, respectively). M, methylated form; UM, unmethylated form; PL, normal peripheral lymphocytes; RKO, colon cancer cell line.
References
- 1.Jemal A., Siegel R., Ward E., Hao Y., Xu J., Murray T., Thun M.J. Cancer statistics, 2008. CA Cancer J Clin. 2008;58:71–96. doi: 10.3322/CA.2007.0010. [DOI] [PubMed] [Google Scholar]
- 2.Scheele J., Stang R., Altendorf-Hofmann A., Paul M. Resection of colorectal liver metastases. World J Surg. 1995;19:59–71. doi: 10.1007/BF00316981. [DOI] [PubMed] [Google Scholar]
- 3.Mayo S.C., Pawlik T.M. Current management of colorectal hepatic metastasis. Expert Rev Gastroenterol Hepatol. 2009;3:131–144. doi: 10.1586/egh.09.8. [DOI] [PubMed] [Google Scholar]
- 4.Taylor M., Forster J., Langer B., Taylor B.R., Greig P.D., Mahut C. A study of prognostic factors for hepatic resection for colorectal metastases. Am J Surg. 1997;173:467–471. doi: 10.1016/s0002-9610(97)00020-2. [DOI] [PubMed] [Google Scholar]
- 5.Nikfarjam M., Shereef S., Kimchi E.T., Gusani N.J., Jiang Y., Avella D.M., Mahraj R.P., Staveley-O'Carroll K.F. Survival outcomes of patients with colorectal liver metastases following hepatic resection or ablation in the era of effective chemotherapy. Ann Surg Oncol. 2009;16:1860–1867. doi: 10.1245/s10434-008-0225-3. [DOI] [PubMed] [Google Scholar]
- 6.Gray J.W. Evidence emerges for early metastasis and parallel evolution of primary and metastatic tumors. Cancer Cell. 2003;4:4–6. doi: 10.1016/s1535-6108(03)00167-3. [DOI] [PubMed] [Google Scholar]
- 7.Nguyen D.X., Bos P.D., Massague J. Metastasis: from dissemination to organ-specific colonization. Nat Rev Cancer. 2009;9:274–284. doi: 10.1038/nrc2622. [DOI] [PubMed] [Google Scholar]
- 8.Gray J. Cancer: genomics of metastasis. Nature. 2010;464:989–990. doi: 10.1038/464989a. [DOI] [PubMed] [Google Scholar]
- 9.Hynes R.O. Metastatic potential: generic predisposition of the primary tumor or rare, metastatic variants-or both? Cell. 2003;113:821–823. doi: 10.1016/s0092-8674(03)00468-9. [DOI] [PubMed] [Google Scholar]
- 10.Bird N.C., Mangnall D., Majeed A.W. Biology of colorectal liver metastases: a review. J Surg Oncol. 2006;94:68–80. doi: 10.1002/jso.20558. [DOI] [PubMed] [Google Scholar]
- 11.Nagashima Y., Hasegawa S., Koshikawa N., Taki A., Ichikawa Y., Kitamura H., Misugi K., Kihira Y., Matuo Y., Yasumitsu H., Miyazaki K. Expression of matrilysin in vascular endothelial cells adjacent to matrilysin-producing tumors. Int J Cancer. 1997;72:441–445. doi: 10.1002/(sici)1097-0215(19970729)72:3<441::aid-ijc11>3.0.co;2-f. [DOI] [PubMed] [Google Scholar]
- 12.Furger K.A., Menon R.K., Tuck A.B., Bramwell V.H., Chambers A.F. The functional and clinical roles of osteopontin in cancer and metastasis. Curr Mol Med. 2001;1:621–632. doi: 10.2174/1566524013363339. [DOI] [PubMed] [Google Scholar]
- 13.Weber G.F. Molecular mechanisms of metastasis. Cancer Lett. 2008;270:181–190. doi: 10.1016/j.canlet.2008.04.030. [DOI] [PubMed] [Google Scholar]
- 14.Folkman J. What is the evidence that tumors are angiogenesis dependent? J Natl Cancer Inst. 1990;82:4–6. doi: 10.1093/jnci/82.1.4. [DOI] [PubMed] [Google Scholar]
- 15.Kioi M., Yamamoto K., Higashi S., Koshikawa N., Fujita K., Miyazaki K. Matrilysin (MMP-7) induces homotypic adhesion of human colon cancer cells and enhances their metastatic potential in nude mouse model. Oncogene. 2003;22:8662–8670. doi: 10.1038/sj.onc.1207181. [DOI] [PubMed] [Google Scholar]
- 16.Threadgill D.W. Metastatic potential as a heritable trait. Nat Genet. 2005;37:1026–1027. doi: 10.1038/ng1005-1026. [DOI] [PubMed] [Google Scholar]
- 17.Jones P.A., Takai D. The role of DNA methylation in mammalian epigenetics. Science. 2001;293:1068–1070. doi: 10.1126/science.1063852. [DOI] [PubMed] [Google Scholar]
- 18.Herman J.G., Baylin S.B. Gene silencing in cancer in association with promoter hypermethylation. N Engl J Med. 2003;349:2042–2054. doi: 10.1056/NEJMra023075. [DOI] [PubMed] [Google Scholar]
- 19.Miranda E., Destro A., Malesci A., Balladore E., Bianchi P., Baryshnikova E., Franchi G., Morenghi E., Laghi L., Gennari L., Roncalli M. Genetic and epigenetic changes in primary metastatic and nonmetastatic colorectal cancer. Br J Cancer. 2006;95:1101–1107. doi: 10.1038/sj.bjc.6603337. [DOI] [PMC free article] [PubMed] [Google Scholar]
- 20.Lui E.L., Loo W.T., Zhu L., Cheung M.N., Chow L.W. DNA hypermethylation of TIMP3 gene in invasive breast ductal carcinoma. Biomed Pharmacother. 2005;59(Suppl 2):S363–S365. doi: 10.1016/s0753-3322(05)80079-4. [DOI] [PubMed] [Google Scholar]
- 21.Fendri A., Masmoudi A., Khabir A., Sellami-Boudawara T., Daoud J., Frikha M., Ghorbel A., Gargouri A., Mokdad-Gargouri R. Inactivation of RASSF1A, RARbeta2 and DAP-kinase by promoter methylation correlates with lymph node metastasis in nasopharyngeal carcinoma. Cancer Biol Ther. 2009;8:444–451. doi: 10.4161/cbt.8.5.7686. [DOI] [PubMed] [Google Scholar]
- 22.Toyota M., Ahuja N., Ohe-Toyota M., Herman J.G., Baylin S.B., Issa J.P. CpG island methylator phenotype in colorectal cancer. Proc Natl Acad Sci U S A. 1999;96:8681–8686. doi: 10.1073/pnas.96.15.8681. [DOI] [PMC free article] [PubMed] [Google Scholar]
- 23.Issa J.P. CpG island methylator phenotype in cancer. Nat Rev Cancer. 2004;4:988–993. doi: 10.1038/nrc1507. [DOI] [PubMed] [Google Scholar]
- 24.Boland C.R., Goel A. Somatic evolution of cancer cells. Semin Cancer Biol. 2005;15:436–450. doi: 10.1016/j.semcancer.2005.06.001. [DOI] [PubMed] [Google Scholar]
- 25.Shen L., Kondo Y., Guo Y., Zhang J., Zhang L., Ahmed S., Shu J., Chen X., Waterland R.A., Issa J.P. Genome-wide profiling of DNA methylation reveals a class of normally methylated CpG island promoters. PLoS Genet. 2007;3:2023–2036. doi: 10.1371/journal.pgen.0030181. [DOI] [PMC free article] [PubMed] [Google Scholar]
- 26.Gao W., Kondo Y., Shen L., Shimizu Y., Sano T., Yamao K., Natsume A., Goto Y., Ito M., Murakami H., Osada H., Zhang J., Issa J.P., Sekido Y. Variable DNA methylation patterns associated with progression of disease in hepatocellular carcinomas. Carcinogenesis. 2008;29:1901–1910. doi: 10.1093/carcin/bgn170. [DOI] [PubMed] [Google Scholar]
- 27.Omura N., Li C.P., Li A., Hong S.M., Walter K., Jimeno A., Hidalgo M., Goggins M. Genome-wide profiling of methylated promoters in pancreatic adenocarcinoma. Cancer Biol Ther. 2008;7:1146–1156. doi: 10.4161/cbt.7.7.6208. [DOI] [PMC free article] [PubMed] [Google Scholar]
- 28.Goto Y., Shinjo K., Kondo Y., Shen L., Toyota M., Suzuki H., Gao W., An B., Fujii M., Murakami H., Osada H., Taniguchi T., Usami N., Kondo M., Hasegawa Y., Shimokata K., Matsuo K., Hida T., Fujimoto N., Kishimoto T., Issa J.P., Sekido Y. Epigenetic profiles distinguish malignant pleural mesothelioma from lung adenocarcinoma. Cancer Res. 2009;69:9073–9082. doi: 10.1158/0008-5472.CAN-09-1595. [DOI] [PubMed] [Google Scholar]
- 29.An B., Kondo Y., Okamoto Y., Shinjo K., Kanemitsu Y., Komori K., Hirai T., Sawaki A., Tajika M., Nakamura T., Yamao K., Yatabe Y., Fujii M., Murakami H., Osada H., Tani T., Matsuo K., Shen L., Issa J.P., Sekido Y. A characteristic methylation profile in CpG island methylator phenotype-negative distal colorectal cancers. Int J Cancer. 2010;127:2095–2105. doi: 10.1002/ijc.25225. [DOI] [PubMed] [Google Scholar]
- 30.Greene F.L., Sobin L.H. The TNM system: our language for cancer care. J Surg Oncol. 2002;80:119–120. doi: 10.1002/jso.10114. [DOI] [PubMed] [Google Scholar]
- 31.Mori D., Shibaki M., Masuda M., Yamasaki F. Quantitative measurement of venous invasion of colorectal cancer with metachronous liver metastasis. Histopathology. 2009;55:654–659. doi: 10.1111/j.1365-2559.2009.03428.x. [DOI] [PubMed] [Google Scholar]
- 32.Shen L., Kondo Y., Rosner G.L., Xiao L., Hernandez N.S., Vilaythong J., Houlihan P.S., Krouse R.S., Prasad A.R., Einspahr J.G., Buckmeier J., Alberts D.S., Hamilton S.R., Issa J.P. MGMT promoter methylation and field defect in sporadic colorectal cancer. J Natl Cancer Inst. 2005;97:1330–1338. doi: 10.1093/jnci/dji275. [DOI] [PubMed] [Google Scholar]
- 33.Eisen M.B., Spellman P.T., Brown P.O., Botstein D. Cluster analysis and display of genome-wide expression patterns. Proc Natl Acad Sci U S A. 1998;95:14863–14868. doi: 10.1073/pnas.95.25.14863. [DOI] [PMC free article] [PubMed] [Google Scholar]
- 34.Liu L., Broaddus R.R., Yao J.C., Xie S., White J.A., Wu T.T., Hamilton S.R., Rashid A. Epigenetic alterations in neuroendocrine tumors: methylation of RAS-association domain family 1, isoform A and p16 genes are associated with metastasis. Mod Pathol. 2005;18:1632–1640. doi: 10.1038/modpathol.3800490. [DOI] [PubMed] [Google Scholar]
- 35.Kim Y.H., Petko Z., Dzieciatkowski S., Lin L., Ghiassi M., Stain S., Chapman W.C., Washington M.K., Willis J., Markowitz S.D., Grady W.M. CpG island methylation of genes accumulates during the adenoma progression step of the multistep pathogenesis of colorectal cancer. Genes Chromosomes Cancer. 2006;45:781–789. doi: 10.1002/gcc.20341. [DOI] [PubMed] [Google Scholar]
- 36.Barault L., Charon-Barra C., Jooste V., de la Vega M.F., Martin L., Roignot P., Rat P., Bouvier A.M., Laurent-Puig P., Faivre J., Chapusot C., Piard F. Hypermethylator phenotype in sporadic colon cancer: study on a population-based series of 582 cases. Cancer Res. 2008;68:8541–8546. doi: 10.1158/0008-5472.CAN-08-1171. [DOI] [PubMed] [Google Scholar]
- 37.Ogino S., Nosho K., Kirkner G.J., Kawasaki T., Meyerhardt J.A., Loda M., Giovannucci E.L., Fuchs C.S. CpG island methylator phenotype, microsatellite instability: BRAF mutation and clinical outcome in colon cancer. Gut. 2009;58:90–96. doi: 10.1136/gut.2008.155473. [DOI] [PMC free article] [PubMed] [Google Scholar]
- 38.Kim J.H., Shin S.H., Kwon H.J., Cho N.Y., Kang G.H. Prognostic implications of CpG island hypermethylator phenotype in colorectal cancers. Virchows Arch. 2009;455:485–494. doi: 10.1007/s00428-009-0857-0. [DOI] [PubMed] [Google Scholar]
- 39.Samowitz W.S., Sweeney C., Herrick J., Albertsen H., Levin T.R., Murtaugh M.A., Wolff R.K., Slattery M.L. Poor survival associated with the BRAF V600E mutation in microsatellite-stable colon cancers. Cancer Res. 2005;65:6063–6069. doi: 10.1158/0008-5472.CAN-05-0404. [DOI] [PubMed] [Google Scholar]
- 40.Dahlin A.M., Palmqvist R., Henriksson M.L., Jacobsson M., Eklof V., Rutegard J., Oberg A., Van Guelpen B.R. The role of the CpG island methylator phenotype in colorectal cancer prognosis depends on microsatellite instability screening status. Clin Cancer Res. 2010;16:1845–1855. doi: 10.1158/1078-0432.CCR-09-2594. [DOI] [PubMed] [Google Scholar]
- 41.Sanchez J.A., Krumroy L., Plummer S., Aung P., Merkulova A., Skacel M., DeJulius K.L., Manilich E., Church J.M., Casey G., Kalady M.F. Genetic and epigenetic classifications define clinical phenotypes and determine patient outcomes in colorectal cancer. Br J Surg. 2009;96:1196–1204. doi: 10.1002/bjs.6683. [DOI] [PubMed] [Google Scholar]
- 42.Yagi K., Akagi K., Hayashi H., Nagae G., Tsuji S., Isagawa T., Midorikawa Y., Nishimura Y., Sakamoto H., Seto Y., Aburatani H., Kaneda A. Three DNA methylation epigenotypes in human colorectal cancer. Clin Cancer Res. 2010;16:21–33. doi: 10.1158/1078-0432.CCR-09-2006. [DOI] [PubMed] [Google Scholar]
- 43.Chen J., Rocken C., Lofton-Day C., Schulz H.U., Muller O., Kutzner N., Malfertheiner P., Ebert M.P. Molecular analysis of APC promoter methylation and protein expression in colorectal cancer metastasis. Carcinogenesis. 2005;26:37–43. doi: 10.1093/carcin/bgh280. [DOI] [PubMed] [Google Scholar]
- 44.Ogino S., Cantor M., Kawasaki T., Brahmandam M., Kirkner G.J., Weisenberger D.J., Campan M., Laird P.W., Loda M., Fuchs C.S. CpG island methylator phenotype (CIMP) of colorectal cancer is best characterised by quantitative DNA methylation analysis and prospective cohort studies. Gut. 2006;55:1000–1006. doi: 10.1136/gut.2005.082933. [DOI] [PMC free article] [PubMed] [Google Scholar]
- 45.Shen L., Toyota M., Kondo Y., Lin E., Zhang L., Guo Y., Hernandez N.S., Chen X., Ahmed S., Konishi K., Hamilton S.R., Issa J.P. Integrated genetic and epigenetic analysis identifies three different subclasses of colon cancer. Proc Natl Acad Sci U S A. 2007;104:18654–18659. doi: 10.1073/pnas.0704652104. [DOI] [PMC free article] [PubMed] [Google Scholar]
- 46.Esteller M., Toyota M., Sanchez-Cespedes M., Capella G., Peinado M.A., Watkins D.N., Issa J.P., Sidransky D., Baylin S.B., Herman J.G. Inactivation of the DNA repair gene O6-methylguanine-DNA methyltransferase by promoter hypermethylation is associated with G to A mutations in K-ras in colorectal tumorigenesis. Cancer Res. 2000;60:2368–2371. [PubMed] [Google Scholar]
- 47.Esteller M., Risques R.A., Toyota M., Capella G., Moreno V., Peinado M.A., Baylin S.B., Herman J.G. Promoter hypermethylation of the DNA repair gene O(6)-methylguanine-DNA methyltransferase is associated with the presence of G: C to A:T transition mutations in p53 in human colorectal tumorigenesis. Cancer Res. 2001;61:4689–4692. [PubMed] [Google Scholar]
- 48.Halford S., Rowan A., Sawyer E., Talbot I., Tomlinson I. O(6)-methylguanine methyltransferase in colorectal cancers: detection of mutations, loss of expression, and weak association with G:C>A:T transitions. Gut. 2005;54:797–802. doi: 10.1136/gut.2004.059535. [DOI] [PMC free article] [PubMed] [Google Scholar]
- 49.Nosho K., Kawasaki T., Ohnishi M., Suemoto Y., Kirkner G.J., Zepf D., Yan L., Longtine J.A., Fuchs C.S., Ogino S. PIK3CA mutation in colorectal cancer: relationship with genetic and epigenetic alterations. Neoplasia. 2008;10:534–541. doi: 10.1593/neo.08336. [DOI] [PMC free article] [PubMed] [Google Scholar]
- 50.Chambers A.F., Matrisian L.M. Changing views of the role of matrix metalloproteinases in metastasis. J Natl Cancer Inst. 1997;89:1260–1270. doi: 10.1093/jnci/89.17.1260. [DOI] [PubMed] [Google Scholar]
- 51.Bai Y.X., Yi J.L., Li J.F., Sui H. Clinicopathologic significance of BAG1 and TIMP3 expression in colon carcinoma. World J Gastroenterol. 2007;13:3883–3885. doi: 10.3748/wjg.v13.i28.3883. [DOI] [PMC free article] [PubMed] [Google Scholar]
- 52.Wu X.R., Lin J.H., Walz T., Haner M., Yu J., Aebi U., Sun T.T. Mammalian uroplakins: a group of highly conserved urothelial differentiation-related membrane proteins. J Biol Chem. 1994;269:13716–13724. [PubMed] [Google Scholar]
- 53.Matsumoto K., Satoh T., Irie A., Ishii J., Kuwao S., Iwamura M., Baba S. Loss expression of uroplakin III is associated with clinicopathologic features of aggressive bladder cancer. Urology. 2008;72:444–449. doi: 10.1016/j.urology.2007.11.128. [DOI] [PubMed] [Google Scholar]
- 54.Nakayama H., Hibi K., Taguchi M., Takase T., Yamazaki T., Kasai Y., Ito K., Akiyama S., Nakao A. Molecular detection of p16 promoter methylation in the serum of colorectal cancer patients. Cancer Lett. 2002;188:115–119. doi: 10.1016/s0304-3835(01)00839-4. [DOI] [PubMed] [Google Scholar]
- 55.Esteller M., Gonzalez S., Risques R.A., Marcuello E., Mangues R., Germa J.R., Herman J.G., Capella G., Peinado M.A. K-ras and p16 aberrations confer poor prognosis in human colorectal cancer. J Clin Oncol. 2001;19:299–304. doi: 10.1200/JCO.2001.19.2.299. [DOI] [PubMed] [Google Scholar]
- 56.Van Rijnsoever M., Elsaleh H., Joseph D., McCaul K., Iacopetta B. CpG island methylator phenotype is an independent predictor of survival benefit from 5-fluorouracil in stage III colorectal cancer. Clin Cancer Res. 2003;9:2898–2903. [PubMed] [Google Scholar]
- 57.Ward R.L., Cheong K., Ku S.L., Meagher A., O'Connor T., Hawkins N.J. Adverse prognostic effect of methylation in colorectal cancer is reversed by microsatellite instability. J Clin Oncol. 2003;21:3729–3736. doi: 10.1200/JCO.2003.03.123. [DOI] [PubMed] [Google Scholar]
- 58.Shen L., Catalano P.J., Benson A.B., III, O'Dwyer P., Hamilton S.R., Issa J.P. Association between DNA methylation and shortened survival in patients with advanced colorectal cancer treated with 5-fluorouracil based chemotherapy. Clin Cancer Res. 2007;13:6093–6098. doi: 10.1158/1078-0432.CCR-07-1011. [DOI] [PMC free article] [PubMed] [Google Scholar]
- 59.Walther A., Johnstone E., Swanton C., Midgley R., Tomlinson I., Kerr D. Genetic prognostic and predictive markers in colorectal cancer. Nat Rev Cancer. 2009;9:489–499. doi: 10.1038/nrc2645. [DOI] [PubMed] [Google Scholar]
- 60.Nowell P.C. The clonal evolution of tumor cell populations. Science. 1976;194:23–28. doi: 10.1126/science.959840. [DOI] [PubMed] [Google Scholar]
- 61.Fidler I.J., Kripke M.L. Metastasis results from preexisting variant cells within a malignant tumor. Science. 1977;197:893–895. doi: 10.1126/science.887927. [DOI] [PubMed] [Google Scholar]
- 62.Ramaswamy S., Ross K.N., Lander E.S., Golub T.R. A molecular signature of metastasis in primary solid tumors. Nat Genet. 2003;33:49–54. doi: 10.1038/ng1060. [DOI] [PubMed] [Google Scholar]
Associated Data
This section collects any data citations, data availability statements, or supplementary materials included in this article.
Supplementary Materials
MSP data for ANK1 (A) and CYBRD1 (B) in the colorectal cancer samples. DNA methylation examined by pyrosequencing analysis (Pyroseq) and MSP is indicated below the gels (%). Positive controls were SssI-treated DNA (SssI) for the methylated form, and GenomiPhi-treated DNA for the unmethylated form (Gen). Band intensity of MSP analysis were quantified using the BioRad image analyser. Ratios of M/M+UM (%) were calculated for each sample. DNA methylation status assessed by pyrosequencing and MSP analyses are concordant (R2 = 0.84 and 0.94 in A and B, respectively). M, methylated form; UM, unmethylated form; PL, normal peripheral lymphocytes; RKO, colon cancer cell line.