

Abstract
Intracerebral hemorrhage (ICH) is a subtype of stroke with high rates of morbidity and mortality. Caveolin-1 (Cav-1) is the main structural protein of caveolae and is involved in regulating signal transduction and cholesterol trafficking in cells. Although a recent study suggests a protective role of Cav-1 in cerebral ischemia, its function in ICH remains unknown. In this study, we examined the role of Cav-1 and in a model of collagenase-induced ICH and in neuronal cultures. Our results indicate that Cav-1 was up-regulated in the perihematomal area predominantly in endothelial cells. Cav-1 knockout mice had smaller injury volumes, milder neurologic deficits, less brain edema, and neuronal death 1 day after ICH than wild-type mice. The protective mechanism in Cav-1 knockout mice was associated with marked reduction in leukocyte infiltration, decreased expression of inflammatory mediators, including macrophage inflammatory protein (MIP)-2 and cyclooxygenase (COX)-2, and reduced matrix metalloproteinase-9 activity. Deletion of Cav-1 also suppressed heme oxygenase-1 expression and attenuated reactive oxygen species production after ICH. Moreover, deletion or knockdown of Cav-1 decreased neuronal vulnerability to hemin-induced toxicity and reduced heme oxygenase (HO)-1 induction in vitro. These data suggest that Cav-1 plays a deleterious role in early brain injury after ICH. Inhibition of Cav-1 may provide a novel therapeutic approach for the treatment of hemorrhagic stroke.
Intracerebral hemorrhage (ICH) accounts for approximately 10% to 15% of all strokes but results in disproportionally high rates of mortality and morbidity.1 Despite its importance, effective treatment remains unsatisfactory, and the pathogenesis of ICH-induced brain damage is not completely understood.
Caveolin-1 (Cav-1) is the main structural protein of caveolae, which are micro-invaginations of the cell plasma membrane.2 Cav-1 is responsible for regulating various signaling molecules and participates in cellular cholesterol transport and homeostasis.2,3 However, increasing evidence suggests an important role for Cav-1 in the injured brain. Cav-1 expression is involved in N-methyl-D-aspartate receptor activation and protects against cell death in primary cortical neurons.4 Cav-1 knockout (KO) mice exhibit a number of motor,5 emotional, and memory abnormalities,6 as well as increased cerebral infarct size in response to cerebral ischemia.7 In addition, Cav-1 mutations are associated with increased risk of Alzheimer's disease.8 Although there is not a complete understanding of the mechanism by which Cav-1 affects the injured brain, several studies support its role in regulating heme oxygenase (HO)-1, the rate-limiting enzyme in heme degradation and a vital factor involved in the outcome of ICH. Heme catabolism by HO-1 produces ferrous iron, biliverdin, and carbon monoxide.9 Previous studies have indicated that heme and its degradation products were toxic after ICH,10 and inhibition or deletion of the heme degradation enzyme reduced ICH-induced brain injury.11,12 Cav-1 interacted with and regulated the activity of HO-1 in pulmonary endothelial cells. Cav-1 deletion also protected against oxidative lung injury via modulation of HO-1 activity.13 Furthermore, ICH is associated with infiltration of circulating immune cells and the release of inflammatory mediators, which contribute to the breakdown of blood-brain barrier, secondary neuronal damage, and brain edema formation.14,15 Cav-1 has also been shown to be involved in the pathogenesis of inflammation-induced tissue injury. Cav-1 deletion reduced monocyte chemoattractant protein 1 (MCP-1) up-regulation in both endothelial cells and the mouse vasculature16 and protected against lung inflammation by inhibiting nuclear factor kappa B activation17 and down-regulating pro-inflammatory proteins.18
In the present study, we investigated the role of Cav-1 and its underlying mechanisms in the pathogenesis of mouse ICH. The focus of this study was on early brain injury because half of human mortality after ICH occurs from brain herniation within the first 2 days after injury.1
Materials and Methods
Animals
Eight-week-old male wild-type (WT) C57BL/6 and Cav-1 KO mice were purchased from The Jackson Laboratory (Bar Harbor, ME). All animal procedures were approved by the Animal Research Committee at Academia Sinica and Cheng Hsin General Hospital, and all procedures conformed to the Guide for the Care and Use of Laboratory Animals by the US National Institutes of Health (Publication No. 85-23, revised 1996). All mice were subjected to genotyping for Cav-1 by polymerase chain reaction (PCR) on tail biopsy specimens.
Human Brain Tissue
Paraffin-embedded human brain sections of basal ganglion tissue were obtained from the Brain Bank of Department of Pathology, Cheng Hsin General Hospital, Taiwan. Three subjects who underwent craniotomy after acute hemorrhagic stroke (one female and two males, aged 63 to 70 years) were included in the study. Normal control brains sections of three subjects (one female and two males, aged 60 to 70 years) were obtained from the National Institute of Child Health and Human Development Brain and Tissue Bank for Developmental Disorders (University of Maryland, Baltimore, MD). This study was approved by the Institutional Review Board of the Cheng Hsin General Hospital.
ICH Model
The procedure for inducing ICH in mice was adapted from a method that has been previously described.19 Briefly, mice were intraperitoneally anesthetized with sodium pentobarbital (65 mg/kg; Rhone Merieux, Harlow, UK) and placed in a stereotaxic head frame (Stoelting, Kiel, WI). After retracting the scalp, a dental drill-trephine was used to make a 1.0-mm burr hole, 0.8 mm anterior to the bregma and 2.5 mm to the right of midline. To induce ICH, a 30-gauge needle on a Hamilton syringe was implanted into the caudate putamen with the use of the following stereotactic coordinates: 0.8 mm anterior to bregma and 2.5 mm right lateral to the midline, 2.5 mm in depth. Bacterial collagenase (type VII-S; Sigma, St. Louis, MO; 0.075 U in 0.5 μL of saline) was infused into the brain at a rate of 0.1 μL/min over 5 minutes with an infusion pump (KDS 310; KD Scientific Inc., Holliston, MA), and the needle was left in place for an additional 30 minutes to prevent reflux. After removal of the needle, the craniotomy was sealed with bone wax, the scalp was sutured closed, and mice were allowed to recover. Sham-operated mice received an equal volume of sterile physiologic saline in the same manner. Rectal temperature was maintained at 37°C ± 0.5°C by an electronic thermostat-controlled warming blanket throughout the experimental and recovery periods. Testing after ICH for both WT and Cav-1 KO mice was as follows: i) neurologic scoring at 1 day (n = 6/group); ii) hemoglobin assay at 6 and 24 hours (n = 6/group); iii) coagulation test, histology, brain water content, Western blot analysis, gelatin gel zymography, and enzyme-linked immunosorbent assay at 1 day (n = 6/group); iv) real-time quantitative reverse transcriptase PCR at 1, 3, 6, 12, and 24 hours (n = 7/group). Thirty-six additional sham-operated WT and Cav-1 KO mice were used for histology, Western blot, or enzyme-linked immunosorbent assay and reverse transcriptase PCR analysis (n = 6 for each group). To evaluate the role of HO-1 in nitrotyrosine (NT) expression, an HO-1 inhibitor, tin-mesoporphyrin IX (Frontier Scientific Inc., Logan, UT), was given in an additional group of WT mice. A subcutaneous osmotic minipump (Alzet model 1003D; Alza, Palo Alto, CA) was implanted 2 days before ICH induction to deliver vehicle (10% dimethyl sulfoxide) or tin-mesoporphyrin IX (30 μmole/kg/d),20 for up to 1 day after ICH (n = 5 for each group). The total systemic circulation time of HO-1 inhibitor or vehicle was 72 hours in mice. Mice were sacrificed 1 day after ICH for immunohistochemical analyses. All behavioral, anatomical, and biochemical measurements and analyses described below were done blind, before decoding samples.
Neurologic Functional Evaluation
Modified neurologic severity scores were assessed before and at 1 day after ICH or sham operation. The modified neurologic severity score is a composite of motor, sensory, reflex, and balance tests.21 One point was scored for the inability to perform the test or for the lack of a tested reflex; thus, the higher the score, the more severe the injury. Neurologic function was graded on a scale of 0 to 18 (normal score, 0; maximal deficit score, 18).
Hemoglobin Assay
The hemoglobin content of ICH brains was quantified with a spectrophotometric assay as previously described.12 Both the ipsilateral and contralateral caudate putamen regions were collected from mice that had been subjected to complete transcardial perfusion for the removal of intravascular blood. Distilled water (300 μl) was added to each hemisphere, followed by homogenization for 30 seconds, sonication on ice with an ultrasonicator for 1 minute, and centrifugation at 13,000 rpm for 30 minutes. Drabkin reagent (80 μL; Sigma) was added to a 20-μL aliquot of supernatant (which contains the hemoglobin), and allowed to stand for 15 minutes at room temperature. Fifteen minutes later the optical density of the solution was measured at a wavelength of 540 nm to assess the concentration of cyanmethemoglobin. To generate a standard curve, blood was obtained by cardiac puncture of anesthetized control mice. Incremental volumes of this blood (0, 0.5, 1.0, 2.0, 4.0, and 8.0 μL) were then added to 300 μL of lysate from the tissue of normal hemispheric sample.
Coagulation Tests
Extrinsic and intrinsic coagulation pathways were examined by measuring prothrombin time (PT) and activated partial thromboplastin time (aPTT), respectively. After anesthesia, venous blood was collected via direct right atrial puncture. Plasma from citrated blood (3.2% sodium citrate, 1/10) was extracted by a 5-minute centrifugation (2600 × g at 4°C) and stored immediately at −80°C until analysis. PT and aPTT were assessed by an analyzer (Sysmex CA-1500, Automated Blood Coagulation Analyzer; Sysmex Corporation, Kobe, Japan) with the use of the appropriate PT and aPTT reagents (Siemens Health Care Diagnostics Products, Marburg, Germany).
Tissue Processing and Histology
After terminal anesthesia, mice were processed for histology by being perfused transcardially with phosphate-buffered saline followed by 4% paraformaldehyde. All solutions were maintained at pH 7.4 and 4°C. Brains were removed and postfixed in 4% paraformaldehyde overnight and transferred to phosphate-buffered saline that contained 30% sucrose and 0.1% sodium azide (Sigma) for cryoprotection. Coronal sections were cut in a cryostat at 10 μm from the level of the olfactory bulbs to the visual cortex and were used for Luxol fast blue and cresyl violet histology, Fluoro-Jade B (FJB) staining, terminal deoxynucleotidyl transferase-mediated dUTP-biotin nick-end labeling (TUNEL) staining, or immunohistochemistry.
Hemorrhagic Injury and Hemispheric Enlargement Analysis
The hemorrhagic injury volume and hemispheric enlargement were quantified with the use of the coronal sections stained with Luxol fast blue and cresyl violet at 20 rostral–caudal levels that were spaced 200 μm apart. Sections were digitized and analyzed with the use of a 1.5× objective and Image J software (National Institutes of Health, Bethesda, MD). The injury area was calculated with all images of Luxol fast blue and cresyl violet sections that contained hematoma as previously described,22 and the volume measurement was computed by summation of the areas multiplied by the interslice distance (200 μm). Brain edema was measured by the percentage of hemispheric enlargement, which was calculated by the following formula: [(ipsilateral hemisphere volume − contralateral hemisphere volume)/contralateral hemisphere volume] × 100.23
Brain Water Content
Brain water content represents the brain edema, which forms in consequence of blood-brain barrier breakdown and perihematoma inflammation. Both WT and Cav-1 KO mice were re-anesthetized and decapitated 1 day after ICH. The brains were immediately removed and divided into five parts, consisting of the ipsilateral and contralateral cortex, the ipsilateral and contralateral basal ganglia, and the cerebellum (which served as internal control). Brain samples were immediately weighed on an electric analytical balance to obtain the wet weight and then dried at 100°C for 24 hours to obtain the dry weight. The following formula was used for calculation: (wet weight − dry weight)/wet weight × 100%.
FJB Histochemistry
FJB is a polyanionic fluorescein derivative that sensitively and specifically binds to degenerating neurons. Staining was done as previously described.21 Briefly, sections were initially incubated in a solution of 1% NaOH in 80% ethanol for 5 minutes and then hydrated in graded ethanol (75%, 50%, and 25%; 5 minutes, respectively) and distilled water. They were incubated in a solution of 0.06% potassium permanganate for 15 minutes, rinsed in distilled water for 2 minutes, and incubated in a 0.001% solution of FJB (Chemicon, Temecula, CA) for 30 minutes. Sections were observed and photographed under a fluorescence microscope (Olympus BX-51; Olympus, Tokyo, Japan) with blue (450∼490 nm) excitation light.
TUNEL Staining
TUNEL assay was performed with a commercial kit that labels DNA strand breaks with fluorescein isothiocyanate (In situ Cell Death Detection Kit; Roche Molecular Biochemicals, Mannheim, Germany). Sections were pretreated with 20 μg/mL proteinase-K in 10 mmol/L Tris-HCl at 37°C for 15 minutes. The slices were then washed in distilled water and phosphate-buffered saline and incubated in 0.3% hydrogen peroxide solution. Each section was incubated with 50 μL of TUNEL reaction mixture, including terminal deoxynucleotidyl transferase for 60 minutes at 37°C in humidified condition. Sections were observed and photographed under a fluorescence microscope (Olympus BX-51) with blue (450∼490 nm) excitation light. Negative controls were obtained by omission of the enzyme terminal deoxynucleotidyl transferase.
Immunohistochemistry
Immunohistochemical analyses were carried out as previously described.21 After quenching of endogenous peroxidase activity and blocking of nonspecific binding, sections were put into reaction with the primary antibodies anti-NT [peroxynitrite (ONOO−) marker] and anti-myeloperoxidase (MPO; neutrophil marker) (Table 1) at 4°C overnight. The further colorimetric detection was processed according to the instructions of the Vectastain Elite ABC Kit (Vector Laboratories, Burlingame, CA) with the use of diaminobenzidine as the peroxidase substrate. The specificity of staining reaction was assessed in several control procedures, including omission of the primary antibody and substitution of the primary antibody with nonimmune rabbit serum.
Table 1.
Antibodies Used in Immunohistochemistry, Immunofluorescence, and Western Blot
| Primary antibody | Commercial source | Catalog no. | Species | Antibody type | Working concentration |
|---|---|---|---|---|---|
| Caveolin-1 (N-20) | Santa Cruz Biotechnology | sc-894 | Rabbit | Polyclonal | IF 1:50 |
| WB 1:1000 | |||||
| Caveolin-1 | Upstate | 05-762 | Mouse | Monoclonal, IgG2b | IF 1:50 |
| Caveolin-1 | BD | 610407 | Mouse | Monoclonal, IgG1 | IF 1:50 |
| NeuN | Chemicon | MAB377B | Mouse | Monoclonal, IgG1 | IF 1:200 |
| CD31 | BD | 553370 | Rat | Monoclonal, IgG2a, κ | IF 1:50 |
| GFAP | Zymed | 13-0300 | Rat | Monoclonal, IgG2a, κ | IF 1:400 |
| Iba1 | Wako | 016-20001 | Rabbit | Polyclonal | IF 1:1000 |
| HO-1 | Stressgen | SPA-895 | Rabbit | Polyclonal | IF 1:400 |
| WB 1:1000 | |||||
| NTi | Upstate | 06-284 | Rabbit | Polyclonal | IHC 1:200 |
| MPO | Dako | A0398 | Rabbit | Polyclonal | IHC 1:1000 |
| COX-2 | Cayman | 160106 | Rabbit | Polyclonal | WB 1:1000 |
| α-tubulin | Santa Cruz Biotechnology | SC-23948 | Mouse | Monoclonal, IgG1 | WB 1:5000 |
IF, immunofluorescence; WB, Western blotting; IgG2b, immunoglobulin G2b; NeuN, neuronal nuclei antigen (neuron marker); CD31, endothelial cell marker; GFAP, glial fibrillary acidic protein (astrocyte marker); Iba1, ionized calcium binding adaptor molecule 1 (microglia marker); HO-1, heme-oxygenase-1; NT, nitrotyrosine, peroxynitrite (ONOO−) marker; IHC, immunohistochemistry; MPO, myeloperoxidase (neutrophil marker); COX-2, cyclooxygenase-2.
To assess the cellular source of Cav-1 and co-localization of HO-1 with Cav-1, double immunofluorescence labeling was performed by simultaneous incubation of anti–Cav-1 with anti-neuronal nuclei antigen (neuron marker), anti-CD31 (endothelial cell marker), anti-glial fibrillary acidic protein (astrocyte marker), anti-ionized calcium binding adaptor molecule 1 (microglia marker), or anti–HO-1 (Table 1). Sections were incubated overnight at 4°C with anti–Cav-1 antibody plus one of the antibodies to a specific cellular marker or anti–HO-1. Sections were then washed and incubated with Alexa Fluor 488 and Alexa Fluor 594 (1:400; Molecular Probes, Eugene, OR) for 2 hours. All sections were observed and photographed under a fluorescence microscope (Olympus BX-51).
Quantification of FJB, TUNEL, NT, and MPO Stainings
FJB, TUNEL, NT, and MPO stainings were quantified on stained sections at the level of 0.24 mm from the bregma. Three sections per animal were viewed and photographed under a microscope. FJB-, TUNEL-, NT-, and MPO-positive cells were counted by sampling an area of 700 × 900 μm2 immediately adjacent to the hematoma in four fields with the use of a magnification of ×200 in three sections per animal. FJB-, MPO-, and NT-positive cells were expressed as cells/field. Quantification of TUNEL staining was expressed as the percentage of nuclei that were stained by the TUNEL method divided by the total number of DAPI–stained nuclei.
Western Blot Analysis
Both WT and Cav-1 KO mice were re-anesthetized and decapitated 1 day after ICH or sham operation for Western blot analysis. A 2-mm coronal section was taken either from the hemorrhagic (ipsilateral) or the contralateral hemisphere and then homogenized in ice-cold protein extraction reagents (T-PER reagent; Pierce Biotechnology, Rockford, IL) with a complete mini protease inhibitor cocktail (Roche Molecular Biochemicals). Cells were lysed with M-PER mammalian protein extraction reagent (Pierce Biotechnology) and protease inhibitor cocktail (Roche Molecular Biochemicals). Western blots were performed as previously described.24 Briefly, equal amount of protein was separated by sodium dodecyl sulfate-polyacrylamide gel, transferred to Immobilon-P membranes (Millipore, Billerica, MA), blocked with the use of 5% milk in phosphate-buffered saline containing 0.1% Tween-20, and probed with primary antibodies against Cav-1, HO-1, matrix metalloproteinase (MMP)−9, cyclooxygenase 2 (COX-2) and α-tubulin (Table 1) at 4°C overnight. Afterward, the membranes were washed and incubated with horseradish peroxidase–linked anti-rabbit or anti-mouse secondary antibodies (Santa Cruz Biotechnology, Santa Cruz, CA; 1:1000) for 2 hours. The relative intensity of protein signals was normalized to the corresponding α-tubulin intensity and was quantified by densitometric analysis with the use of ImageQuant software (Amersham Biosciences, Buckinghamshire, UK).
Gelatin Gel Zymography
Brains from both WT and Cav-1 KO mice were removed without fixation after cervical dislocation 1 day after ICH. Zymography was performed as previously described.19 Briefly, similarly prepared protein samples (as in Western blots) were equally loaded and separated by 10% Tris-glycine gel with 0.1% gelatin as substrate. After separation, the gel was washed in distilled water twice for 30 minutes and renatured with 2.5% Triton X-100 buffer for 1 hour at room temperature. After incubating with developing buffer (0.05 M Tris-HCl pH 7.5, 0.2 mol/L NaCl, 5 mmol/L CaCl2, 0.05% Brij-35, 0.2 mmol/L NaN3) at 37°C for 24 hours, the gel was stained with 0.05% Coomassie R-250 dye (Sigma) for 30 minutes and appropriately destained. Gelatinolytic activity (MMP-9, ∼97 kDa; MMP-2, ∼72 kDa) was determined as showing clear bands at the appropriate molecular weights.
Real-Time Quantitative RT-PCR
Brains from both WT and Cav-1 KO mice were removed without fixation after cervical dislocation at 1, 3, 6, 12, and 24 hours after ICH or sham operation. A 2-mm coronal section was either taken from the hemorrhagic (ipsilateral) or the contralateral hemisphere. Total RNA was extracted from brain tissues with the use of RNeasy Mini Kits (QIAGEN, Valencia, CA) and was subsequently subjected to reverse transcription with SuperScript II RNase H reverse transcriptase (Invitrogen, Carlsbad, CA). Real-time quantitative RT-PCR analysis was performed with an ABI PRISM 7900 sequence detector (Applied Biosystems, Foster City, CA). The primers and probe for Cav-1 (TaqMan Gene Expression Assay ID Mm00483057_ml), HO-1 (Mm00516005_m1), macrophage inflammatory protein 2 (MIP-2; Mm00436450_m1), MCP-1 (Mm00441242_m1), and COX-2 (Mm00478374_m1) were obtained from Applied Biosystems. The endogenous control was β-actin (Rn00607939_s1). Thermal cycling was initiated with a 2-minute incubation at 50°C, followed by a first 10-minute denaturation step at 95°C, and then 40 cycles at 95°C for 15 seconds and at 60°C for 1 minute. Relative quantities of the candidate genes and β-actin rRNA were calculated with the previously described comparative threshold cycle method.21
Enzyme-Linked Immunosorbent Assay
Brains from both WT and Cav-1 KO mice were removed without fixation after cervical dislocation 1 day after ICH or sham operation. Enzyme-linked immunosorbent assay for MIP-2 and MCP-1 in brain homogenates was performed with commercially available kits (R&D Systems, Minneapolis, MN). Tissue homogenates were diluted to correspond with the linear portion of the respective standard curves as determined in preliminary studies. All samples and standards were assayed in duplicate according to the manufacturer's instructions. Tissue chemokine concentrations were expressed as picograms of antigen per milligram of protein.
Primary Cortical Neuron Culture, Hemin Exposure, and Assessment of Cell Viability
All culture medium supplies were from Invitrogen. Cortical neuronal cells were prepared from embryonic day 16 WT and Cav-1 KO mice and cultured in serum-free conditions as previously described.25 Briefly, the cortices were isolated and digested in 0.5 mg/mL papain at 37°C for 15 minutes. The tissue was dissociated in Hibernate-A medium (containing B27 supplement) by aspirating trituration. The cells were then plated onto poly-D-lysine–coated dishes at a density of 5 × 10⁴ cells/cm2 and maintained in Neurobasal medium supplemented with B27, 10 U/mL penicillin, 10 mg/mL streptomycin, and 0.5 mg/mL glutamine. Four days after plating, 50% of the medium was removed and replaced with fresh medium. The cells were cultured at 37°C in a humidified tri-gas incubator (5% O2, 90% N2, and 5% CO2) and were used at 7 days in vitro. The cortical cultures contain mostly neurons, and there were <2% of glia cells as determined by immunohistochemical staining. To examine heme toxicity in neurons, the cultures were exposed to various concentrations (5, 10, 15, or 20 μmol/L) of hemin (Sigma) or to vehicle (0.1% dimethyl sulfoxide) for 24 hours, before being harvested for Western blot and cell survival analyses. Hemin was dissolved in a 50-mmol/L stock solution with dimethyl sulfoxide and was diluted to the desired concentration with fresh medium. The final concentration of dimethyl sulfoxide in the hemin-containing medium was 0.1%.
The cell viability was determined by assessing the degree of 3-[4,5-dimethyl-2-thiazolyl]-2,5-diphenyl-2-tetrazolium bromide (MTT) reduction. Briefly, after hemin treatments, cells were incubated for at 37°C for 2 hours with MTT (0.5 mg/mL final concentration; Sigma). Afterward, a solution of anhydrous isopropanol, HCl (0.1 N), and 0.1% Triton X-100 were added for the dissolution of formazan crystal. The optical density was determined at 570 nm with the use of a microplate reader.26 Cell viability was expressed as a percentage of the control culture. Each experiment was performed in triplicate and repeated 3 times with different batches of primary cultures.
SK-N-MC Cell Culture and Small Interfering RNA Transfection
The human neuroblastoma cell line SK-N-MC was obtained from ATCC (Manassas, VA). The cells were grown as a monolayer in minimum essential medium (Invitrogen) supplemented with fetal bovine serum (10%, v/v), glutamine (10 μg/mL), and antibiotics (penicillin and streptomycin, 10 μg/mL) at 37°C in a humidified atmosphere containing 5% CO2/95% air. A serum-free medium was used while exposing the cells to hemin.
The expression of Cav-1 was suppressed in SK-N-MC cells with the use of targeted small interfering RNA (siRNA; Ambion Inc., Austin, TX). The specific Cav-1 siRNA sequences were as follows: sense, 5′-CCUUCACUGUGACGAAAUATT-3′; antisense, 5′-UAUUUCGUCACAGUGAAGGTG-3′. Cells were transfected with siRNA for 24 hours before hemin administration with the use of lipofectamine RNAiMAX transfection reagent (Invitrogen) according to the manufacturer's protocol. Transfection reagent and nonspecific control siRNA (a scrambled sequence of similar length; Ambion Inc.) served as controls. Knockdown efficiency was assessed by comparing the protein expression levels of cells transfected with a specific siRNA and those transfected with a nonspecific control siRNA as determined by Western blot analysis.
Lentivirus Infection of Primary Cortical Neurons
Lentiviral vectors that encode a scramble sequence [control short hairpin RNA (shRNA)] or target mouse shRNA (Cav-1 shRNA) were purchased from the National RNAi Core Facility, Taiwan. The shRNA sequences targeting mouse Cav-1 are described as follows: Cav-1 shRNA, (1-1) 5′-GACGTGGTCAAGATTGACTTT-3′; Cav-1 shRNA, (661) 5′-CCGCTTGTTGTCTACGATCTT-3′; and Cav-1 shRNA, (663) 5′-TGAAGCTATTGGCAAGATATT-3′. To knockdown Cav-1, primary neurons were infected with lentivirus overnight after 4 days in vitro. The cells were then exposed to hemin for 24 hours after 7 days in vitro. Lentivirus that encoded the scramble sequence was used as a control for knockdown validation. The functional knockdown of protein expression was assessed by Western blot analysis.
Statistical Analyses
Data are presented as mean ± SD. For comparisons among multiple groups, one-way or two-way analysis of variance followed by a post hoc (Bonferroni) test was used to determine significant differences. Differences between two groups were tested with the Student's t-test. Statistical significance was set at P < 0.05.
Results
Increased Cav-1 Protein Expression after ICH
ICH induced an increase in Cav-1 protein level in the WT hemorrhagic hemisphere 1 day after induction. No difference of Cav-1 protein levels was observed between the ipsilateral and contralateral hemispheres of sham-operated WT mice (Figure 1A). Dual-label immunofluorescence showed that Cav-1 mostly co-localized with endothelial cells in the peri-ICH region (Figure 1B). Co-localization of Cav-1 with neurons or microglia was observed, although infrequently. However, there was no co-localization of Cav-1 with astrocytes. Immunofluorescent analysis of the contralateral hemisphere of WT mice showed identical results to that of the hemorrhagic hemisphere (see Supplemental Figure S1 at http://ajp.amjpathol.org). No immunoreactivity was observed in either hemisphere of Cav-1 KO mice after ICH induction (see Supplemental Figures S2 and S3 at http://ajp.amjpathol.org). We further examined Cav-1 expression in the perihematomal area of human patients with ICH and normal controls. Cav-1 was expressed in vascular-like, as well as cellular-like, structure in both patients with ICH and control subjects (see Supplemental Figure S4 at http://ajp.amjpathol.org). Dual-label immunofluorescence confirmed that Cav-1 was co-localized with neurons (see Supplemental Figure S5 at http://ajp.amjpathol.org).
Figure 1.
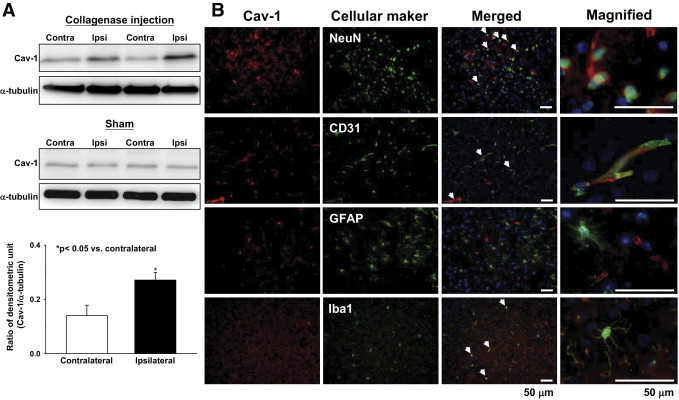
Up-regulation of Cav-1 protein expression in WT brains subjected to ICH. A: Representative immunoblots of the Cav-1 protein in the ipsilateral (hemorrhagic) and contralateral hemispheres from ICH or sham-operated mice, 1 day after collagenase injection. Bar graph of densitometric analysis of bands showing a significant increase in Cav-1 protein level in the ipsilateral hemispheres of WT mice 1 day after ICH, compared with the contralateral hemispheres. B: Identification of Cav-1–positive cells 1 day after ICH in the perihematomal area by double immunofluorescence labeling. Cav-1 immunoreactivity is shown in red, and immunolabeling of neuronal nuclei (NeuN; neurons), CD31 (endothelial cells), GFAP (glial fibrillary acidic protein; astrocytes), or Iba1 (ionized calcium binding adaptor molecule 1; microglia) is shown in green. White arrows indicate co-localization. Cav-1 localized to neurons, endothelial cells, and microglia. Sections were stained with DAPI (blue) to show all nuclei. Scale bars: 50 μm (merged column); 50 μm (inset column).
Cav-1 Deletion Reduces Brain Injury Volume and Neurologic Deficits, But Has No Effect on Collagenase-Induced Bleeding in ICH Mice
To assess whether Cav-1 contributes to ICH, we first examined injury volume in WT and Cav-1 KO 1 day after ICH. The injury volume of Cav-1 KO mice was smaller than in WT mice (10.0 ± 3.2 mm3 vs 15.7 ± 2.0 mm3, P = 0.004; Figure 2A). In addition, significant differences were observed in mortality (P < 0.01). Mortality was reduced in Cav-1 KO mice (2%) compared with WT mice (25%). Similarly, the neurologic deficit 1 day after ICH was less severe in Cav-1 KO mice than in WT mice (7.7 ± 0.5 vs 8.3 ± 0.5, P = 0.049; Figure 2B). Both WT and Cav-1 KO mice subjected to sham surgery did not show any brain lesions and any motor deficits (data not shown).
Figure 2.
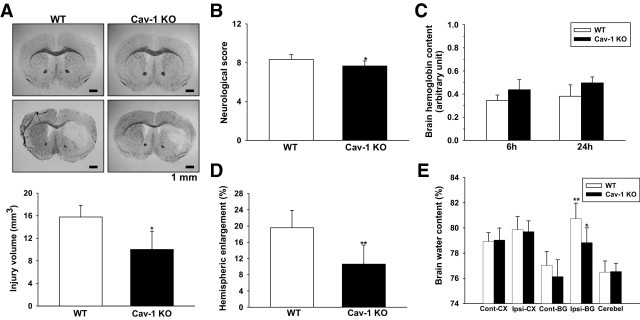
Effect of Cav-1 deletion on brain injury volume, neurologic deficits, collagenous-induced bleeding, and brain edema in mice subjected to ICH. A: Representative sections from WT and Cav-1 KO mice 1 day after sham operation (top) or ICH (bottom) stained with Luxol fast blue/cresyl violet; areas of injury are represented by the lack of staining in the lower panels. Quantification shows significantly smaller brain injury volumes in Cav-1 KO mice, compared with WT mice, 1 day after ICH. Scale bar = 1 mm. *P < 0.05 versus WT mice. B: Neurologic deficits were significantly less severe in Cav-1 KO than in WT mice at day 1. *P < 0.05 versus WT mice. C: Hemoglobin levels in WT and Cav-1 KO mice were not significantly different 6 or 24 hours after ICH. D: Hemispheric enlargement was significantly smaller in Cav-1 KO mice than in WT mice at day 1. **P < 0.01 vs WT mice. E: Brain water content in the ipsilateral basal ganglion of WT and Cav-1 KO mice was significantly higher than in the contralateral basal ganglion 1 day after ICH. In the ipsilateral basal ganglion, brain water content of Cav-1 KO mice was significantly lower than in WT mice. Cerebel, cerebellum; Cont-BG, contralateral basal ganglia; Cont-CX, contralateral cortex; Ipsi-BG, ipsilateral basal ganglia; Ipsi-CX, ipsilateral cortex. *P < 0.05 vs WT mice, **P < 0.01 vs contralateral.
To clarify whether the differences in brain injury volume and neurologic deficits resulted from a difference in original collagenase-induced bleeding, we measured the brain hemoglobin content, as an indicator of the bleeding volume. No significant difference was observed between WT and Cav-1 KO mice 6 or 24 hours after ICH (both P > 0.05; Figure 2C), indicating that reduced brain injury and neurologic deficits were attributed to the absence of Cav-1. No detectable hemorrhage was observed in sham-operated WT or Cav-1 KO mice (Figure 2A). We also examined extrinsic and intrinsic coagulation pathways by measuring PT and aPTT, respectively. No differences were observed between WT and Cav-1 KO mice for PT (10.16 ± 1.43 seconds vs 10.54 ± 1.37 seconds, P = 0.678) or aPTT (31.12 ± 2.95 seconds vs 30.74 ± 2.88 seconds, P = 0.842).
Cav-1 Deletion Reduces Hemispheric Enlargement and Brain Water Content in ICH Mice
To assess whether the reduction in early brain injury in Cav-1 KO mice correlated with reduced brain edema, we examined hemispheric enlargement and brain water content 1 day after ICH. Hemispheric enlargement was significantly smaller in Cav-1 KO mice (10.6% ± 4.7%) than in WT mice (19.6% ± 4.3%, P = 0.006; Figure 2D). In both WT and Cav-1 KO mice, the brain water content in the ipsilateral basal ganglion was significantly higher than in the contralateral counterpart (both P < 0.05; Figure 2E). Compared with WT mice, the Cav-1 KO mice had significantly decreased brain water content in the ipsilateral basal ganglion (78.8% ± 1.2% vs 80.7% ± 1.2%, P = 0.028; Figure 2E).
Cav-1 Deletion Reduces Neuronal and Apoptotic Cell Death in ICH Mice
Both FJB-positive and TUNEL-positive cells were evident 1 day after ICH in and around the hematoma. Cav-1 KO mice had significantly fewer FJB-positive neurons in the peri-ICH region 1 day after ICH than observed in WT mice (70.4 ± 16.5 vs 104.4 ± 30.0 cells/field, P = 0.035; Figure 3A). Likewise, Cav-1 KO hemorrhagic brains showed a reduced percentage of TUNEL-positive cells (11.6% ± 1.9%) compared with WT hemorrhagic brains (16.7% ± 1.1%, P < 0.001; Figure 3B). FJB-positive or TUNEL-positive cells were not observed in the contralateral site but were occasionally observed along the needle track in sham-operated WT and Cav-1 KO mice (data not shown).
Figure 3.
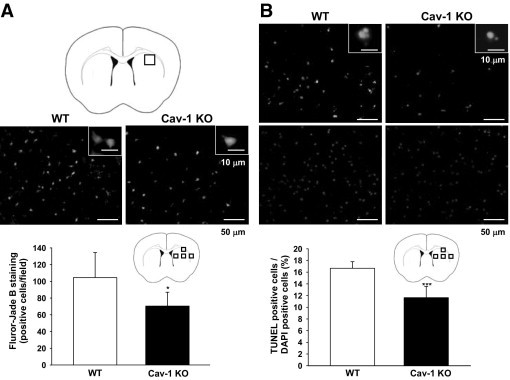
Cav-1 deletion reduced neuronal degeneration and apoptotic cell death in mice subjected to ICH, as evaluated by FJB and TUNEL staining. A: Brain atlas coronal brain section of a core hemorrhagic region at 0.24 mm from the bregma. Quantification analysis indicates that Cav-1 KO mice had significantly fewer degenerating neurons than WT mice, 1 day after ICH. The total number of FJB-positive cells is expressed as the mean number per field of view (0.63 mm2). B: Representative TUNEL (top) and DAPI-stained (bottom) brain sections of a WT and a Cav-1 KO mouse 1 day after ICH. The inset is a representative TUNEL-positive cell at higher magnification. Quantification analysis shows that the percentage of TUNEL-positive cells was significantly lower in the Cav-1 KO than in the WT hemorrhagic brain, 1 day after ICH. The percentage of TUNEL-positive cells is expressed as the percentage of nuclei that were stained by the TUNEL method/the total number of DAPI-stained nuclei. Sections were stained with DAPI (blue) to show all nuclei. Scale bars: 50 μm (A and B); 10 μm (A and B insets). *P < 0.05, ***P < 0.001 vs WT mice.
Cav-1 Deletion Reduces HO-1 Expression and Reactive Oxygen Species Production after ICH
We next explored the mechanism that underlies the protective effect of Cav-1 depletion. ICH induced an increase in HO-1 protein level in the hemorrhagic hemisphere 1 day after ICH induction (Figure 4A). Compared with WT hemorrhagic brains, Cav-1 KO hemorrhagic brains displayed decreased HO-1 protein expression (Figure 4A). There was no increase of HO-1 protein expression in both hemispheres of sham-operated mice and in the contralateral hemisphere of ICH mice (Figure 4A). HO-1 mRNA transcription was also significantly increased in the hemorrhagic hemisphere of the WT groups between 6 and 24 hours (see Supplemental Figure S6 A at http://ajp.amjpathol.org). No significant difference in HO-1 mRNA was observed between the ipsilateral hemisphere of sham-operated mice and the contralateral hemisphere of ICH mice (data not shown). The HO-1 mRNA level was significantly attenuated by Cav-1 deletion (Figure 4B). At 6 and 24 hours after ICH, the HO-1 mRNA levels in Cav-1 KO hemorrhagic brains were 54.6% (P = 0.014) and 31.9% (P = 0.031), respectively, of the level found in WT hemorrhagic brains. Immunofluorescence further showed that there was co-localization of HO-1 and Cav-1 in vascular-like structures and microglia-like cells adjacent to the hematoma site 1 day after ICH (Figure 4C).
Figure 4.
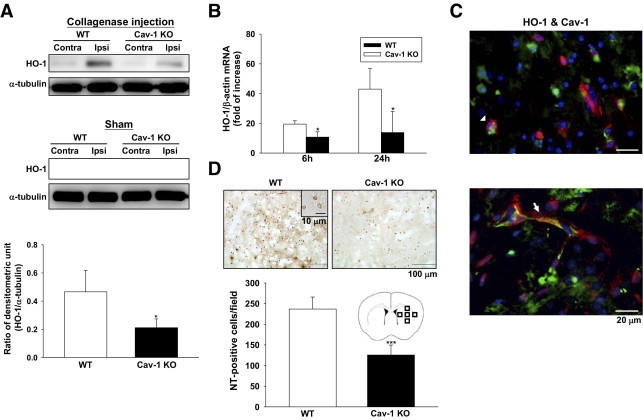
Cav-1 deletion reduced HO-1 expression and reactive oxygen species production in mice subjected to ICH. A: Representative immunoblots of the HO-1 protein in the ipsilateral and contralateral hemispheres from WT and Cav-1 KO mice, 1 day after ICH or sham operation. Bar graph of densitometric analysis of bands showing a significant decrease in HO-1 protein level in the ipsilateral hemispheres of Cav-1 KO mice compared with WT mice, 1 day after ICH. B: Bar graphs show HO-1 mRNA expression in WT and Cav-1 KO mice in the ipsilateral hemispheres 6 and 24 hours after injury. Cav-1 deletion significantly reduced injury-induced HO-1 mRNA expression in the ipsilateral hemispheres 6 and 24 hours after ICH, compared with WT mice. C: Double immunofluorescence labeling of Cav-1 and HO-1 in the perihematomal area of WT mice, 1 day after ICH. Cav-1 immunoreactivity is shown in green, and HO-1 is shown in red. Co-localization of HO-1 and Cav-1 were observed in both microglia/macrophage-like cells (arrowhead) and vascular-like structures (arrow). Sections were stained with DAPI (blue) to show all nuclei. D: Representative NT-stained brain sections of a WT and a Cav-1 KO mouse 1 day after ICH. The inset is a representative NT-positive cell at higher magnification. Cell count analysis indicates that Cav-1 KO mice had significantly fewer NT-positive cells than WT mice, 1 day after ICH. The total number of NT-positive cells is expressed as the mean number per field of view (0.63 mm2). Scale bars: 20 μm (C); 100 μm (D); 10 μm (D inset). Contra, contralateral; Ipsi, ipsilateral. *P < 0.05, ***P < 0.001 vs WT mice.
Because the products of the HO-1 reaction could profoundly influence tissue redox homeostasis,12 we examined the effect of Cav-1 deletion on NT expression, a biomarker of ONOO− production. Cav-1 KO mice had significantly fewer NT-positive cells around the hematoma margin than WT mice 1 day after ICH (125.5 ± 24.2 cells/field vs 237.0 ± 29.0 cells/field, P < 0.001; Figure 4D). NT-positive cells were not observed either in the contralateral site or in the sham-operated mice (data not shown). To further confirm the effect of HO-1 in NT expression, tin-mesoporphyrin IX, an HO inhibitor, was used. Tin-mesoporphyrin IX attenuated NT-positive cells around the hematoma margin compared with the vehicle control group 1 day after ICH (135.5 ± 24.0 cells/field vs 215.8 ± 42.3 cells/field, P = 0.006; see Supplemental Figure S7 at http://ajp.amjpathol.org).
Cav-1 Deletion Reduces Neutrophil Infiltration and MIP-2 and COX-2 Expression But Has No Effect on MCP-1 Expression after ICH
We further assessed whether Cav-1 directly influenced early inflammatory events after ICH. Cav-1 KO mice had significantly fewer neutrophils in the perihematoma area compared with WT mice 1 day after ICH (77.7 ± 7.9 cells/field vs 200.4 ± 30.2 cells/field, P < 0.001; Figure 5A). With regard to inflammatory mediators, ICH induced an increase in MIP-2, MCP-1, and COX-2 protein expression in the hemorrhagic hemispheres of WT and Cav-1 KO mice 1 day after ICH (Figure 5 B and C and Figure 6A). No detectable expression of MIP-2, MCP-1, and COX-2 protein levels were observed in both hemispheres of sham-operated mice and the contralateral hemisphere of ICH mice (data not shown). The Cav-1 KO hemorrhagic hemispheres exhibited significantly reduced MIP-2 and COX-2 protein levels compared with the WT group (MIP-2, 10.1 ± 4.9 pg/mg protein vs 19.5 ± 6.9 pg/mg protein, P = 0.035; Figure 5B; COX-2, P < 0.05; Figure 6A). However, the change in MCP-1 protein level was not significant (Figure 5C). Similarly, levels of MIP-2 and MCP-1 increased significantly in the WT hemorrhagic hemispheres at 6, 12, and 24 hours, and COX-2 increased significantly at 1, 3, and 6 hours after ICH, compared with the contralateral hemispheres (P < 0.05 for all values; see Supplemental Figure S6 at http://ajp.amjpathol.org). No significant difference was observed in MIP-2, MCP-1, and COX-2 mRNA levels between the ipsilateral hemisphere of sham-operated mice and the contralateral hemisphere of ICH mice (data not shown). The increase in MIP-2 and COX-2 mRNA levels was significantly attenuated by Cav-1 deletion. MIP-2 mRNA levels in the Cav-1 KO hemorrhagic hemispheres were 54.0% (P = 0.023) and 50.3% (P = 0.014) of WT at 6 and 24 hours, respectively (Figure 5D). The COX-2 mRNA level in Cav-1 KO hemorrhagic brains was 38.9% (P = 0.014) of WT hemorrhagic brains at 1 hour (Figure 6B). In contrast, the difference of MCP-1 mRNA was not significant (Figure 5E).
Figure 5.
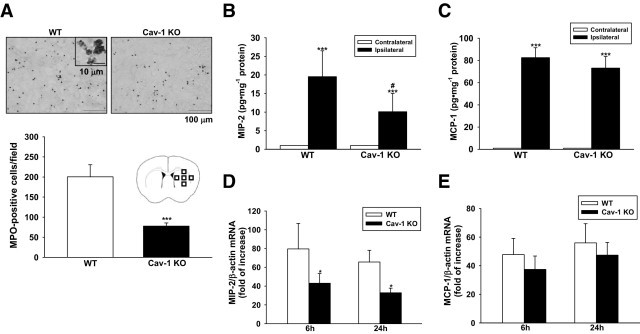
Cav-1 deletion reduced neutrophil infiltration and MIP-2 expression but had no effect on MCP-1 expression in mice subjected to ICH. A: Representative MPO-stained brain sections of a WT and a Cav-1 KO mouse 1 day after ICH. The inset is a representative MPO-positive cell at higher magnification. Cell count analysis indicates that Cav-1 KO mice had significantly fewer infiltrating neutrophils than WT mice, 1 day after ICH. The total number of MPO-positive cells is expressed as the mean number per field of view (0.63 mm2). ***P < 0.001 vs WT mice. Scale bars: 100 μm (A); 10 μm (A insert). B and C: Bar graphs showing MIP-2 and MCP-1 protein concentrations in WT and Cav-1 KO 1 day after ICH. ICH significantly increased MIP-2 and MCP-1 protein levels in both WT and Cav-1 KO mice. The Cav-1 KO hemorrhagic hemispheres exhibited significantly reduced MIP-2 protein level, compared with the WT hemorrhagic hemispheres. However, no significant difference was observed in MCP-1 protein level between the two groups. *P < 0.05 vs WT mice, ***P < 0.001 vs contralateral. D and E: Bar graphs showing MIP-2 and MCP-1 mRNA expression in WT and Cav-1 KO mice 6 and 24 hours after ICH. Cav-1 deletion significantly reduced injury-induced MIP-2 mRNA expression in the ipsilateral hemisphere compared with WT mice 6 and 24 hours after ICH (*P < 0.05 vs WT mice). No significant difference was observed in MCP-1 mRNA expression between the two groups.
Figure 6.
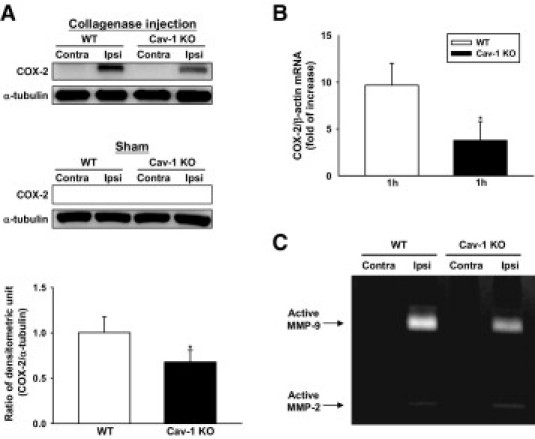
Cav-1 deletion reduced COX-2 expression and MMP-9 enzymatic activity in mice subjected to ICH. A: Representative immunoblots of the COX-2 protein in the ipsilateral and contralateral hemispheres from WT and Cav-1 KO mice 1 day after ICH or sham-operation. Bar graph of densitometric analysis of bands showing a significant decrease of COX-2 protein level in the ipsilateral hemispheres of Cav-1 KO mice 1 day after ICH, compared with WT mice. B: Bar graphs showing that Cav-1 deletion significantly reduced COX-2 expression in the ipsilateral hemispheres compared with WT mice 1 hour after ICH. (C) Representative zymography of the MMP-9 and MMP-2 activity from WT and Cav-1 KO mice 1 day after ICH. The gelatinase activity of MMP-9 was increased in both WT and Cav-1 KO hemorrhagic brains. MMT-9 activity was decreased in Cav-1 KO mice compared with WT mice. Weak MMP-2 gelatinase activity was also observed. Contra, contralateral; Ipsi, ipsilateral. *P < 0.05 vs WT mice.
Cav-1 Deletion Reduces MMP-9 Enzymatic Activity after ICH
MMP-9 activity was significantly increased in both WT and Cav-1 KO hemorrhagic brains 1 day after ICH (Figure 6C). Weak MMP-2 gelatinase activity was also observed in both types of brains. MMP-9 activity was significantly decreased in Cav-1 KO mice compared with WT mice (P < 0.05; data not shown).
Deletion or Knockdown of Cav-1 Increases Cell Survival and Reduces HO-1 Expression after Stimulation with Hemin in Neuronal Cultures
To investigate whether Cav-1 deletion is neuroprotective against hemin-induced toxicity, we applied hemin to the primary neurons from WT and Cav-1 KO mice. MTT assay showed that hemin (10, 15, and 20 μmol/L) stimulation significantly induced, in a concentration-dependent manner, cell viability loss in both WT and Cav-1 KO neuronal cultures (Figure 7A). Cav-1 KO neurons had a decrease in cell death compared with WT neurons (10 μmol/L hemin: 80.4% ± 1.0% vs 67.8% ± 3.7% of control cell viability; 15 μmol/L hemin: 65.4% ± 1.0% vs 56.9 ± 2.2% of control cell viability; 20 μmol/L hemin: 53.3% ± 1.5% vs 43.1% ± 1.1% of control cell viability, all P < 0.05; Figure 7A). Exposure to 15 μmol/L hemin for 24 hours was chosen to induce the HO-1 expression in the subsequent experiment. After hemin exposure, a significant increase in HO-1 was observed in both WT and Cav-1 KO neuronal cultures. Cav-1 KO neurons displayed decreased HO-1 protein expression compared with WT neurons (Figure 7B).
Figure 7.
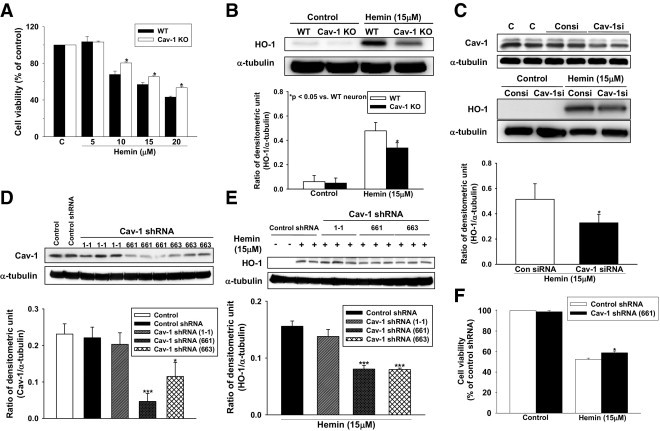
Cav-1 deletion or knockdown increased neuronal survival and reduced HO-1 expression after stimulation with hemin in neuronal culture. A: Bar graphs showing the cell viability of primary neurons after stimulation with various concentrations of hemin, as assessed by MTT assay. Hemin (10, 15, and 20 μmol/L) stimulation significantly induced cell viability loss in both WT and Cav-1 KO neuronal cultures. Cav-1 KO neurons had a significant decrease in cell death compared with WT neurons. *P < 0.05 vs WT neuron. B: Representative immunoblots of the HO-1 protein in the WT and Cav-1 KO neurons after stimulation with 15 μmol/L hemin. Bar graph of densitometric analysis of bands showing a significant decrease of HO-1 protein level in the Cav-1 KO neurons, compared with WT neurons. *P < 0.05 vs WT neuron. C: Representative immunoblots of the HO-1 protein in human neuroblastoma SK-N-MC cells after treatment with Cav-1 siRNA. Bar graph showing a significant decrease of hemin-induced HO-1 protein expression in SK-N-MC cells compared with the control siRNA group. *P < 0.05 vs Con siRNA. D: Bar graph showing that lentiviral–Cav-1 shRNA (661) and (663) effectively suppressed Cav-1 protein expression compared with the lentiviral-control shRNA. *P < 0.05 vs control shRNA, ***P < 0.001 vs control shRNA. E: Representative immunoblots of the HO-1 protein in primary cortical neuron cultures after lentiviral infections. Bar graph showing that the hemin-induced HO-1 expression was significantly attenuated in lentiviral–Cav-1 shRNA (661, 663)–infected neurons. ***P < 0.001 vs control shRNA. F: Bar graphs showing the cell viability of primary neurons after hemin stimulation in the MTT assay. Primary neurons infected with lentiviral–Cav-1 shRNA (661) had a decrease in cell death compared with primary neurons infected with lentiviral-control shRNA. Consi, control siRNA; CAV-1si, Cav-1 siRNA. *P < 0.05 vs control shRNA.
We next assessed the effect of Cav-1 suppression with the use of siRNA-mediated knockdown in human neuroblastoma SK-N-MC cells and lentiviral vector encoded Cav-1 shRNA in primary neurons. After treatment with Cav-1 siRNA, immunoblots showed that hemin-induced HO-1 protein expression in SK-N-MC cells was decreased compared with the control siRNA group (Figure 7C). In the lentiviral-mediated knockdown experiment, Cav-1 shRNA (661) and (663) effectively suppressed Cav-1 protein expression. However, Cav-1 shRNA (1-1) failed to knockdown Cav-1 expression compared with the control group and the lentivirus that encoded the control shRNA group (Figure 7D). Hemin-induced HO-1 expression was attenuated in lentiviral–Cav-1 shRNA (661, 663)–infected neurons (Figure 7E). Lentivirus infection did not induce HO-1 expression in neurons. The MTT assay showed that primary neurons infected with lentiviral–Cav-1 shRNA (661) had a decrease in cell death compared with primary neurons infected with the lentiviral-control shRNA (58.9% ± 1.6% of control cell viability vs 52.4% ± 1.2% of control cell viability, P < 0.05; Figure 7F).
Discussion
In this study, we show that Cav-1 deletion ameliorated neurologic deficits and brain damage, including injury volume, neuronal death, and brain edema, in mice subjected to ICH. Deletion and knockdown of Cav-1 also decreased neuronal vulnerability to hemin-induced toxicity. Our results show that Cav-1 protein was up-regulated in the perihematomal area, predominantly in endothelial cells. Induction of Cav-1 has been reported in a number of neurologic disorders such as cerebral ischemia,7 spinal cord injury,27 and Alzheimer's disease.28 Cav-1 KO mice displayed both motor5 and cognitive6 impairments. Overexpression of Cav-1 in PC12 cells increased expression of synaptophysin and GAP-43, two markers of synaptic plasticity, as well as neurite density.29 These results imply that Cav-1 participates in the regulation of synaptic and nerve terminal remodeling. Although Cav-1 deletion increased the infarction volume after cerebral ischemia,7 our data showed a deleterious role of Cav-1 in ICH. Similar to our results, inhibition of Cav-1 upstream signaling, via Src, reduced secondary damage in a rat spinal cord compression model.30 Clinical observation also suggests that overexpression of Cav-1 is associated with Alzheimer's disease.28 In addition, Cav-1 has been suggested to have both pro-inflammatory and anti-inflammatory roles in the innate immune response.17,18,31,32 Because there are key differences in the pathophysiology between ischemic and hemorrhagic insults (eg, hypoxia-ischemia vs hemin-induced toxicity), these results imply that Cav-1 may play differential roles in response to different pathologic stimuli. In addition, because different animal models have various limitations and reflect only certain clinical features of ICH,33 the current findings need to be confirmed in other ICH models.
The role of HO-1 in brain injury is controversial. Although induction of HO-1 confers cytoprotective functions in ischemic stroke,34,35 our data has shown a detrimental role of HO-1 in an ICH mouse model. During ICH, HO-1 is induced with the release of a tremendous amount of hemoglobin from red blood cells.36 Although the CO generated by HO-1 may reduce the inflammatory response and play a protective role, both heme and its degraded products have been shown to generate reactive oxygen species (ROS) and cause brain damage after ICH.10,15,37 Several lines of evidence have shown a toxic role of HO-1 in the hemorrhagic brains.33 Deletion or inhibition of HO-1 reduced reactive oxygen species generation and leukocyte infiltration and ameliorated brain damage in ICH animal models.11,12,38,39 Attenuation of HO-1 activity reduced heme-mediated neuronal injury in cultured neurons.40,41 Furthermore, an increased HO-1 expression in cerebrospinal fluid is associated with poor neurologic outcome after traumatic brain injury in infants and children.42 Contrary to the results that the induction of HO-1 is neuroprotective against ischemic stroke,34,35 HO-1 knockout does not exacerbate stroke damage in mice.43,44 The detrimental role of HO-1 was further confirmed by our data showing that a reduction of HO-1 activity ameliorated ICH-induced brain damage and reduced reactive oxygen species production in mice. Moreover, a decrease in HO-1 induction protected cultured cortical neurons against heme-mediated injury. These results imply that ICH-induced HO-1 may be cytotoxic in the central nervous system.45 The disparate effects of HO-1 in different pathologic situations may be due to the magnitude of the induction because the loads of heme and degradation products in each disease are unequal. Previous studies have shown that HO-1 exerts cytoprotection when the amounts of hemin to be degraded are within the ability of the cells to sequester and dispose of the released iron; however, HO becomes toxic when excessive amounts of iron are released, causing free radical-induced damage.46 In ICH, the heme-induced excessively high levels of HO-1 might surpass the protection threshold and lead to brain injury.
Our data show that deletion of Cav-1 down-regulates HO-1 induction in the ICH mouse model. Several lines of evidence suggest that Cav-1 participates in HO-1 expression. HO-1 localized to plasma caveola47 and interacted with Cav-1, and Cav-1 modulated HO-1 induction during hypoxia-induced lung injury.13 In addition, our in vitro data show that hemin-induced HO-1 protein expression was down-regulated both in Cav-1 KO and Cav-1 siRNA-transfected neurons. Thus, these data imply that Cav-1 participates in HO-1 induction in the ICH mouse model.
ICH evokes a strong inflammatory response, characterized by activation and release of inflammatory mediators that exacerbate tissue damage. The up-regulation of chemokines, such as MIP-2, is crucial for orchestrating the infiltration of blood-derived monocytes into the area of brain injury.15 In addition, MMP-9 degrades the neurovascular matrix, leading to edema and tissue injury,19 and induction of COX-2 up-regulates prostaglandin production, generating free radical species and contributing to edema and neuronal death in brain damage.15 It is possible that Cav-1 deletion suppressed local neutrophil infiltration and reduced MIP-2, MMP-9, and COX-2 induction after ICH, thereby ameliorating brain damage. A role of Cav-1 in regulating inflammatory responses has been shown in other systems. For example, siRNA knockdown of endothelial Cav-1 reduced transendothelial migration of leukocytes,48 and Cav-1 KO mice exhibited reduced neutrophil sequestration, lung microvascular permeability, and lung edema in response to lipopolysaccharide challenge.17 We observed a significant reduction of hemorrhage-induced MIP-2, MMP-9, and COX-2 protein expression in Cav-1 KO brains. These findings support the hypothesis that Cav-1 is involved in inflammation and subsequent brain damage after ICH.
The contribution of brain edema to the outcomes of ICH remains controversial.15 Some clinical studies have suggested that there are no clear associations between perihematomal edema and subsequent neurologic deficits.49,50 However, other studies have shown that the degree of perihematomal edema is correlated with neurologic deteriorations and poor functional outcomes.51,52 Perihematomal edema increases rapidly in the first 24 hours after human ICH,53 although it peaks after more than 24 hours.54 The importance of brain edema is further supported by our results showing that, without affecting hematoma expansion, Cav-1 depletion led to less brain edema and was associated with improved histologic and neurologic outcomes. We found that the reduced brain edema formation in Cav-1 KO mice was consistent with reduced MIP-2, MMP-9, and COX-2 expression and polymorphonuclear recruitment in Cav-1 KO brains. Our results are in agreement with published data showing that deletion of the Cav-1 gene reduced microvascular barrier breakdown and edema formation in acute lung injury,17 whereas in a brain injury model increased Cav-1 expression preceded the reduced expression of the tight junction proteins occludin and claudin-5 during blood-brain barrier breakdown.55 Furthermore, enhanced Cav-1 in brain diseases is associated with early brain edema.56 Earlier reports also indicated that Cav-1 expression increased caveola-mediated transcytosis and contributed to increased endothelial permeability on lipopolysaccharide induction.57
Summary
We demonstrate that Cav-1 deletion leads to neuroprotection after hemorrhagic stroke. This protective effect is associated with the reduction in ICH-induced neuro-inflammatory responses, HO-1 expression, and oxidative damage. Our findings suggest an important role of Cav-1 in ICH-induced early brain injury, which suggests Cav-1 could be a potential therapeutic target for treatment of ICH.
Footnotes
Supported by grants from the National Science Council of Taiwan, R.O.C. (NSC 98-2320-B-001-008 to S.-K.S.; NSC 98-2314-B-350-002-MY3 to S.-F.C.), and Cheng Hsin General Hospital.
S.-F.C. and S.-K.S. contributed equally to this work.
None of the authors disclosed any relevant financial relationships.
Supplemental material for this article can be found http://ajp.amjpathol.org or at doi: 10.1016/j.path.2010.12.023.
Contributor Information
Szu-Fu Chen, Email: szufuchen@yahoo.com.tw.
Song-Kun Shyue, Email: skshyue@ibms.sinica.edu.tw.
Supplementary data
References
- 1.Feigin V.L., Lawes C.M., Bennett D.A., Barker-Collo S.L., Parag V. Worldwide stroke incidence and early case fatality reported in 56 population-based studies: a systematic review. Lancet Neurol. 2009;8:355–369. doi: 10.1016/S1474-4422(09)70025-0. [DOI] [PubMed] [Google Scholar]
- 2.Razani B., Woodman S.E., Lisanti M.P. Caveolae: from cell biology to animal physiology. Pharmacol Rev. 2002;54:431–467. doi: 10.1124/pr.54.3.431. [DOI] [PubMed] [Google Scholar]
- 3.Lisanti M.P., Scherer P.E., Tang Z., Sargiacomo M. Caveolae, caveolin and caveolin-rich membrane domains: a signalling hypothesis. Trends Cell Biol. 1994;4:231–235. doi: 10.1016/0962-8924(94)90114-7. [DOI] [PubMed] [Google Scholar]
- 4.Head B.P., Patel H.H., Tsutsumi Y.M., Hu Y., Mejia T., Mora R.C., Insel P.A., Roth D.M., Drummond J.C., Patel P.M. Caveolin-1 expression is essential for N-methyl-D-aspartate receptor-mediated Src and extracellular signal-regulated kinase 1/2 activation and protection of primary neurons from ischemic cell death. FASEB J. 2008;22:828–840. doi: 10.1096/fj.07-9299com. [DOI] [PubMed] [Google Scholar]
- 5.Trushina E., Du Charme J., Parisi J., McMurray C.T. Neurological abnormalities in caveolin-1 knock out mice. Behav Brain Res. 2006;172:24–32. doi: 10.1016/j.bbr.2006.04.024. [DOI] [PubMed] [Google Scholar]
- 6.Gioiosa L., Raggi C., Ricceri L., Jasmin J.F., Frank P.G., Capozza F., Lisanti M.P., Alleva E., Sargiacomo M., Laviola G. Altered emotionality, spatial memory and cholinergic function in caveolin-1 knock-out mice. Behav Brain Res. 2008;188:255–262. doi: 10.1016/j.bbr.2007.11.002. [DOI] [PubMed] [Google Scholar]
- 7.Jasmin J.F., Malhotra S., Singh Dhallu M., Mercier I., Rosenbaum D.M., Lisanti M.P. Caveolin-1 deficiency increases cerebral ischemic injury. Circ Res. 2007;100:721–729. doi: 10.1161/01.RES.0000260180.42709.29. [DOI] [PubMed] [Google Scholar]
- 8.Heshmati Y., Mirabzadeh A., Feizzade G., Gilanipour M., Etminan M.R., Khoram Khorshid H.R., Kamali K., Fakhri M., Moghimi N., Najmabadi H., Ohadi M. A novel polymorphic purine complex at the 1.5 kb upstream region of the human caveolin-1 gene and risk of Alzheimer's disease; extra-short alleles and accumulated allele homozygosity. Am J Med Genet B Neuropsychiatr Genet. 2009;150B:248–253. doi: 10.1002/ajmg.b.30805. [DOI] [PubMed] [Google Scholar]
- 9.Maines M.D. Heme oxygenase: function, multiplicity, regulatory mechanisms, and clinical applications. FASEB J. 1988;2:2557–2568. [PubMed] [Google Scholar]
- 10.Huang F.P., Xi G., Keep R.F., Hua Y., Nemoianu A., Hoff J.T. Brain edema after experimental intracerebral hemorrhage: role of hemoglobin degradation products. J Neurosurg. 2002;96:287–293. doi: 10.3171/jns.2002.96.2.0287. [DOI] [PubMed] [Google Scholar]
- 11.Wagner K.R., Hua Y., de Courten-Myers G.M., Broderick J.P., Nishimura R.N., Lu S.Y., Dwyer B.E. Tin-mesoporphyrin, a potent heme oxygenase inhibitor, for treatment of intracerebral hemorrhage: in vivo and in vitro studies. Cell Mol Biol (Noisy-le-grand) 2000;46:597–608. [PubMed] [Google Scholar]
- 12.Wang J., Dore S. Heme oxygenase-1 exacerbates early brain injury after intracerebral haemorrhage. Brain. 2007;130:1643–1652. doi: 10.1093/brain/awm095. [DOI] [PMC free article] [PubMed] [Google Scholar]
- 13.Jin Y., Kim H.P., Chi M., Ifedigbo E., Ryter S.W., Choi A.M. Deletion of caveolin-1 protects against oxidative lung injury via up-regulation of heme oxygenase-1. Am J Respir Cell Mol Biol. 2008;39:171–179. doi: 10.1165/rcmb.2007-0323OC. [DOI] [PMC free article] [PubMed] [Google Scholar]
- 14.Qureshi A.I., Mendelow A.D., Hanley D.F. Intracerebral haemorrhage. Lancet. 2009;373:1632–1644. doi: 10.1016/S0140-6736(09)60371-8. [DOI] [PMC free article] [PubMed] [Google Scholar]
- 15.Xi G., Keep R.F., Hoff J.T. Mechanisms of brain injury after intracerebral haemorrhage. Lancet Neurol. 2006;5:53–63. doi: 10.1016/S1474-4422(05)70283-0. [DOI] [PubMed] [Google Scholar]
- 16.Majkova Z., Smart E., Toborek M., Hennig B. Up-regulation of endothelial monocyte chemoattractant protein-1 by coplanar PCB77 is caveolin-1-dependent. Toxicol Appl Pharmacol. 2009;237:1–7. doi: 10.1016/j.taap.2009.02.016. [DOI] [PMC free article] [PubMed] [Google Scholar]
- 17.Garrean S., Gao X.P., Brovkovych V., Shimizu J., Zhao Y.Y., Vogel S.M., Malik A.B. Caveolin-1 regulates NF-kappaB activation and lung inflammatory response to sepsis induced by lipopolysaccharide. J Immunol. 2006;177:4853–4860. doi: 10.4049/jimmunol.177.7.4853. [DOI] [PubMed] [Google Scholar]
- 18.Tsai T.H., Chen S.F., Huang T.Y., Tzeng C.F., Chiang A.S., Kou Y.R., Lee T.S., Shyue S.K. Impaired Cd14 and Cd36 expression, bacterial clearance and Toll-like receptor 4-Myd88 signaling in caveolin-1-deleted macrophages and mice. Shock. 2011;35:92–99. doi: 10.1097/SHK.0b013e3181ea45ca. [DOI] [PubMed] [Google Scholar]
- 19.Wang J., Tsirka S.E. Neuroprotection by inhibition of matrix metalloproteinases in a mouse model of intracerebral haemorrhage. Brain. 2005;128:1622–1633. doi: 10.1093/brain/awh489. [DOI] [PubMed] [Google Scholar]
- 20.Takizawa S., Hirabayashi H., Matsushima K., Tokuoka K., Shinohara Y. Induction of heme oxygenase protein protects neurons in cortex and striatum, but not in hippocampus, against transient forebrain ischemia. J Cereb Blood Flow Metab. 1998;18:559–569. doi: 10.1097/00004647-199805000-00011. [DOI] [PubMed] [Google Scholar]
- 21.Chen S.F., Hsu C.W., Huang W.H., Wang J.Y. Post-injury baicalein improves histological and functional outcomes and reduces inflammatory cytokines after experimental traumatic brain injury. Br J Pharmacol. 2008;155:1279–1296. doi: 10.1038/bjp.2008.345. [DOI] [PMC free article] [PubMed] [Google Scholar]
- 22.Wang J., Fields J., Zhao C., Langer J., Thimmulappa R.K., Kensler T.W., Yamamoto M., Biswal S., Dore S. Role of Nrf2 in protection against intracerebral hemorrhage injury in mice. Free Radic Biol Med. 2007;43:408–414. doi: 10.1016/j.freeradbiomed.2007.04.020. [DOI] [PMC free article] [PubMed] [Google Scholar]
- 23.Wang J., Dore S. Heme oxygenase 2 deficiency increases brain swelling and inflammation after intracerebral hemorrhage. Neuroscience. 2008;155:1133–1141. doi: 10.1016/j.neuroscience.2008.07.004. [DOI] [PMC free article] [PubMed] [Google Scholar]
- 24.Chen S.F., Liou J.Y., Huang T.Y., Lin Y.S., Yeh A.L., Tam K., Tsai T.H., Wu K.K., Shyue S.K. Caveolin-1 facilitates cyclooxygenase-2 protein degradation. J Cell Biochem. 2010;109:356–362. doi: 10.1002/jcb.22407. [DOI] [PubMed] [Google Scholar]
- 25.Lesuisse C., Martin L.J. Long-term culture of mouse cortical neurons as a model for neuronal development, aging, and death. J Neurobiol. 2002;51:9–23. doi: 10.1002/neu.10037. [DOI] [PubMed] [Google Scholar]
- 26.Wang J., Zhuang H., Dore S. Heme oxygenase 2 is neuroprotective against intracerebral hemorrhage. Neurobiol Dis. 2006;22:473–476. doi: 10.1016/j.nbd.2005.12.009. [DOI] [PubMed] [Google Scholar]
- 27.Shin T. Increases in the phosphorylated form of caveolin-1 in the spinal cord of rats with clip compression injury. Brain Res. 2007;1141:228–234. doi: 10.1016/j.brainres.2007.01.009. [DOI] [PubMed] [Google Scholar]
- 28.Gaudreault S.B., Dea D., Poirier J. Increased caveolin-1 expression in Alzheimer's disease brain. Neurobiol Aging. 2004;25:753–759. doi: 10.1016/j.neurobiolaging.2003.07.004. [DOI] [PubMed] [Google Scholar]
- 29.Gaudreault S.B., Blain J.F., Gratton J.P., Poirier J. A role for caveolin-1 in post-injury reactive neuronal plasticity. J Neurochem. 2005;92:831–839. doi: 10.1111/j.1471-4159.2004.02917.x. [DOI] [PubMed] [Google Scholar]
- 30.Akiyama C., Yuguchi T., Nishio M., Tomishima T., Fujinaka T., Taniguchi M., Nakajima Y., Kohmura E., Yoshimine T. Src family kinase inhibitor PP1 reduces secondary damage after spinal cord compression in rats. J Neurotrauma. 2004;21:923–931. doi: 10.1089/0897715041526230. [DOI] [PubMed] [Google Scholar]
- 31.Wang X.M., Kim H.P., Song R., Choi A.M. Caveolin-1 confers antiinflammatory effects in murine macrophages via the MKK3/p38 MAPK pathway. Am J Respir Cell Mol Biol. 2006;34:434–442. doi: 10.1165/rcmb.2005-0376OC. [DOI] [PMC free article] [PubMed] [Google Scholar]
- 32.Wang X.M., Kim H.P., Nakahira K., Ryter S.W., Choi A.M. The heme oxygenase-1/carbon monoxide pathway suppresses TLR4 signaling by regulating the interaction of TLR4 with caveolin-1. J Immunol. 2009;182:3809–3818. doi: 10.4049/jimmunol.0712437. [DOI] [PubMed] [Google Scholar]
- 33.Wang J. Preclinical and clinical research on inflammation after intracerebral hemorrhage. Prog Neurobiol. 2010;92:463–477. doi: 10.1016/j.pneurobio.2010.08.001. [DOI] [PMC free article] [PubMed] [Google Scholar]
- 34.Saleem S., Zhuang H., Biswal S., Christen Y., Dore S. Ginkgo biloba extract neuroprotective action is dependent on heme oxygenase 1 in ischemic reperfusion brain injury. Stroke. 2008;39:3389–3396. doi: 10.1161/STROKEAHA.108.523480. [DOI] [PMC free article] [PubMed] [Google Scholar]
- 35.Sakata Y., Zhuang H., Kwansa H., Koehler R.C., Dore S. Resveratrol protects against experimental stroke: putative neuroprotective role of heme oxygenase 1. Exp Neurol. 2010;224:325–329. doi: 10.1016/j.expneurol.2010.03.032. [DOI] [PMC free article] [PubMed] [Google Scholar]
- 36.Wu J., Hua Y., Keep R.F., Schallert T., Hoff J.T., Xi G. Oxidative brain injury from extravasated erythrocytes after intracerebral hemorrhage. Brain Res. 2002;953:45–52. doi: 10.1016/s0006-8993(02)03268-7. [DOI] [PubMed] [Google Scholar]
- 37.Clark J.F., Loftspring M., Wurster W.L., Beiler S., Beiler C., Wagner K.R., Pyne-Geithman G.J. Bilirubin oxidation products, oxidative stress, and intracerebral hemorrhage. Acta Neurochir Suppl. 2008;105:7–12. doi: 10.1007/978-3-211-09469-3_2. [DOI] [PMC free article] [PubMed] [Google Scholar]
- 38.Gong Y., Tian H., Xi G., Keep R.F., Hoff J.T., Hua Y. Systemic zinc protoporphyrin administration reduces intracerebral hemorrhage-induced brain injury. Acta Neurochir Suppl. 2006;96:232–236. doi: 10.1007/3-211-30714-1_50. [DOI] [PubMed] [Google Scholar]
- 39.Koeppen A.H., Dickson A.C., Smith J. Heme oxygenase in experimental intracerebral hemorrhage: the benefit of tin-mesoporphyrin. J Neuropathol Exp Neurol. 2004;63:587–597. doi: 10.1093/jnen/63.6.587. [DOI] [PubMed] [Google Scholar]
- 40.Benvenisti-Zarom L., Chen-Roetling J., Regan R.F. Inhibition of the ERK/MAP kinase pathway attenuates heme oxygenase-1 expression and heme-mediated neuronal injury. Neurosci Lett. 2006;398:230–234. doi: 10.1016/j.neulet.2006.01.003. [DOI] [PubMed] [Google Scholar]
- 41.Goldstein L., Teng Z.P., Zeserson E., Patel M., Regan R.F. Hemin induces an iron-dependent, oxidative injury to human neuron-like cells. J Neurosci Res. 2003;73:113–121. doi: 10.1002/jnr.10633. [DOI] [PubMed] [Google Scholar]
- 42.Cousar J.L., Lai Y., Marco C.D., Bayir H., Adelson P.D., Janesko-Feldman K.L., Kochanek P.M., Clark R.S. Heme oxygenase 1 in cerebrospinal fluid from infants and children after severe traumatic brain injury. Dev Neurosci. 2006;28:342–347. doi: 10.1159/000094160. [DOI] [PubMed] [Google Scholar]
- 43.Dore S., Sampei K., Goto S., Alkayed N.J., Guastella D., Blackshaw S., Gallagher M., Traystman R.J., Hurn P.D., Koehler R.C., Snyder S.H. Heme oxygenase-2 is neuroprotective in cerebral ischemia. Mol Med. 1999;5:656–663. [PMC free article] [PubMed] [Google Scholar]
- 44.Shah Z.A., Namiranian K., Klaus J., Kibler K., Dore S. Use of an optimized transient occlusion of the middle cerebral artery protocol for the mouse stroke model. J Stroke Cerebrovasc Dis. 2006;15:133–138. doi: 10.1016/j.jstrokecerebrovasdis.2006.04.002. [DOI] [PubMed] [Google Scholar]
- 45.Suttner D.M., Dennery P.A. Reversal of HO-1 related cytoprotection with increased expression is due to reactive iron. FASEB J. 1999;13:1800–1809. doi: 10.1096/fasebj.13.13.1800. [DOI] [PubMed] [Google Scholar]
- 46.Ryter S.W., Tyrrell R.M. The heme synthesis and degradation pathways: role in oxidant sensitivity: Heme oxygenase has both pro- and antioxidant properties. Free Radic Biol Med. 2000;28:289–309. doi: 10.1016/s0891-5849(99)00223-3. [DOI] [PubMed] [Google Scholar]
- 47.Kim H.P., Wang X., Galbiati F., Ryter S.W., Choi A.M. Caveolae compartmentalization of heme oxygenase-1 in endothelial cells. FASEB J. 2004;18:1080–1089. doi: 10.1096/fj.03-1391com. [DOI] [PubMed] [Google Scholar]
- 48.Millan J., Hewlett L., Glyn M., Toomre D., Clark P., Ridley A.J. Lymphocyte transcellular migration occurs through recruitment of endothelial ICAM-1 to caveola- and F-actin-rich domains. Nat Cell Biol. 2006;8:113–123. doi: 10.1038/ncb1356. [DOI] [PubMed] [Google Scholar]
- 49.Arima H., Wang J.G., Huang Y., Heeley E., Skulina C., Parsons M.W., Peng B., Li Q., Su S., Tao Q.L., Li Y.C., Jiang J.D., Tai L.W., Zhang J.L., Xu E., Cheng Y., Morgenstern L.B., Chalmers J., Anderson C.S. Significance of perihematomal edema in acute intracerebral hemorrhage: the INTERACT trial. Neurology. 2009;73:1963–1968. doi: 10.1212/WNL.0b013e3181c55ed3. [DOI] [PMC free article] [PubMed] [Google Scholar]
- 50.Leira R., Davalos A., Silva Y., Gil-Peralta A., Tejada J., Garcia M., Castillo J. Early neurologic deterioration in intracerebral hemorrhage: predictors and associated factors. Neurology. 2004;63:461–467. doi: 10.1212/01.wnl.0000133204.81153.ac. [DOI] [PubMed] [Google Scholar]
- 51.Gebel J.M., Jr, Jauch E.C., Brott T.G., Khoury J., Sauerbeck L., Salisbury S., Spilker J., Tomsick T.A., Duldner J., Broderick J.P. Relative edema volume is a predictor of outcome in patients with hyperacute spontaneous intracerebral hemorrhage. Stroke. 2002;33:2636–2641. doi: 10.1161/01.str.0000035283.34109.ea. [DOI] [PubMed] [Google Scholar]
- 52.Sykora M., Diedler J., Turcani P., Rupp A., Steiner T. Subacute perihematomal edema in intracerebral hemorrhage is associated with impaired blood pressure regulation. J Neurol Sci. 2009;284:108–112. doi: 10.1016/j.jns.2009.04.028. [DOI] [PubMed] [Google Scholar]
- 53.Gebel J.M., Jr, Jauch E.C., Brott T.G., Khoury J., Sauerbeck L., Salisbury S., Spilker J., Tomsick T.A., Duldner J., Broderick J.P. Natural history of perihematomal edema in patients with hyperacute spontaneous intracerebral hemorrhage. Stroke. 2002;33:2631–2635. doi: 10.1161/01.str.0000035284.12699.84. [DOI] [PubMed] [Google Scholar]
- 54.Inaji M., Tomita H., Tone O., Tamaki M., Suzuki R., Ohno K. Chronological changes of perihematomal edema of human intracerebral hematoma. Acta Neurochir Suppl. 2003;86:445–448. doi: 10.1007/978-3-7091-0651-8_91. [DOI] [PubMed] [Google Scholar]
- 55.Nag S., Venugopalan R., Stewart D.J. Increased caveolin-1 expression precedes decreased expression of occludin and claudin-5 during blood-brain barrier breakdown. Acta Neuropathol. 2007;114:459–469. doi: 10.1007/s00401-007-0274-x. [DOI] [PubMed] [Google Scholar]
- 56.Nag S., Manias J.L., Stewart D.J. Pathology and new players in the pathogenesis of brain edema. Acta Neuropathol. 2009;118:197–217. doi: 10.1007/s00401-009-0541-0. [DOI] [PubMed] [Google Scholar]
- 57.Tiruppathi C., Shimizu J., Miyawaki-Shimizu K., Vogel S.M., Bair A.M., Minshall R.D., Predescu D., Malik A.B. Role of NF-kappaB-dependent caveolin-1 expression in the mechanism of increased endothelial permeability induced by lipopolysaccharide. J Biol Chem. 2008;283:4210–4218. doi: 10.1074/jbc.M703153200. [DOI] [PMC free article] [PubMed] [Google Scholar]
Associated Data
This section collects any data citations, data availability statements, or supplementary materials included in this article.