Abstract
The septum transversum mesenchyme (STM) signals to induce hepatogenesis from the foregut endoderm. Hepatic stellate cells (HSCs) are sinusoidal pericytes assumed to originate from the STM and participate in mesenchymal-epithelial interaction in embryonic and adult livers. However, the developmental origin of HSCs remains elusive due to the lack of markers for STM and HSCs. We previously identified submesothelial cells (SubMCs) beneath mesothelial cells (MCs) as a potential precursor for HSCs in developing livers. In the present study, we reveal that both STM in embryonic day (E) 9.5 and MC/SubMCs in E12.5 share the expression of activated leukocyte cell adhesion molecule (Alcam), desmin, and Wilms tumor 1 homolog (Wt1). A cell lineage analysis using MesP1Cre/Rosa26lacZflox mice identifies the mesodermal origin of the STM, HSCs, and perivascular mesenchymal cells (PMCs). A conditional cell lineage analysis using the Wt1CreERT2 mice demonstrates that Wt1+ STM gives rise to MCs, SubMCs, HSCs and PMCs during liver development. Furthermore, we find that Wt1+ MC/SubMCs migrate inward from the liver surface to generate HSCs and PMCs including portal fibroblasts, smooth muscle cells, and fibroblasts around the central veins. On the other hand, the Wt1+ STM and MC/SubMCs do not contribute to sinusoidal endothelial cells, Kupffer cells, and hepatoblasts.
Conclusion
our results demonstrate that HSCs and PMCs are derived from MC/SubMCs which are traced back to mesodermal STM during liver development.
Keywords: Alcam, mesothelial cells, portal fibroblasts, submesothelial cells, Wilms tumor 1 homolog
Introduction
Hepatic stellate cells (HSCs) are characterized by the expression of desmin and storage of vitamin A in the liver.1 Upon injury, cytokines and reactive oxygen species from injured hepatocytes, Kupffer cells, and HSCs themselves trigger HSC activation.2,3 Activated HSCs lose vitamin A lipid, transform into a myofibroblastic phenotype expressing α-smooth muscle actin (SMA), and synthesize proinflammatory cytokines and excessive extracellular matrix proteins. Thus, suppression of HSC activation is considered as a major therapeutic target for treatment of liver fibrosis.2 In addition to HSCs, different liver mesenchymal cell types may serve as the source of myofibroblasts in fibrosis.3 Electron microscopy suggests that myofibroblasts are possibly derived from HSCs, portal fibroblasts (PFBs) in the portal area, smooth muscle cells (SMCs) in the veins, and myofibroblasts and fibroblasts (FBs) around the central veins.4 Myofibroblasts derived from different sources appear to participate in liver fibrogenesis, though their origin remains to be determined.1–3
During mouse embryogenesis, the liver is formed as a diverticulum of the foregut endoderm around embryonic day (E) 9.5 in mice.5,6 The ventral region of the foregut endoderm invades into the surrounding septum transversum mesenchyme (STM) and gives rise to hepatoblasts that are capable of differentiating into both hepatocytes and biliary epithelial cells.5,6 Electron microscopic observation suggests trapping of the STM between growing hepatoblasts and possible development of HSCs from the STM in the mouse fetal liver.7 As supportive evidence, the STM and HSCs share expression of Foxf1 and Lhx2 during embryogenesis.8,9 However, a definitive answer for the STM-HSC notion has not been attained due to the lack of specific markers for tracing the STM and HSC lineages.
Besides the STM, the different developmental origins were proposed for HSCs including the liver mesothelium, neural crest, bone marrow, endoderm, and mesoderm.1 With respect to the neural crest notion, a cell lineage analysis using Wnt1Cre and Rosa26 mice failed to support it.10 In chick embryos, the liver mesothelium contributes to HSCs and sinusoidal endothelial cells (SECs).11 In mouse embryos, the liver mesothelium may delaminate and become incorporated to the sinusoidal walls as shown by the use of Wilms tumor 1 homolog (Wt1)-LacZ mice.12 Although several observational studies suggested the contribution of the STM or mesothelium to HSCs,7–9,11,12 definitive answers to these notions have not been attained by rigorous genetic-based lineage-tracing methods.
The determination of a HSC lineage is important for better understanding of how different mesenchymal cell types organize liver morphogenesis in embryos and how phenotypes of HSCs and PFBs are determined and regulated in liver fibrosis. As the first step toward this goal, we have identified markers for HSCs and characterized their phenotype in mouse embryos.13 Fetal HSCs express desmin and p75 neurotrophin receptor in E12.5 livers.13,14 In addition to these markers, mesenchymal cells around the veins express SMA and Jagged 1 (Jag1).13,14 We termed these mesenchymal cells as perivascular mesenchymal cells (PMCs), because the bile duct is not formed around E12.5 and portal and central veins morphologically cannot be distinguished.13 Mesothelial cells (MCs) covering liver surface express podoplanin.13 Beneath MCs, we identified unique mesenchymal cells named as “submesothelial cells (SubMCs)”.13 MCs and SubMCs are separated by the basal lamina and both cell types express activated leukocyte cell adhesion molecule (Alcam) and Wt1 in E12.5 livers. Interestingly, Alcam+desmin+ SubMCs seem to migrate inward and differentiate into HSCs. A similar observation was also reported in developing human liver, in which HSCs appear to grow from SubMCs beneath the liver capsule.15 In support of this notion, isolated Alcam+ MC/SubMCs stored vitamin A lipids, a functional feature of differentiated HSCs when cultured in collagen gel with retinol.13 Based on these data, we hypothesized that MC/SubMCs give rise to HSCs and PMCs in developing livers.13
We recently demonstrated that HSCs are mesodermal in origin by a cell lineage analysis using the MesP1Cre and Rosa26lacZ mice.13 However, the MesP1+ cells in early embryos contribute to a broad range of mesoderm components.16 Thus, it remains to be determined how the STM and mesothelium participate in the generation of HSCs from MesP1+ mesoderm during liver development. Furthermore, it is not known whether HSC and other liver cell types such as hepatoblasts and SECs are derived from the same precursor. In the present study, we traced the cell lineages of the STM and mesothelium by a conditional cell lineage analysis using the Wt1CreERT2 mice.17 This analysis demonstrates that Wt1+ STM in E9.5 gives rise to MC, SubMCs, HSCs, and PMCs in a manner involving inward migration of Wt1+ MC/SubMCs from the liver surface to generate HSCs and PMCs during liver morphogenesis.
Materials and Methods
Mice
MesP1Cre, Wt1CreERT2, Rosa26lacZflox, Rosa26mTmGflox mice were described previously.16–19 Tamoxifen (Sigma) dissolved in ethanol was emulsified in sesame oil at 12.5 mg/ml and 2 mg of tamoxifen was injected intraperitoneally to the pregnant mice from E10.5. Before E10.5 embryos, we failed to induce lacZ expression in the STM by injection of 2 mg tamoxifen, despite the strong expression of Wt1 in the STM. Before E9.0 embryos, a fetal-placental circulation is yet to be established and tamoxifen injected into the mother may not be delivered efficiently to the embryos. We also experienced that tamoxifen treatment before E10.5 embryos often results in abnormal bleeding in utero and termination of embryogenesis. Thus, we injected a reduced tamoxifen dose of 1.5 mg twice at E7.5 and 8.5 and examined the embryos at E9.5 and E11.5. Although some embryos still died by this method, surviving embryos did not show any signs of abnormalities. Mice were used in accordance with protocols approved by the IACUC of the University of Southern California.
X-gal Staining
Embryos were fixed with 4% paraformaldehyde. Cryosections (7 μm) were stained with X-gal followed by counter-staining with Nuclear Fast Red or Eosin (Sigma).13 To quantify the number of the LacZ+ cells in the livers from E11.5 to E13.5, the images were captured under a microscope (Nikon, Nikon Eclipse 90i) and the lacZ signals were counted in the median lobe (ML) and left lobe (LL) (n=6). The areas of the ML and LL were measured with imaging software (Nikon NIS-Elements). The number of the lacZ signals inside the liver was quantified in every 6 (E11.5) or 10 section (E12.5, E13.5).
Immunohistochemistry
Immunohistochemistry was performed as previously described.13 The antibodies used in immunostaining were listed in Supporting Table 1. The primary antibodies were detected with secondary antibodies conjugated with AlexaFluor dyes (Invitrogen). The sections were counterstained with DAPI (Invitrogen). For immunostaining of the Rosa26mTmG embryos, we bleached the tomato fluorescence with 3% H2O2 in methanol 10 min before immunostaining.
To quantify the percentages of lacZ+ or green fluorescent protein (GFP)+ cells in desmin+ HSCs and PMCs inside the liver, the images in every 6 (E11.5) or 10 section (E12.5, E13.5, E18.5) were captured and the lacZ+, GFP+, and desmin+ cells inside the livers were counted (n=5). To quantify the labeling efficiency of MC/SubMCs by tamoxifen treatment, E9.5 or 11.5 liver sections were stained with antibodies against Alcam and lacZ in every 6 section. The images were captured as above and the lacZ+ MC/SubMCs and Alcam+ cells in the STM or MC/SubMCs were counted (n=5).
Statistical Analysis
Statistical tests for the significance of differences were made by ANOVA followed by Tukey post-hoc test. A P value of less than 0.05 was considered statistically significant.
Results
The STM Expresses SubMC Markers at the Onset of Liver Development
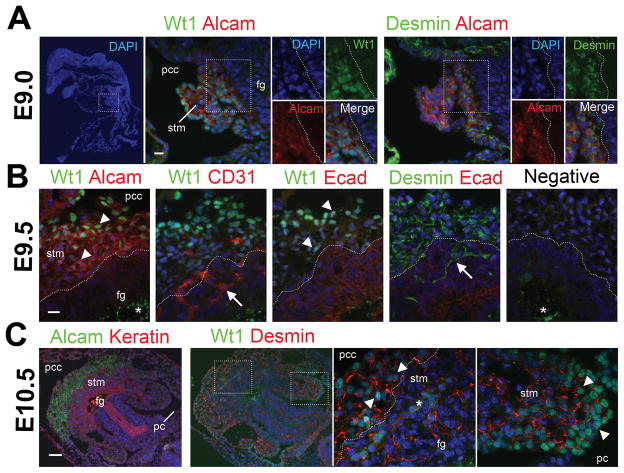
We previously identified SubMCs as mesenchymal cells expressing Alcam, desmin, and Wt1 beneath MCs in E12.5 mouse livers (see Fig. 2B).13 In the present study, we first examined expression of the SubMC markers throughout liver development by immunohistochemistry. Wt1 mRNA is known to be expressed in the coelomic cavity from E9.0 embryos.20 Before liver formation at E9.0, the expression of Wt1 is detected in the nuclei of the STM adjacent to the foregut endoderm (Fig. 1A). The STM also expresses Alcam and desmin (Fig. 1A). At E9.5, the STM expresses Alcam, desmin, and Wt1 (Fig. 1B). The nuclear Wt1 staining is weaker in the STM near the foregut endoderm. No Wt1 expression is detected in CD31+ endothelial cells and E-cadherin+ endoderm. As the foregut endoderm invades into the STM, desmin+ mesenchymal cells and CD31+ endothelial cells are trapped among the growing endodermal cells (Fig. 1B, arrows). The serial sections show that these desmin+ mesenchymal cells in the endoderm do not express Alcam and Wt1 (Fig. 1B), suggesting that the STM loses expression of Alcam and Wt1 upon differentiation into liver mesenchymal cells. At E10.5, cytokeratin+ hepatoblasts grow into the Alcam+ Wt1+ STM towards the pericardial cavity (Fig. 1C). Although the mouse anti-Wt1 antibody causes some nonspecific staining to cytoplasm of blood cells, the nuclear staining is clearly seen in the STM (Fig. 1C, arrowheads). The STM expanding into the peritoneal cavity also expresses desmin and Wt1 (Fig. 1C).
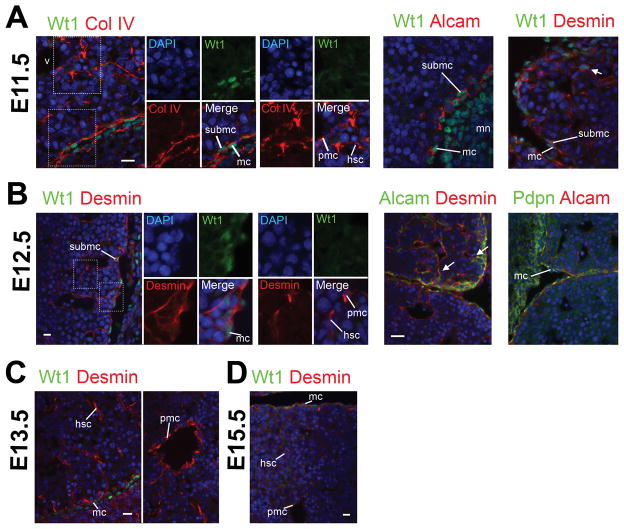
Fig. 2.
Expression of Wt1 in MCs and some SubMCs in mouse embryos from E11.5 to E15.5. Embryos at E11.5 (A), E12.5 (B), E13.5 (C), and E15.5 (D) were immunostained with antibodies against Alcam, desmin, podoplanin (Pdpn), type IV collagen (Col IV), and Wt1. Nuclei were counterstained with DAPI. Expression of Wt1 is seen in MCs and some SubMCs in E11.5. The number of Wt1+ MC/SubMCs decreases from E12.5 livers. No Wt1 expression is seen in liver HSCs and PMCs from E11.5 to E15.5. An arrow indicates rare desmin+ Wt1+ mesenchymal cells near the liver surface in E11.5 (A). In E12.5, Alcam+ desmin+ SubMCs seem to migrate inward and give rise to Alcam− desmin+ HSCs near the liver surface (B, arrows). Podoplanin (Pdpn) is exclusively expressed in MCs. hsc, hepatic stellate cells; mc, mesothelial cells; mn, metanephros; pmc, perivascular mesenchymal cells; submc, submesothelial cells; v, veins. Bar, 10 μm.
Fig. 1.
Expression of Alcam, desmin, and Wt1 in the STM of the mouse embryos from E9.0 to E10.5. Serial sections prepared from embryos at E9.0 (A, sagittal sections), E9.5 (B, transverse sections), and E10.5 (C, transverse sections) were immunostained with antibodies against Alcam, CD31, desmin, E-cadherin (Ecad), cytokeratin (Keratin), and Wt1. Nuclei were counterstained with DAPI. Note that the STM expresses Alcam, desmin, and Wt1 from E9.0 to E10.5. The nuclear staining of Wt1 is seen in the STM (arrowheads), but not in CD31+ endothelial cells and E-cadherin+ endoderm in E9.5. The nuclear Wt1 expression becomes weak in the STM near the foregut endoderm (fg). Arrows indicate desmin+ Wt1− mesenchymal cells and CD31+ Wt1− endothelial cells trapped in the growing endoderm. Asterisks indicate non-specific signals at the yolk and blood cells. Negative control without primary antibodies is shown in B (negative). pc, peritoneal cavity; pcc, pericardial cavity; stm, septum transversum mesenchyme. Bar, 10 μm (A,B), 50 μm (C).
Expression of Wt1 and Alcam in MC/SubMCs from E11.5 to E18.5 Livers
In E11.5, the liver lobes develop into the peritoneal cavity and the deposition of type IV collagen is seen between MCs and SubMCs near the liver surface (Fig. 2A). Nuclear staining of Wt1 is restricted in Alcam+ MCs and SubMCs (Fig. 2A). Desmin+ HSCs and PMCs do not express Wt1 inside the liver (Fig. 2A). We rarely observe desmin+Wt1+ mesenchymal cells near the liver surface in E11.5 livers (Fig. 2A, arrow). We assume that these mesenchymal cells are transitional cells from Wt1+ SubMCs to Wt1− HSCs. In E12.5 livers, the expression of Wt1 becomes weak and only seen in MCs and some SubMCs, but not in HSCs and PMCs (Fig. 2B). As we previously reported, Alcam+ SubMCs seem to migrate inward from the liver surface (Fig. 2B, arrows). Podoplanin (Pdpn), a marker for MCs, is exclusively expressed in MCs from E12.5 livers (Fig. 2B). From E13.5, the expression of Wt1 is weakly found in MC (Fig. 2C,D). Although expression of Alcam is seen in MC/SubMCs from E11.5, its expression is also evident in immature hepatocytes around the portal veins expressing SMA in E18.5 and becomes strong in hepatocytes and biliary epithelial cells in the adult liver (Supporting Fig. 1). Our data indicate that the STM and SubMCs share the expression of Alcam, desmin, and Wt1 during liver development.
Mesodermal Origin of the STM and HSCs in Embryogenesis
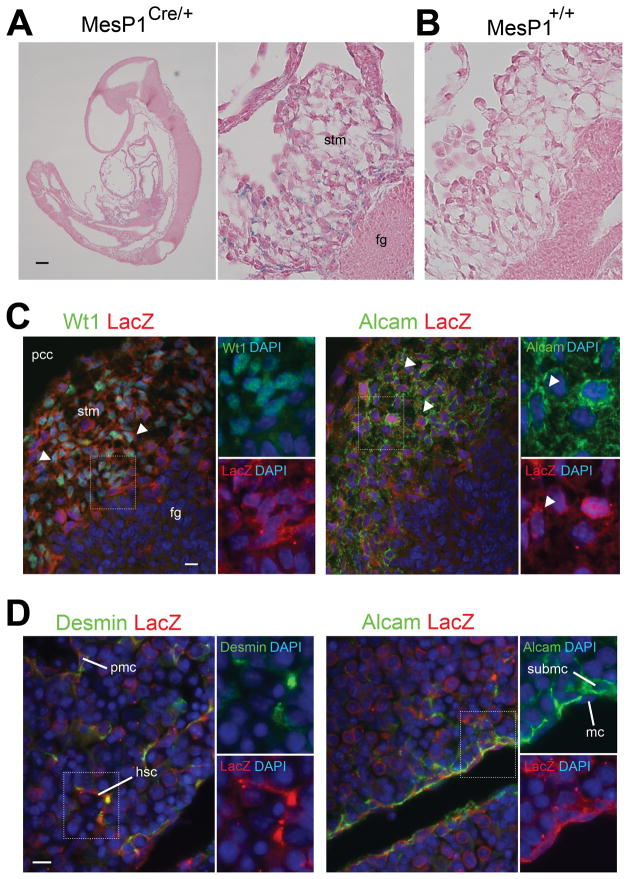
We previously demonstrated that MCs, SubMCs HSCs, and PMCs in E13.5 livers are derived from mesoderm by a cell lineage analysis using the MesP1Cre and Rosa26lacZ mice.13 MesP1 is transiently expressed in mesoderm during gastrulation around E5-7 embryos, but not in embryonic livers.16 We reasoned that if the STM is the source of HSCs and PMCs, the MesP1-derived mesoderm contributes to the STM. To test this notion, we analyzed E9.0-9.5 embryos from the MesP1Cre and Rosa26lacZ mice. As shown in Fig. 3A, lacZ expression is seen in the STM, but not in the foregut endoderm. No lacZ expression is seen in the control littermate (Fig. 3B). Immunostaining reveals that many lacZ+ cells in the STM coexpress Wt1 and Alcam (Fig. 3C). We also confirmed that the MesP1+ mesoderm gives rise to desmin+ HSCs and PMCs and Alcam+ MCs and SubMCs in E12.5 livers (Fig. 3D) as we previously reported in E13.5 livers.13 This cell lineage analysis demonstrate that the MesP1+ mesoderm gives rise to STM, MCs, SubMCs, HSCs, and PMCs during liver development.
Fig. 3.
MesP1+ mesoderm gives rise to HSCs via STM during mouse embryogenesis. The embryos from the MesP1Cre and Rosa26lacZflox mice were analyzed by X-gal staining (A,B) and immunohistochemistry (C,D). (A) The E9.0 MesP1Cre/+; Rosa26lacZflox/+ embryo shows lacZ expression in the STM adjacent to the foregut endoderm (fg). (B) No lacZ staining in the wild type littermate. Embryos were counterstained with eosin. (C) The STM in E9.5 MesP1Cre/+; Rosa26lacZflox/+ embryos coexpresses lacZ with Wt1 or Alcam (arrowheads). (D) Desmin+ HSCs and PMCs and Alcam+ MCs and SubMCs coexpresses lacZ in E12.5 MesP1Cre/+; Rosa26lacZflox/+ embryos. Nuclei were counterstained with DAPI. hsc, hepatic stellate cells; mc, mesothelial cells; pcc, pericardial cavity; pmc, perivascular mesenchymal cells; stm, septum transversum mesenchyme; submc, submesothelial cells. Bar, 100 μm (A), 10 μm (C,D).
STM Contributes to MCs, SubMCs, HSCs and PMCs
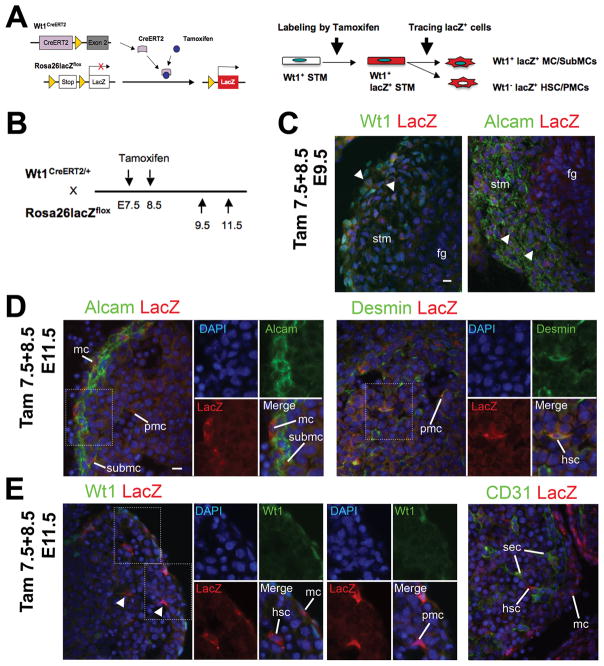
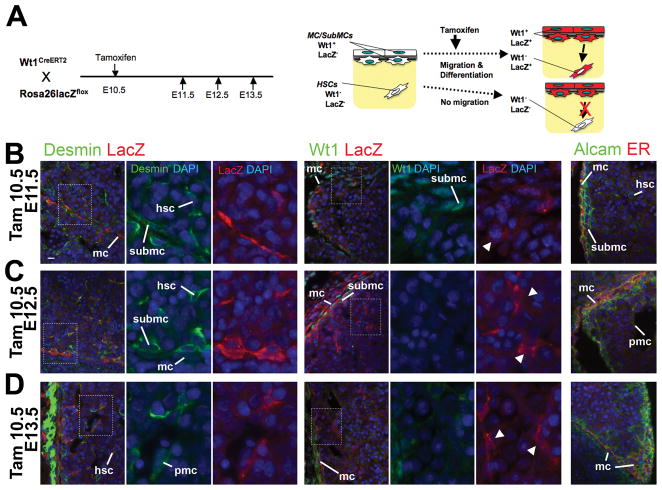
Although we have demonstrated the mesodermal origin of the STM and HSCs, a rigorous conditional lineage analysis is necessary to determine whether the STM gives rise to HSCs at the onset of liver development. To this end, we used the tamoxifen-inducible Cre/loxP system. As shown in Fig. 1 and 2, Wt1 is expressed in the STM in E9.5 and in MC/SubMCs from E11.5 livers, but not in HSCs and PMCs. Thus, Wt1 is a good tool for tracing differentiation of Wt1+ STM to Wt1− HSCs and PMCs. The WT1CreERT2 mice carry a Cre fusion protein with a modified estrogen receptor (CreERT2) in the Wt1 locus (Fig. 4A).17 By injection of tamoxifen, a synthetic ligand for estrogen receptor, the CreERT2 fusion protein expressed in the Wt1+ STM excises the stop sequence flanked with two loxP sites upstream of the lacZ genes in the Rosa26lacZ allele. An inducible CreERT2 protein begins to translocate into the nucleus within 6 hours of injection of tamoxifen and induces lacZ expression between 12 to 24 hours before its activity declines thereafter.21 Thus, by tamoxifen treatment, we can irreversibly label the Wt1+ STM at a desired time point and trace its fate by the expression of lacZ at later stages. If Wt1+ STM gives rise to HSCs and PMCs, we should observe Wt1− lacZ+ HSCs and PMCs inside the liver in later stage embryos (Fig. 4A).
Fig. 4.
The Wt1+ STM gives rise to HSCs and PMCs during liver development. The Wt1+ STM lineage was analyzed using the Wt1CreERT2 and Rosa26lacZflox mice. (A) Tamoxifen induces lacZ expression in Wt1+ STM. After tamoxifen injection, the CreERT2 excises the stop sequence between the loxP sites (triangles). Then, the lacZ gene is expressed in Wt1-expressing cells. If the STM gives rise to HSCs and PMCs, tamoxifen injection results in the expression of lacZ in Wt1− HSCs and PMCs inside the liver. (B) After tamoxifen injection twice at E7.5 and 8.5, the embryos at E9.5, and 11.5 were analyzed. (C-E) Immunohistochemistry of Alcam, CD31, desmin, lacZ, and Wt1 in the E9.5 (C) and E11.5 (D,E) embryos. Nuclei were counterstained with DAPI. Arrowheads indicate lacZ+ cells in Wt1+ or Alcam+ cells in the STM (C). Note that lacZ signals are detected in 5.6 ± 1.0% of Alcam+ cells in the STM in the E9.5 embryos. The percentage was obtained from total 906 Alcam+ cells. Results are means ± SD of 5 independent sections. In E11.5 embryos, lacZ expression is seen in Alcam+ MCs and SubMCs (D). LacZ is expressed in 10.5 ± 4.9% (ML) and 9.0 ± 2.7% (LL) of desmin+ cells in the E11.5 livers. These percentages were obtained from 1,643 (ML) and 2,058 (LL) desmin+ HSCs and PMCs inside the liver. No Wt1 expression in the lacZ+ HSCs and PMCs (E, arrowheads). No lacZ expression in CD31+ SECs (E). fg, foregut endoderm; hsc, hepatic stellate cells; mc, mesothelial cells; pmc, perivascular mesenchymal cells; sec, sinusoidal endothelial cells; stm, septum transversum mesenchyme; submc, submesothelial cells. Bar, 10 μm.
We injected tamoxifen twice at E7.5 and 8.5 and examined the embryos at E9.5 and 11.5 for tracing the STM lineage (Fig. 4B). At E9.5, a few lacZ+ cells are detected in Wt1+ or Alcam+ STM (Fig. 4C, arrowheads). LacZ signals are seen in 5.6 ± 1.0% of Alcam+ cells in the STM. In E11.5 embryos, lacZ expression is readily detected in Alcam+ C/SubMCs (Fig. 4D). Inside the liver, lacZ signals are detected in 10.5 ± 4.9% (median lobe [ML]) and 9.0 ± 2.7% (left lobe [LL]) of desmin+ cells including both HSCs and PMCs (Fig. 4D). Importantly, these lacZ+ HSCs and PMCs do not express Wt1 (Fig. 4E, arrowheads), supporting the notion that the STM gives rise to MC/SubMCs, HSCs and PMCs during liver development. Conversely, no lacZ expression is found in CD31+ SECs (Fig. 4E).
Inward Migration of MC/SubMCs from the Liver Surface
Although several groups including us suggested a possible contribution of the liver mesothelium to HSCs during liver development,11–13,15 a definitive validation of this hypothesis has not been made by rigorous genetic-based lineage-tracing methods. To directly test this notion, we used tamoxifen-inducible Wt1CreERT2 mice for tracing Wt1+ MC/SubMCs. To quantify the contribution of Wt1+ MC/SubMCs to Wt1− HSCs and PMCs, we injected tamoxifen at E10.5 for labeling the Wt1+ MC/SubMCs as lacZ-expressing cells and serially examined the livers 1, 2, and 3 days after the treatment (Fig. 5A). We predicted that if lacZ+ Wt1+ MC/SubMCs in E11.5 livers migrate inward and differentiate into HSCs and PMCs, tamoxifen injection would result in lacZ expression in Wt1− HSCs and PMCs in E12.5 and 13.5 livers (Fig. 5A). One day after tamoxifen injection, lacZ expression is indeed found in MC/SubMCs in the E11.5 livers (Fig. 5B). The expression of lacZ is rarely found in HSCs near the liver surface (Fig. 5B). Expression of Wt1 is seen in lacZ+ MC/SubMCs, but not in lacZ+ HSCs inside the liver (Fig. 5B, arrowhead). From E12.5 livers, desmin+ lacZ+ HSCs and PMCs are readily found inside the livers (Fig. 5C,D). Importantly, these lacZ+ HSCs and PMCs do not express Wt1 (Fig. 5C,D, arrowheads). We also confirmed the absence of CreERT2 protein in HSCs and PMCs by immunostaining of E11.5 to E13.5 livers for the estrogen receptor epitope of CreERT2 (Fig. 5B-D, ER).22 CreERT2 protein was restricted to MCs and some SubMCs. These results are considered as the definitive evidence for inward migration of the Wt1+ MC/SubMCs to give rise to HSCs and PMCs during liver morphogenesis.
Fig. 5.
Wt1+ MC/SubMCs give rise to HSCs and PMCs during liver development. Wt1+ MC/SubMC lineage was analyzed using the Wt1CreERT2 and Rosa26lacZflox mice. (A) Conditional labeling of Wt1+ MC/SubMCs using the Wt1CreERT2 and Rosa26lacZflox mice. After tamoxifen injection at E10.5, the embryos at E11.5, 12.5 and 13.5 were serially analyzed. If MC/SubMCs migrate inward and give rise to HSCs and PMCs, tamoxifen injection results in the expression of lacZ in Wt1− HSCs and PMCs inside the liver. (B-D) Immunohistochemistry of Alcam, desmin, CreERT2 (ER), lacZ and Wt1 in the E11.5 (B), E12.5 (C), and E13.5 (D) embryos after tamoxifen injection at E10.5. Nuclei were counterstained with DAPI. Note that tamoxifen induces lacZ expression in MC/SubMCs from E11.5 to E13.5 livers. In E11.5, lacZ expression is rare in desmin+ HSCs inside the liver. From E12.5 livers, lacZ expression is readily found in desmin+ HSCs and PMCs inside the livers. LacZ+ HSCs and PMCs do not express Wt1 inside the livers (arrowheads), indicating the migration and differentiation of Wt1+ MC/SubMCs to Wt1− HSCs and PMCs between E11.5 to E13.5. No CreERT2 (ER) expression in HSCs and PMCs. hsc, hepatic stellate cells; mc, mesothelial cells; pmc, perivascular mesenchymal cells; submc, submesothelial cells. Bar, 10 μm.
Significant Contribution of MC/SubMCs to HSCs and PMCs in Liver Development
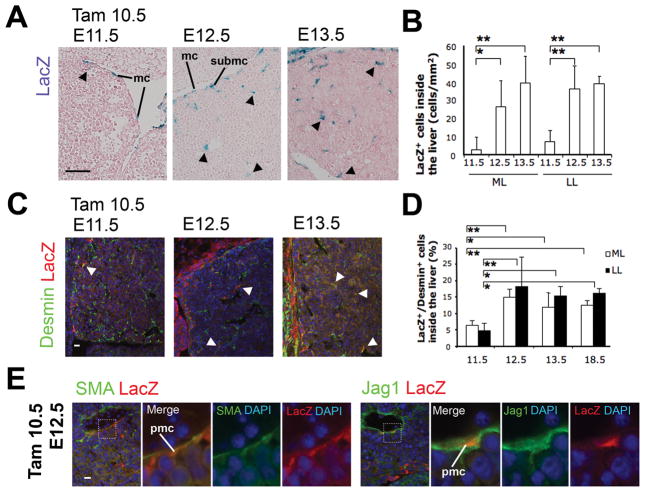
To assess the extent of the contribution of Wt1+ MC/SubMCs to the genesis of HSCs and PMCs, we quantified the lacZ+ HSCs and PMCs inside the liver (Fig. 6A, arrowheads). The number of the lacZ+ cells inside the livers was 2.8 cells/mm2 (ML) and 7.1 cells/mm2 (LL) at E11.5, and increased to 26.4 cells/mm2 (ML) and 36.1 cells/mm2 (LL) at E12.5 and 39.5 cells/mm2 (ML) and 39.0 cells/mm2 (LL) at E13.5 (Fig. 6B), demonstrating that Wt1+ MC/SubMCs have migrated inward from the liver surface during the developmental period from E10.5 to 13.5.
Fig. 6.
Quantification of Wt1+ MC/SubMC-derived HSC/PMCs in developing livers. The embryos at E11.5, 12.5 and 13.5 were serially analyzed after tamoxifen injection at E10.5. (A) X-gal staining. Nuclei were counterstained with Nuclear fast red. Arrowheads indicate lacZ+ HSCs and PMCs inside the livers. (B) The lacZ+ cells including both HSCs and PMCs inside the liver were counted. Results are means ± SD of 6 independent sections. LL, left lobe; ML, median lobe. (C) Immunohistochemistry of desmin and lacZ. Nuclei were counterstained with DAPI. Arrowheads indicate lacZ+ desmin+ HSCs and PMCs inside the livers. (D) Percentages of the lacZ+/desmin+ cells inside the livers obtained from total 21,571 (E11.5, 768; E12.5, 1,401; E13.5, 2,252; E18.5, 17,150) and 31,909 (E11.5, 950; E12.5, 2,097; E13.5, 5,212; E18.5, 23,650) desmin+ cells in the ML and LL, respectively. The immunostaining images of the E18.5 livers are shown in Fig. 7A. Results are means ± SD of 5 independent sections. *P < .05, **P < .01. (E) Immunostaining of lacZ with SMA or Jag1 in E12.5 livers after tamoxifen injection at E10.5. LacZ expression is seen in SMA+ and Jag1+ PMCs. mc, mesothelial cells; pmc, perivascular mesenchymal cells; submc, submesothelial cells. Bar, 50 μm (A), 10 μm (C,E).
Co-staining of lacZ and desmin reveals that 6.4% (ML) and 4.7% (LL) of desmin+ cells (including both HSCs and PMCs) are positive for lacZ in the E11.5 livers (Fig. 6C,D). Then, the percentage of the lacZ+/desmin+ cells increases to 15.0% (ML) and 18.3% (LL) in E12.5 livers (Fig. 6D). Based on these data, we estimate that approximately 8.6% (ML) and 13.6% (LL) of HSCs and PMCs are generated from the Wt1+ MC/SubMCs labeled with lacZ during 1-day between E11.5 to E12.5 stages. No further increase in the percentage of lacZ+/desmin+ cells is noted between E12.5 and E13.5.
One day after tamoxifen injection, 17.4±3.1% (ML) and 8.0±1.7% (LL) of Alcam+ MC/SubMCs express lacZ in E11.5 livers, suggesting this is the maximal lacZ labeling efficiency rate using this method. Thus, if we consider this efficiency rate and normalize our data on the percentage of lacZ+ MC/SubMC-derived HSCs and PMCs, 86.2% (ML: 15.0/17.4×100) and 228.8% (LL: 18.3/8.0×100) of HSCs and PMCs would have been derived from MC/SubMC at E12.5. The normalized contribution in the left lobes exceeding 100%, implies that lacZ+ MC/SubMC-derived HSCs and PMCs actively divide during liver morphogenesis. These data support a conclusion that MC/SubMCs have a major contribution to the genesis of HSCs and PMCs in developing livers.
No Contribution of MC/SubMCs to SECs, Kupffer Cells, and Hepatoblasts
We further examined whether Wt1+ MC/SubMCs give rise to PMCs and different liver cell types. PMCs express SMA and Jag1 around the veins around E12.5 livers.13,14 Two days after tamoxifen injection, SMA+ or Jag1+ PMCs coexpress lacZ in E12.5 livers (Fig. 6E). In contrast, no lacZ expression is detected in CD31+ or Flk1+ SECs F4/80+ Kupffer cells, E-cadherin+ hepatoblasts, CD45+ leukocytes, and Ter-119+ erythrocytes in E12.5 livers (Supporting Fig. 2). Identical staining patterns are also found in the E13.5 livers after tamoxifen injection at E10.5 (data not shown). These data indicate that Wt1+ MC/SubMCs contribute to HSCs and PMCs, but not to SECs, Kupffer cells, and hepatoblasts in mouse liver morphogenesis.
MC/SubMCs Give Rise to HSCs and PMCs including PFBs, SMCs, and FBs
To minimize potential artifacts of lacZ immunostaining from the Rosa26lacZflox mice, we also used the Rosa26mTmGflox Cre-activated reporter, which upon Cre recombination switches from expression of red fluorescent protein (Tomato) to membrane-localized GFP (Supporting Fig. 3A).19 Three days after tamoxifen injection, GFP expression is found in 24.3% (ML) and 23.4% (LL) of desmin+ HSCs and PMCs in E13.5 livers (Supporting Fig. 3B,D). These values are higher than those obtained in the E13.5 Rosa26lacZ embryos shown in Fig. 6D (12.0% and 15.4% in ML and LL, respectively), probably due to a high sensitivity of GFP immunostaining or recombination efficiency of the Rosa26mTmG locus. Although GFP is found in SMA+ PMCs, the adjacent CD31+ endothelial cells do not express GFP in the veins (Supporting Fig. 3B).
Next, we tested the contribution of MC/SubMCs at a later stage. When we injected tamoxifen at E11.5 and examined the E14.5 livers, we similarly observed GFP signals in desmin+ HSCs and PMCs and Alcam+ MC/SubMCs in E14.5 livers, but not in the Wt1+/+; Rosa26mTmGflox/+ littermate livers (Supporting Fig. 3C). In accordance with the decreased number of Wt1+ MC/SubMCs from E11.5 to E12.5 livers (Fig. 2A,B), the contribution of the Wt1+ MC/SubMCs to GFP+ HSCs and PMCs significantly decreases from the E13.5 (tamoxifen at E10.5) to the E14.5 (tamoxifen at E11.5) (Supporting Fig. 3D).
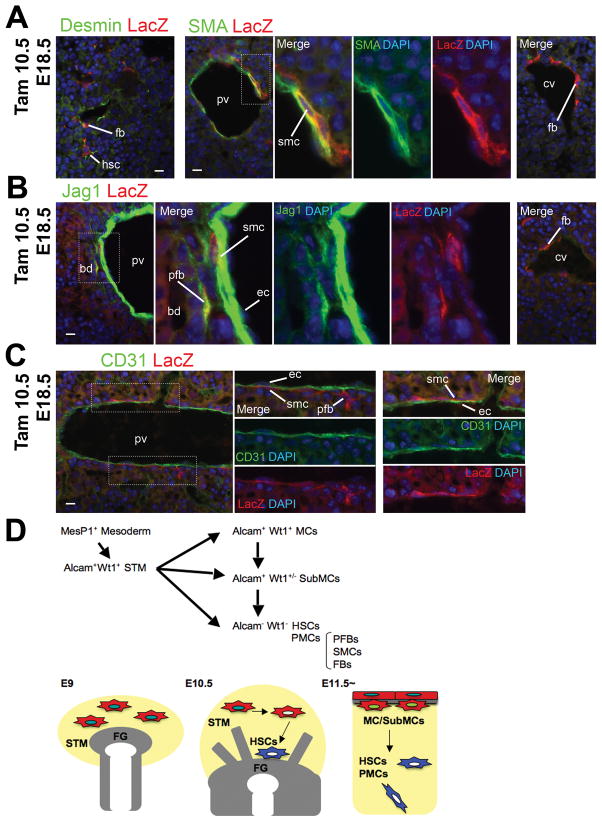
To allow lineage tracing of periportal mesenchymal cells, we injected tamoxifen at E10.5 and analyzed the embryos at E18.5, at which time point the portal veins are distinguishable due to the presence of the bile ducts developed around them. The E18.5 livers show lacZ expression in desmin+ HSCs (Fig. 7A). Around the central veins, there are lacZ+ mesenchymal cells, which we refer as FBs, expressing desmin, but not SMA and Jag1 (Fig. 7A,B). Around the portal veins, two different mesenchymal cells express lacZ; SMCs expressing SMA near the portal veins (Fig. 7A) and PFBs expressing Jag1 adjacent to the portal veins (Fig. 7B). Within the portal venous wall, lacZ+ SMCs are located adjacent to the CD31+ lacZ− endothelial cells (Fig. 7C). The percentages of lacZ+/desmin+ cells in E18.5 embryos are consistent with those in E12.5 and E13.5 (Fig. 6D). These data demonstrate that Wt1+ MC/SubMCs give rise to HSCs and PMCs including PFBs and SMCs around the portal veins and FBs around the central veins during liver development.
Fig. 7.
Wt1+ MC/SubMCs give rise to HSCs and PMCs including PFBs, SMCs, and FBs during liver morphogenesis. (A-C) Conditional labeling of Wt1+ MC/SubMCs using the Wt1CreERT2 and Rosa26lacZflox mice. Immunohistochemistry of CD31, desmin, Jag1, lacZ, and SMA in the E18.5 livers after tamoxifen injection at E10.5. Nuclei were counterstained with DAPI. Note that the expression of lacZ is seen in desmin+ HSCs and SMA+ SMCs in the portal veins (A). The percentages of the lacZ+ HSCs and PMCs in E18.5 livers are shown in Fig. 6D. PFBs adjacent to the bile duct coexpress lacZ (B). FBs around the central veins express desmin and lacZ (A,B). LacZ+ SMCs closely contact to CD31+ lacZ− endothelial cells in the portal veins (C). bd, bile ducts; cv, central veins; ec, endothelial cells; fb, fibroblasts; hsc, hepatic stellate cells; pfb, portal fibroblasts; pv, portal veins; smc, smooth muscle cells. Bar, 10 μm. (D) Summary of the cell lineage analyses. MesP1+ mesoderm gives rise to the STM. Alcam+ Wt1+ STM loses expression of Alcam and Wt1 and differentiates into HSCs and PMCs around E10.5. From E11.5, MC/SubMCs show the similar phenotype of STM expressing Alcam and Wt1. MC/SubMCs lose expression of Alcam and Wt1, migrate inward from the liver surface, and give rise to HSCs and PMCs including PFBs, SMCs, and FBs during liver development.
Discussion
The developmental origin of HSCs has been the matter of controversy. Our previous study demonstrated the mesodermal origin of HSCs in embryos using the MesP1Cre mice.13 However, the MesP1+ cells contribute to a broad range of mesodermal components in embryos, and the relationship of STM or mesothelium with the HSC lineage from mesoderm, was not clear.13,16 In the present study, we first demonstrate that the MesP1+ mesoderm gives rise to the STM before liver development (Fig. 7D). The cell lineage tracing using the tamoxifen-inducible Wt1CreERT2 mice reveals that the STM gives rise to HSCs, PMCs, and liver mesothelium at the onset of liver development. Furthermore, we demonstrate that the liver mesothelium generates HSCs and PMCs including PFBs, smooth muscle cells, and FBs around the central veins during liver morphogenesis (Fig. 7D). Our data also clarify that the HSC lineage is distinct from that of hepatoblasts, SECs, and Kupffer cells during embryogenesis. To our knowledge, the present study is the first report to identify the HSC lineage by genetic-based lineage-tracing analyses in mouse embryogenesis.
Immunohistochemistry shows that Wt1 is expressed in MCs and some SubMCs in E11.5 liver. We also observe a few mesenchymal cells weakly expressing Wt1 near the surface inside the liver. These cells are probably transient cells from Wt1+ SubMCs to Wt1− HSCs (Fig. 2A). Although the lacZ+ HSCs and PMCs inside the liver do not express Wt1, it may be possible that the rare Wt1+ mesenchymal cells inside the liver give rise to lacZ+ Wt1− HSCs and PMCs without contribution from Wt1+ MC/SubMCs in our experimental condition. If this is the case, the % of lacZ+/desmin+ HSCs and PMCs should be constant from E11.5 to E12.5. However, as shown in Fig. 6D, the percentage of lacZ+/desmin+ HSCs and PMCs increases from E11.5 to E12.5, supporting the contribution of MC/SubMCs to HSCs and PMCs.
Our conditional cell tracing reveals the common origin of HSCs, PFBs and SMCs of the portal veins, and FBs around the central veins in liver development. Previously, electron microcopy classified mesenchymal cells near the central veins into SMCs, myofibroblasts, and second-layered cells in the normal rat liver.4 Since there are no markers to distinguish these mesenchymal cells around the central veins, we referred these cells as FBs in the present study. Upon injury to adult liver, all these cell types respond and initiate fibrogenesis. For instance, cholestasis caused by bile duct ligation induces myofibroblastic differentiation of PFBs in the genesis of biliary fibrosis similar to transdifferentiation of HSCs commonly seen after hepatotoxic parenchymal damage.23 Injection of pig serum to rats results in progressive liver fibrosis which is associated with “activation” of myofibroblasts and second-layered cells around the central veins.4 The fact that all these “fibrogenic” cell types are derived from MC/SubMCs, suggests that clarifying the mechanisms underlying the cell fate decision of HSCs and PFBs from MC/SubMCs in developing livers, should facilitate understanding of how microenvironments in the liver control the phenotypes of HSCs and PFBs and their transdifferentiation to myofibroblasts in adult livers.
Our results demonstrate that the HSC lineage is distinct from a SEC lineage during liver development. However, the mesothelium was previously shown to contribute to both HSCs and SECs in chick embryos by vital dye labeling.11 The reason for this discrepancy is not clear at the present time, but the dye labeling may cause non-specific staining of the SEC precursors in chick embryos. It may also be attributable to a difference in the anatomical and spatial characteristics of liver morphogenesis between the species. Lastly, we noticed that not all STM expresses Wt1 in E9.5 mouse embryos. Obviously, the STM is a heterogeneous population and we cannot rule out a possibility that Wt1− STM might contribute to SEC in mouse embryogenesis.
The Wt1+ mesothelium covering the developing gut and lung is shown to migrate inward and contribute to smooth muscle cells during mouse embryogenesis.24,25 In the developing heart, the epicardium undergoes an epithelial-mesenchymal transition (EMT) and gives rise to smooth muscle cells, endothelium, and cardiomyocytes.17 Similar to these reports, we find that Wt1+ MC/SubMCs migrate inward from the liver surface and give rise to HSCs and PMCs during liver morphogenesis. These findings suggest that a contribution of the mesothelium to different mesenchymal cell lineages is a common mechanism in the organogenesis of the liver, lung, and heart.
Deletion of Wt1 causes reduced liver size and abnormal expression of SMA in the HSCs.12 Wt1-deficient liver MCs have decreased expression of pleiotrophin, a hepatotrophic factor.26,27 Recently, Wt1 is shown to directly regulate Snail1 expression, and thereby to induce an EMT in the epicardium.28 Similar to the Wt1-knockout livers,β-catenin deletion in liver mesenchymal cells using the Dermo1Cre results in a small liver size and abnormal expression of SMA in HSCs.29 Although it remains to be determined whether MCs differentiate into SubMCs via EMT in the liver development, Wt1 and β-catenin may regulate HSC differentiation from MC/SubMCs.
In conclusion, we demonstrate that the mesodermal STM gives rise to MC/SubMCs. Moreover, MC/SubMCs give rise to both HSCs and PMCs including PFBs, SMCs, and FBs during liver morphogenesis. Further studies on the mechanisms underlying a transition from MC/SubMCs to HSCs and PMCs may lead to better understanding of cell fate regulation of HSCs and PFBs in both embryonic and adult livers.
Supplementary Material
Acknowledgments
The authors thank Peng Li and Henry Sucov for providing MesP1Cre mice and Raul Lazaro, Kiki Ueno, and Bin Xie for technical assistance.
Financial Support
Supported by pilot project funding (K.A) from P50AA011999 (H.T.); R24AA12885 (H.T.); and Medical Research Service of Department of Veterans Affairs (H.T.).
List of Abbreviations
- Alcam
activated leukocyte cell adhesion molecule
- CreERT2
Cre and modified estrogen receptor
- E
embryonic day
- EMT
epithelial-mesenchymal transition
- FBs
fibroblasts
- GFP
green fluorescent protein
- HSCs
hepatic stellate cells
- Jag1
Jagged 1
- LL
left lobe
- MCs
mesothelial cells
- ML
median lobe
- PFBs
portal fibroblasts
- PMCs
perivascular mesenchymal cells
- SECs
sinusoidal endothelial cells
- SMA
α-smooth muscle actin
- SMCs
smooth muscle cells
- STM
septum transversum mesenchyme
- SubMCs
submesothelial cells
- Wt1
Wilms tumor 1 homolog
References
- 1.Friedman SL. Hepatic stellate cells: protean, multifunctional, and enigmatic cells of the liver. Physiol Rev. 2008;88:125–172. doi: 10.1152/physrev.00013.2007. [DOI] [PMC free article] [PubMed] [Google Scholar]
- 2.Bataller R, Brenner DA. Liver fibrosis. J Clin Invest. 2005;115:209–218. doi: 10.1172/JCI24282. [DOI] [PMC free article] [PubMed] [Google Scholar]
- 3.Popov Y, Schuppan D. Targeting liver fibrosis: strategies for development and validation of antifibrotic therapies. Hepatology. 2009;50:1294–1306. doi: 10.1002/hep.23123. [DOI] [PubMed] [Google Scholar]
- 4.Bhunchet E, Wake K. Role of mesenchymal cell populations in porcine serum-induced rat liver fibrosis. Hepatology. 1992;16:1452–1473. doi: 10.1002/hep.1840160623. [DOI] [PubMed] [Google Scholar]
- 5.Zarets KS. Regulatory phases of early liver development: paradigms of organogenesis. Nat Rev Genet. 2002;3:499–512. doi: 10.1038/nrg837. [DOI] [PubMed] [Google Scholar]
- 6.Si-Tayeb K, Lemaigre FP, Duncan SA. Organogenesis and development of the liver. Dev Cell. 2010;18:175–189. doi: 10.1016/j.devcel.2010.01.011. [DOI] [PubMed] [Google Scholar]
- 7.Enzan H, Himeno H, Hiroi M, Kiyoku H, Saibara T, Onishi S. Development of hepatic sinusoidal structure with special reference to the Ito cells. Microsc Res Tech. 1997;39:336–349. doi: 10.1002/(SICI)1097-0029(19971115)39:4<336::AID-JEMT4>3.0.CO;2-F. [DOI] [PubMed] [Google Scholar]
- 8.Kalinichenko VV, Zhou Y, Bhattacharyya D, Kim W, Shin B, Bambal K, et al. Haploinsufficiency of the mouse Forkhead Box f1 gene causes defects in gall bladder development. J Biol Chem. 2002;277:12369–12374. doi: 10.1074/jbc.M112162200. [DOI] [PubMed] [Google Scholar]
- 9.Kolterud A, Wandzioch E, Carlsson L. Lhx2 is expressed in the septum transversum mesenchyme that becomes an integral part of the liver and the formation of these cells is independent of functional Lhx2. Gene Expr Patterns. 2004;4:521–528. doi: 10.1016/j.modgep.2004.03.001. [DOI] [PubMed] [Google Scholar]
- 10.Cassiman D, Barlow A, Vander Borght S, Libbrecht L, Pachnis V. Hepatic stellate cells do not derive from the neural crest. J Hepatol. 2006;44:1098–1104. doi: 10.1016/j.jhep.2005.09.023. [DOI] [PubMed] [Google Scholar]
- 11.Pérez-Pomares JM, Carmona R, González-Iriarte M, Macías D, Guadix JA, Muñoz-Chápuli R. Contribution of mesothelium-derived cells to liver sinusoids in avian embryos. Dev Dyn. 2004;229:465–474. doi: 10.1002/dvdy.10455. [DOI] [PubMed] [Google Scholar]
- 12.Ijpenberg A, Pérez-Pomares JM, Guadix JA, Carmona R, Portillo-Sánchez V, Macías D, et al. Wt1 and retinoic acid signaling are essential for stellate cell development and liver morphogenesis. Dev Biol. 2007;312:157–170. doi: 10.1016/j.ydbio.2007.09.014. [DOI] [PubMed] [Google Scholar]
- 13.Asahina K, Tsai SY, Li P, Ishii M, Maxson RE, Jr, Sucov HM, et al. Mesenchymal origin of hepatic stellate cells, submesothelial cells, and perivascular mesenchymal cells during mouse liver development. Hepatology. 2009;49:998–1011. doi: 10.1002/hep.22721. [DOI] [PMC free article] [PubMed] [Google Scholar]
- 14.Suzuki K, Tanaka M, Watanabe N, Saito S, Nonaka H, Miyajima A. p75 Neurotrophin receptor is a marker for precursors of stellate cells and portal fibroblasts in mouse fetal liver. Gastroenterology. 2008;135:270–281. doi: 10.1053/j.gastro.2008.03.075. [DOI] [PubMed] [Google Scholar]
- 15.Loo CK, Wu XJ. Origin of stellate cells from submesothelial cells in a developing human liver. Liver Int. 2008;28:1437–1445. doi: 10.1111/j.1478-3231.2008.01788.x. [DOI] [PubMed] [Google Scholar]
- 16.Saga Y, Miyagawa-Tomita S, Takagi A, Kitajima S, Miyazaki J, Inoue T. MesP1 is expressed in the heart precursor cells and required for the formation of a single heart tube. Development. 1999;126:3437–3447. doi: 10.1242/dev.126.15.3437. [DOI] [PubMed] [Google Scholar]
- 17.Zhou B, Ma Q, Rajagopal S, Wu SM, Domian I, Rivera-Feliciano J, et al. Epicardial progenitors contribute to the cardiomyocyte lineage in the developing heart. Nature. 2008;454:109–113. doi: 10.1038/nature07060. [DOI] [PMC free article] [PubMed] [Google Scholar]
- 18.Soriano P. Generalized lacZ expression with the ROSA26 Cre reporter strain. Nat Genet. 1999;21:70–71. doi: 10.1038/5007. [DOI] [PubMed] [Google Scholar]
- 19.Muzumdar MD, Tasic B, Miyamichi K, Li L, Luo L. A global double-fluorescent Cre reporter mouse. Genesis. 2007;45:593–605. doi: 10.1002/dvg.20335. [DOI] [PubMed] [Google Scholar]
- 20.Armstrong JF, Pritchard-Jones K, Bickmore WA, Hastie ND, Bard JB. The expression of the Wilms’ tumour gene, WT1, in the developing mammalian embryo. Mech Dev. 1993;40:85–97. doi: 10.1016/0925-4773(93)90090-k. [DOI] [PubMed] [Google Scholar]
- 21.Nakamura E, Nguyen MT, Mackem S. Kinetics of tamoxifen-regulated Cre activity in mice using a cartilage-specific CreERT to assay temporal activity windows along the proximodistal limb skeleton. Dev Dyn. 2006;235:2603–2612. doi: 10.1002/dvdy.20892. [DOI] [PubMed] [Google Scholar]
- 22.Zhou B, von Gise A, Ma Q, Hu YW, Pu WT. Genetic fate mapping demonstrates contribution of epicardium-derived cells to the annulus fibrosis of the mammalian heart. Dev Biol. 2010;338:251–261. doi: 10.1016/j.ydbio.2009.12.007. [DOI] [PMC free article] [PubMed] [Google Scholar]
- 23.Dranoff JA, Wells RG. Portal fibroblasts: Underappreciated mediators of biliary fibrosis. Hepatology. 2010;51:1438–1444. doi: 10.1002/hep.23405. [DOI] [PMC free article] [PubMed] [Google Scholar]
- 24.Wilm B, Ipenberg A, Hastie ND, Burch JB, Bader DM. The serosal mesothelium is a major source of smooth muscle cells of the gut vasculature. Development. 2005;132:5317–5328. doi: 10.1242/dev.02141. [DOI] [PubMed] [Google Scholar]
- 25.Que J, Wilm B, Hasegawa H, Wang F, Bader D, Hogan BL. Mesothelium contributes to vascular smooth muscle and mesenchyme during lung development. Proc Natl Acad Sci USA. 2008;105:16626–16630. doi: 10.1073/pnas.0808649105. [DOI] [PMC free article] [PubMed] [Google Scholar]
- 26.Onitsuka I, Tanaka M, Miyajima A. Characterization and functional analyses of hepatic mesothelial cells in mouse liver development. Gastroenterology. 2010;138:1525–1535. doi: 10.1053/j.gastro.2009.12.059. [DOI] [PubMed] [Google Scholar]
- 27.Asahina K, Sato H, Yamasaki C, Kataoka M, Shiokawa M, Katayama S, et al. Pleiotrophin/heparin-binding growth-associated molecule as a mitogen of rat hepatocytes and its role in regeneration and development of liver. Am J Pathol. 2002;160:2191–2205. doi: 10.1016/S0002-9440(10)61167-4. [DOI] [PMC free article] [PubMed] [Google Scholar]
- 28.Martínez-Estrada OM, Lettice LA, Essafi A, Guadix JA, Slight J, Velecela V, et al. Wt1 is required for cardiovascular progenitor cell formation through transcriptional control of Snail and E-cadherin. Nat Genet. 2010;42:89–93. doi: 10.1038/ng.494. [DOI] [PMC free article] [PubMed] [Google Scholar]
- 29.Berg T, Delanghe S, Al Alam D, Utley S, Estrada J, Wang KS. β-Catenin regulates mesenchymal progenitor cell differentiation during hepatogenesis. J Surg Res. 2010;164:276–285. doi: 10.1016/j.jss.2009.10.033. [DOI] [PMC free article] [PubMed] [Google Scholar]
Associated Data
This section collects any data citations, data availability statements, or supplementary materials included in this article.


