
Figure 7.
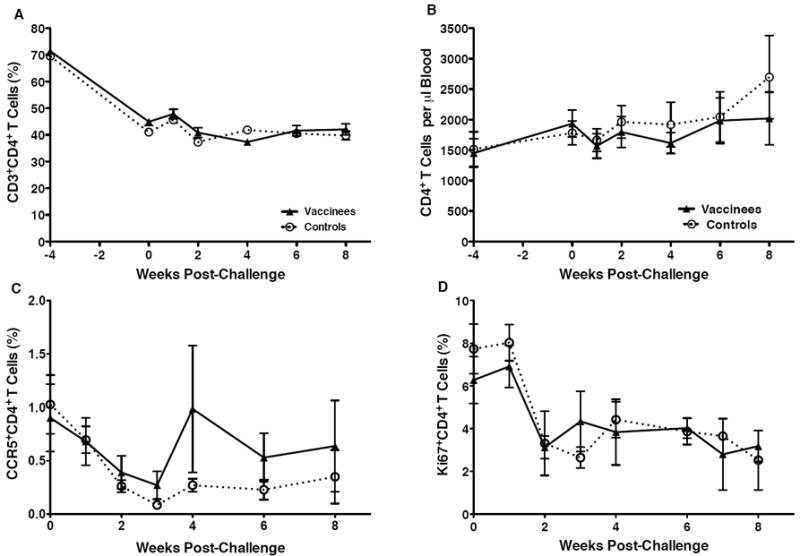
CD4+T cell frequencies and activation in peripheral blood. Panel A and Panel B show the average percentages of CD3+CD4+T cells within PBMC and the absolute numbers of CD3+CD4+T cells per microliter of blood, respectively, in peripheral blood of vaccinated and unvaccinated macaques. In Panels C and D, the change in the frequencies of CCR5+ (Panel C) or Ki67+ (Panel D) CD4+T cells after oral SIV infection are shown. Average values for vaccinated and unvaccinated macaques are presented with SEM.