Abstract
The regional adaptation of knee cartilage morphology to the kinematics of walking has been suggested as an important factor in the evaluation of the consequences of alteration in normal gait leading to osteoarthritis. The purpose of this study was to investigate the association of spatial cartilage thickness distributions of the femur and tibia in the knee to the knee kinematics during walking. Gait data and knee MR images were obtained from 17 healthy volunteers (age 33.2±9.8 years). Cartilage thickness maps were created for the femoral and tibial cartilage. Locations of thickest cartilage in the medial and lateral compartments in the femur and tibia were identified using a numerical method. The flexion-extension (FE) angle associated with the cartilage contact regions on the femur, and the anterior-posterior (AP) translation and internal-external (IE) rotation associated with the cartilage contact regions on the tibia at the heel strike of walking were tested for correlation with the locations of thickest cartilage. The locations of the thickest cartilage had relatively large variation (SD 8.9°) and was significantly associated with the FE angle at heel strike only in the medial femoral condyle (R2=0.41, p<0.01). The natural knee kinematics and contact surface shapes seem to affect the functional adaptation of knee articular cartilage morphology. The sensitivity of cartilage morphology to kinematics at the knee during walking suggests that regional cartilage thickness variations are influenced by both loading and the number of loading cycles. Thus walking is an important consideration in the analysis of the morphological variations of articular cartilage, since it is the dominant cyclic activity of daily living. The sensitivity of cartilage morphology to gait kinematics is also important in understanding the etiology and pathomechanics of osteoarthritis.
Keywords: Knee kinematics, Gait, Tibiofemoral cartilage, Cartilage morphology, Osteoarthritis
1. Introduction
The factors influencing the phenotypic thickness variation in the articular cartilage at the knee is an important consideration in understanding pathomechanics of degenerative disease such as osteoarthritis. It has been suggested that the joint loading conditions during normal activities can affect knee articular cartilage morphology (Andriacchi et al., 2004a, Jones et al., 2000). While it has been reported that loading during activities such as walking influence the medial-lateral variations in bone density (Hurwitz et al., 1998) and cartilage thickness (Miyazaki et al., 2002), the kinematic factors that affect variations in cartilage thickness are still not well understood. Yet, the regional sensitivity of cartilage morphology is important since it has been suggested that the kinematic changes at the knee can lead to osteoarthritis (Andriacchi et al., 2009).
The mechanics of walking offer the opportunity to test the relationship between gait mechanics and cartilage since patterns of movement and loading are repeatable (Kadaba et al., 1989). For example, axial knee joint loading for normal walking has three peak amplitudes during the stance phase of gait (Schipplein and Andriacchi, 1991) with a large force at heel strike. It has also been shown (Koo and Andriacchi, 2008) that the anterior-posterior (AP) position of contact on the medial and lateral compartment of the knee changes during the heel strike phase of walking and can be related to a unique combination of knee flexion, AP position and Internal-external (IE) rotation.
The loading and kinematic conditions that occur at heel strike during walking offer a unique opportunity to test for a relationship between regional cartilage thickness and individual variation in the kinematics of the knee during walking. Specifically, it would be important to know if healthy cartilage is adapted to normal kinematics during walking, since it has been suggested that kinematic changes associated with conditions such as ACL injury can lead to a degenerative pathway for cartilage (Chaudhari et al., 2008, Lohmander et al., 2004) by shifting loads to regions of cartilage that are not conditioned to sustain the chronic loads associated with the mechanics of walking (Andriacchi et al., 2009).
The observations described above suggest that if knee kinematics influence variations in cartilage thickness then there would be correlations between the knee kinematics during heel strike of walking and cartilage thickness.
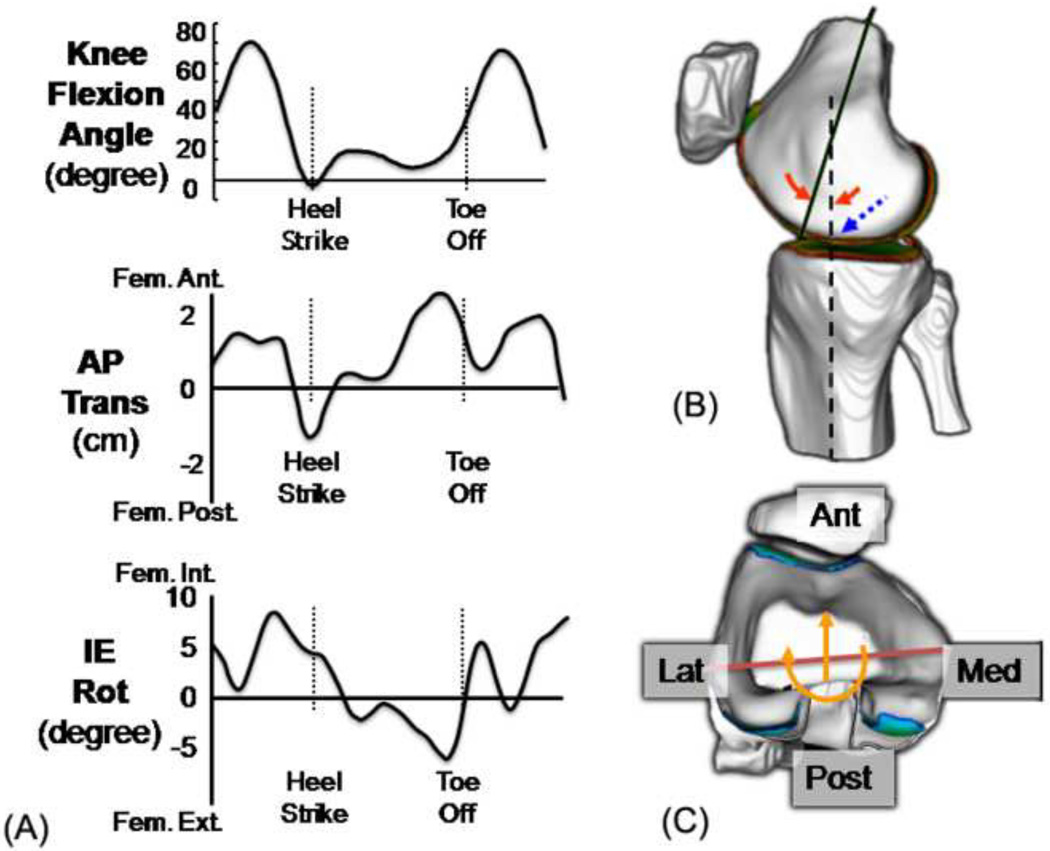
The purpose of this study was to test the hypothesis that the AP spatial cartilage thickness distributions in the medial and lateral compartments of the distal femur and proximal tibia are influenced by the knee flexion angle (primary motion of the knee) as shown in Figure 1 and the AP translation and internal-external (IE) rotation (secondary motions of the knee) that occur at heel strike during walking.
Fig 1.
(a) Primary (FE) and secondary (AP and IE) kinematics in the knee during walking, (b) femoral contact location (dotted arrow) predicted from FE angle (solid arrow), (c) tibial contact location (solid line) predicted from AP translation and IE rotation
2. Methods
Participants
Seventeen healthy volunteers (10 males and 7 females) without history of significant knee injuries enrolled in the study. Average (± One Standard Deviation) age was 33.2±9.8 years old and average BMI was 23.0±2.4 kg/m2. The study was approved by the IRB at Stanford University (California, USA) and an informed consent was obtained from each volunteer prior to testing. Each volunteer underwent knee magnetic resonance imaging (MRI) and gait testing as explained below.
MR Imaging and 3D Modeling of Knee Cartilage
High contrast MR images optimized for articular cartilage were obtained for the left knees of the volunteers with a General Electric 1.5T clinical scanner (GE Medical Systems, Milwaukee, WI) with a standard transmit-receive extremity coil. We used a fat-suppressed three-dimensional (3D) spoiled gradient recalled echo (SPGR) sequence in the sagittal plane. MRI parameters were set to TR=60 ms, TE=5 ms, flip angle=40°, field of view 140×140 mm, slice thickness of 1.5 mm, 60 slices and matrix 256×256, and scan time 10 minutes 18 seconds.
Subjects were advised to minimize load bearing activities before coming to the MRI site and they were required to rest in a chair to unload their knee for 15–20 minutes before starting the MR imaging. Each subject’s knee was carefully positioned in the MRI using form pads underneath the knee and shank to straighten the leg. The knee internal-external rotation was also controlled using form pads to match the anatomical sagittal plane to the MRI sagittal plane.
The SPGR MR sequence has been reported to provide high contrast cartilage images which can be used to delineate the articular cartilage boundary and measure the morphology of the cartilage (Disler et al., 1995, Disler, 1997). The articular cartilage on the distal femur and proximal tibia was segmented from each slice of the MR images using our custom semi-automatic software (Koo et al., 2005). The accuracy and repeatability of creating 3D cartilage models from MR images were reported in our previous study (Koo et al., 2005, Koo et al., 2009). The segmented images of the femoral and tibial cartilage were combined and reconstructed into 3D models with fine polygonal surface meshes. Cartilage thickness was calculated for each vertex on the articular surface meshes by calculating the distance to the bone-cartilage interfacial surface in the surface normal direction using the custom software.
Gait Measurements
Gait tests were performed with an optoelectronic motion capture system (Qualysis, Sweden) using the point cluster technique (Andriacchi et al., 1998) at a self-selected normal walking speed. Flexion-extension (FE), anterior-posterior (AP) translation and internal-external (IE) rotation were calculated from the gait data (Andriacchi et al., 2004b) as shown in Figure 1(a). This study focused on the knee kinematics at heel strike when the contact force is highest during walking. The heel strike for each trial was identified using force plate data and the FE angle, AP translation and IE rotation at the knee were calculated for this time point.
The FE angle of the knee at heel strike is associated with the tibiofemoral contact locations on the femoral cartilage at heel strike in both the medial and lateral condyles (Figure 1(b)). However, for the tibial cartilage, the secondary motions of the knee - AP translation and IE rotation between the femur and tibia - are associated with the tibiofemoral contact regions as described in our previous study (Andriacchi et al., 2009) and as shown in Figure 1(c).
Cartilage Thickness Analysis
The femoral and tibial cartilage models created in the previous step were utilized to identify the location of the thickest cartilage in each compartment as explained below.
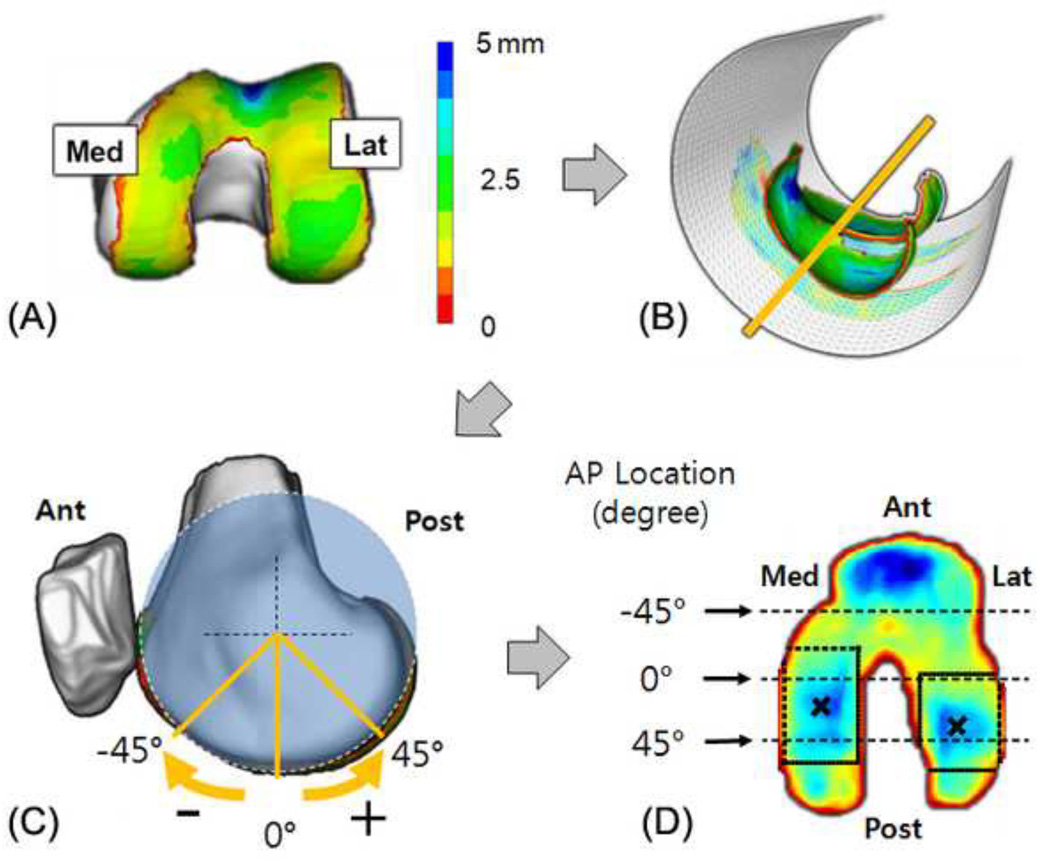
Firstly, the cartilage thickness maps were projected onto surfaces to flatten their profiles. The central axis of the femoral cartilage from the sagittal view of the MRI was calculated by fitting a cylinder whose axis is vertical to the sagittal view (pseudo-transepicondylar line) to the points on the surface of the femoral cartilage model (Chaudhuri, 1990). The cartilage thickness map on the femoral cartilage model was projected onto the surface of the fitted cylinder to create a two-dimensional (2D) femoral cartilage thickness map as shown in Figure 2(b). The long axis of the femur in our data was very closely aligned with the superior-inferior direction of the MRI in the sagittal view with an average±one standard deviation of 4.5±1.9 degrees. Thus the coordinate system on the femoral cartilage was set by placing the long axis of the femur in the sagittal view of the MRI along the superior-inferior direction of the MRI and through the center of the fitted cylinder. The rotational location on the distal femoral surface in the sagittal view of the MRI was determined as anterior direction negative and the posterior direction positive values (Figure 2(c)).
Fig 2.
(a) Femoral cartilage thickness map, (b) a fitted cylinder to project the thickness map, (c) rotational AP location represented as degree relative to the long axis of the femur, (d) rectangular search region on each condyle to find the location of thickest cartilage in the flattened cartilage thickness map
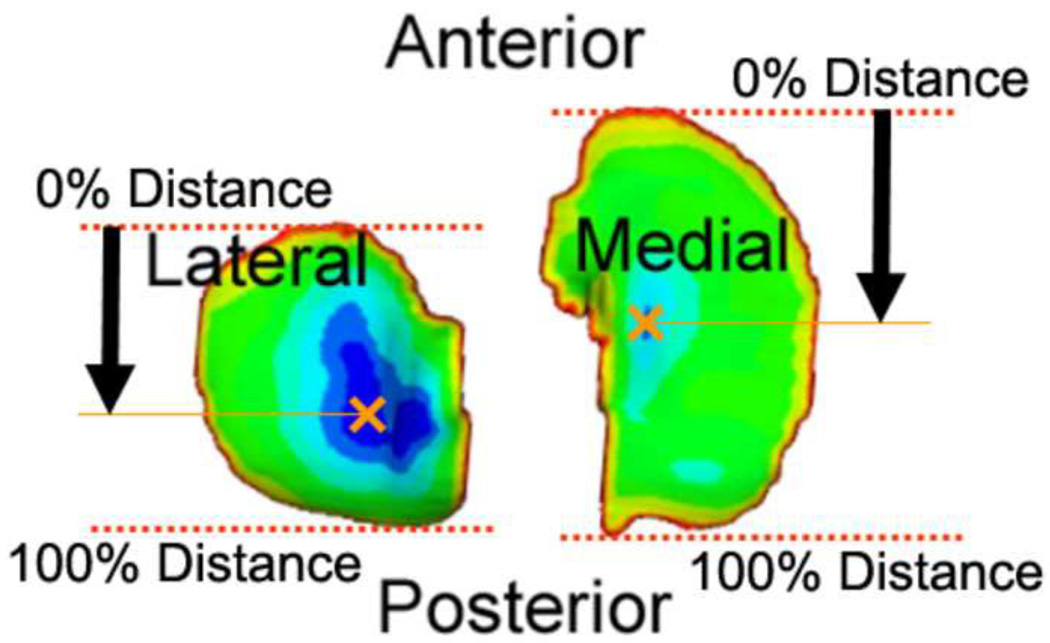
The thickness map of the tibial cartilage was projected onto the transverse plane of the MRI to generate a 2D tibial cartilage thickness map. Anterior and posterior ends of each compartment of tibial cartilage were set to 0 percent and 100 percent, respectively, to represent the relative location of the thickest cartilage in the AP direction as shown in Figure 3.
Fig 3.
Tibial cartilage thickness map projected on to a plane and representation of AP location of the thickest cartilage in each compartment
The locations (centroids) of the thickest cartilage were identified in the medial and lateral condyles of the femoral cartilage and the medial and lateral plateaus of the tibial cartilage. To calculate the locations objectively, an optimization algorithm was used to fit a 2D Gaussian distribution of thickness to the local region on the 2D cartilage thickness map (Figure 2(d)). This optimization algorithm was implemented using MATLAB (Mathworks, USA). The centroids were represented using the axis determined on the femoral cartilage in the sagittal view and tibial cartilage in the transverse view.
Statistical Analysis
The association between the FE angle at heel strike and the locations of thickest cartilage in the medial and lateral condyles of femoral cartilage were tested by calculating Pearson’s correlation coefficients. Additionally, the associations of the AP translation and IE rotation with the locations of the thickest cartilage in the medial and lateral plateaus of tibial cartilage were also tested with multivariate correlation analysis.
3. Results
Femoral Cartilage Thickness
The verage FE angle at heel strike for the left knee of 17 volunteers was −2.1±3.3° (hyperextension); 25th and 75th percentiles were −4.8° and 0.3°, respectively.
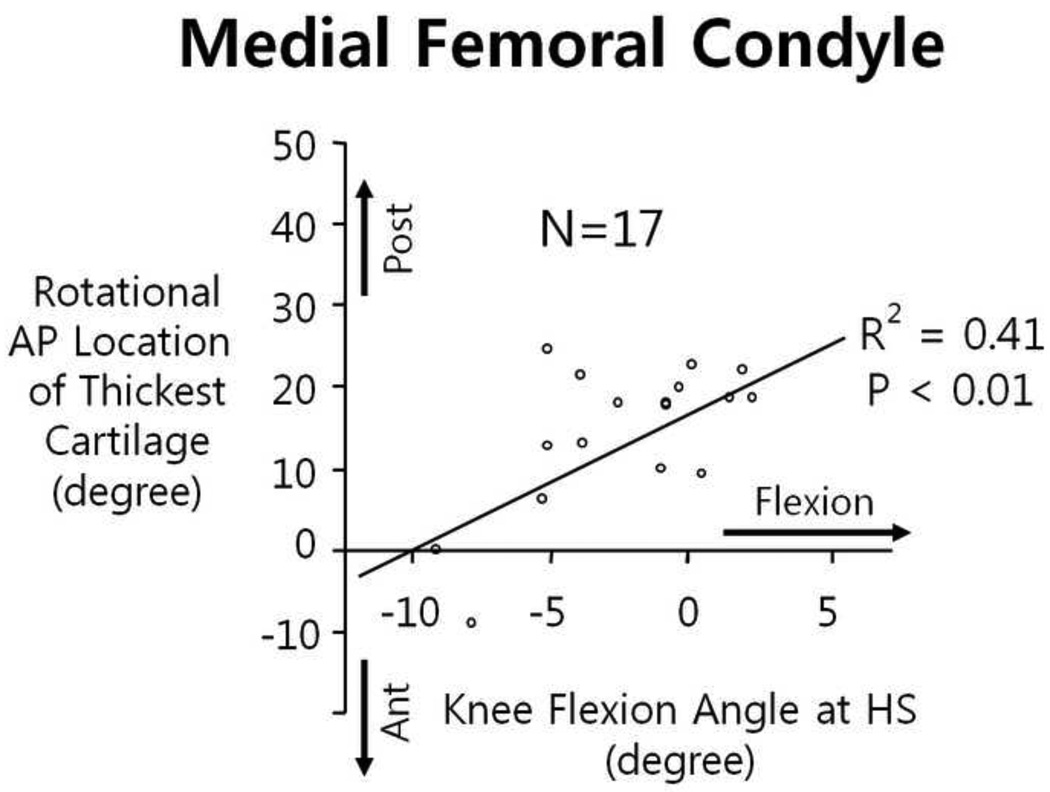
Angular locations of the thickest cartilage on the femoral cartilage were identified in both medial and lateral condyles. The locations of the thickest cartilage in the medial condyles were significantly correlated (R2=0.41, p<0.01) with the knee FE angle at heel strike, while the locations in the lateral condyles were not associated with the FE angle (Figure 4).
Fig 4.
Knee flexion angle at heel strike was significantly associated the rotational AP location of the thickest cartilage only in the medial femoral condyle.
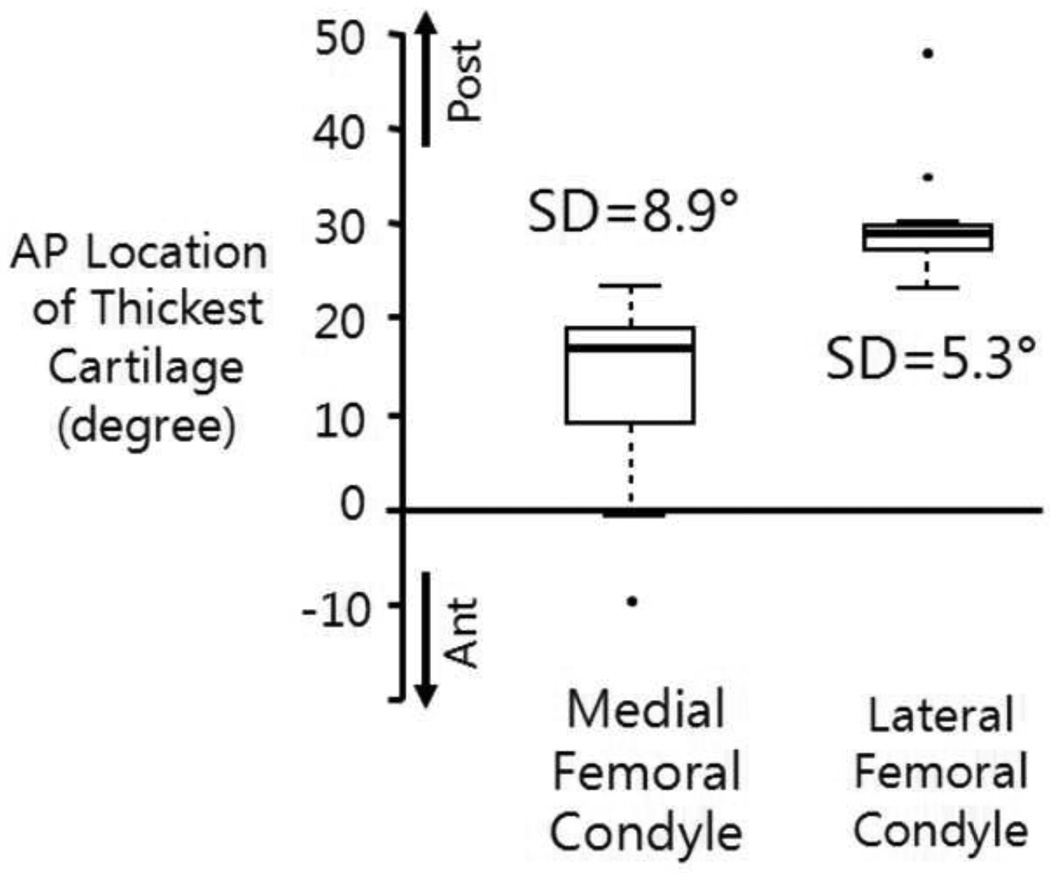
Further analysis of the angular locations of the thickest cartilage on the medial and lateral condyles showed that the locations on the lateral condyles had smaller variations (one standard deviation 5.3° vs. 8.9°) and were located in more posterior regions (median location 29.1° vs. 16.9°) as shown in Figure 5.
Fig 5.
Comparisons of the average and standard deviation of the locations of thickest cartilage between the medial and lateral femoral condyles
Tibial Cartilage Thickness
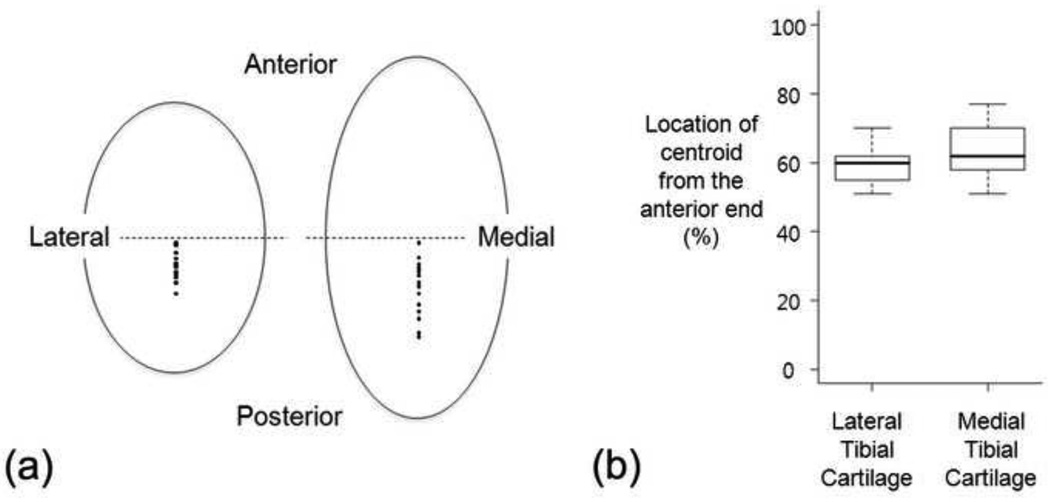
Anterior-posterior locations of the thickest cartilage on the tibial cartilage were not associated with AP translation, IE rotation or a combination of the AP and IE according to the multivariate correlation analysis. The thickest locations on both medial and lateral plateaus were located posterior to the mid-line of the tibial cartilage (59.4% and 63.6%, respectively, from the anterior end with 100% representing the AP length of each plateau and 50% representing the mid-line) and had a relatively small variation in both plateaus (one standard deviation 5.2% and 7.5%, respectively) as shown in Figure 6.
Fig 6.
(a) Locations of the thickest cartilage in the medial and lateral tibial plateaus, (b) box plots for the thickest cartilage locations
4. Discussion
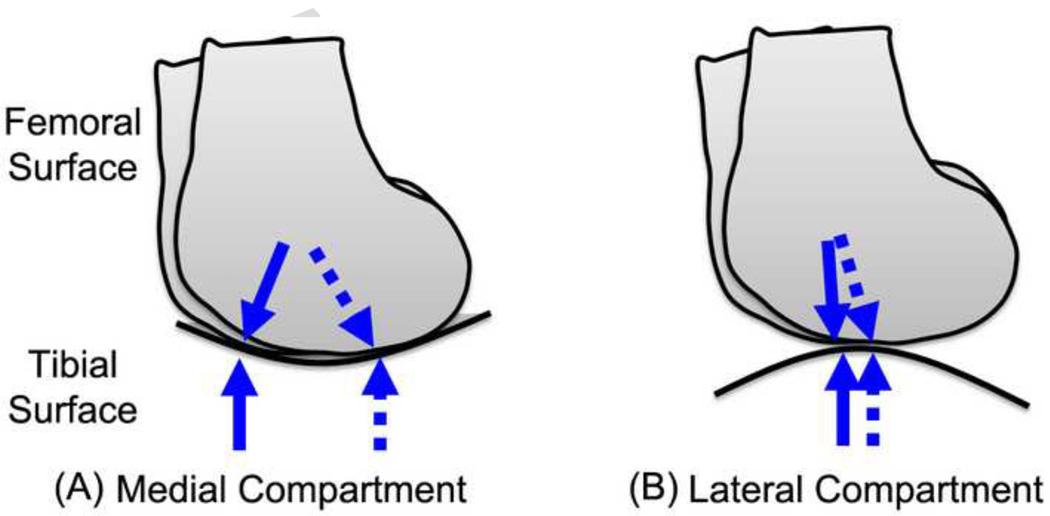
The results suggest that the cartilage thickness distribution of the distal femoral cartilage was influenced by the knee flexion angle during walking only in the medial compartment. The medial and lateral compartments in the knee have different contact situations according to the shape of the contacting surfaces (Koo and Andriacchi, 2007). The tibiofemoral contact surfaces in the medial compartment are more conforming (convex-concave), so the contact location is sensitive to small differences in knee joint kinematics as described in Figure 7(a). Thus the relatively large variation of the contact locations in the medial condyle could influence the variation of the centroids of thick cartilage.
Fig 7.
Movement of tibiofemoral contact points during walking; (a) the medial compartment has larger movement of the contact points than (b) the lateral compartment due to the contacting surface shapes and knee kinematics during walking. Arrows represent the range of contact movement during walking, conceptually.
Conversely, the contact regions in the lateral compartment may not vary as much as in the medial compartment because of the shape of the contact surfaces and the knee joint kinematics. The lateral compartment femoral and tibial surfaces are both convex in shape (Koo and Andriacchi, 2007) so the contact locations are less sensitive to knee joint kinematics than in the medial compartment as described in Figure 7(b). Also the center of rotation of the knee in the transverse plane is predominantly in the lateral compartment of the knee during walking (Koo and Andriacchi, 2008) and produces less contact movement on the lateral side during walking and greater movement in the medial compartment during walking. These kinematical conditions during waking are consistent with the relatively small variation of the centroids of thick femoral cartilage in the lateral compartment as compared to the medial side.
The variation of centroids of thick cartilage region in the tibial cartilage was relatively small for both medial and lateral plateaus (Koo et al., 2005). In our previous study, the average contact location during walking on the tibial cartilage was associated with regional cartilage thickness in anterior cruciate ligament injured subjects (Andriacchi et al., 2009). The cartilage thickness on the tibial plateaus does not change sharply so it is possible that the location of thickest cartilage on the tibia may not represent the functional cartilage adaptation as well as the regional cartilage thickness variation in the femur.
The finding in this study that cartilage thickness adapts to the walking kinematics is consistent with other studies that report that physical activity was positively associated with cartilage volume in a cross-sectional study (Jones et al., 2000) and a longitudinal study (Jones et al., 2003) for healthy children, implying that loading and number of cycles influences cartilage thickness. Similarly Hudelmaier et al. (Hudelmaier et al., 2003) showed that muscle cross-sectional areas were positively associated with knee articular cartilage volumes in healthy subjects. The fact that Eckstein et al. (Eckstein et al., 1998) reported that height, weight and BMI were not significantly correlated with cartilage volume could be related to the fact that activity level was not considered.
Li et al. showed that generally the thick cartilage regions on the femur matched those on the tibia for the tibiofemoral positions taken from the supine position MRI, concluding that “the cartilage was thicker in regions where cartilage-to-cartilage contact was present” (Li et al., 2005). While the study found the associations of thick cartilage locations between the femoral and tibial cartilage, they could not explain the variation of the location depending on the individual knee function.
Taken together, these observations suggest that regional cartilage thickness variations are influenced by both loading and the number of loading cycles. Thus, the mechanics of walking is an important consideration in the analysis of the morphological variations of articular cartilage since it is the dominant cyclic activity of daily living. This observation is also consistent with a previous study that reported that the medial and lateral cartilage thickness variations in the knee are influenced by the peak knee adduction moment during normal walking for healthy and osteoarthritic subjects (Andriacchi et al., 2004a, Andriacchi et al., 2009). It was also reported that the secondary motions, AP translation and IE rotation, in the knee during walking influenced the regional thinning patterns in the subjects with anterior cruciate ligament injuries (Andriacchi et al., 2009).
While the study focused on a healthy population and tested 17 subjects, the statistical result should be accepted carefully. The correlation coefficient for the medial femoral cartilage (R2=0.41) is in the range that can be well accepted in human research, especially with the data from two different modalities – gait and imaging, but this still requires a larger population test to confirm the conclusion statistically.
Results from the current study help explain the mechanism leading to a higher incidence of medial rather than lateral compartment osteoarthritis in the knee in two high risk groups – ACL injured and obese groups. Findings from this study suggest that abnormal knee kinematics at heel strike during walking for ACL injured subjects (Daniel et al., 1994), and knee hyperextension at heel strike during walking for obese subjects (DeVita and Hortobágyi, 2003, Spyropoulos et al., 1991) may influence the tibiofemoral contact regions more in the medial than lateral compartment. The study may contribute to understand the kinematic pathways of knee osteoarthritis suggested in our previous studies (Andriacchi et al., 2004a, Chaudhari et al., 2008, Koo et al., 2007).
Understanding the factors that influence cartilage morphology is important not only to help maintain thicker cartilage, but also to understand the etiology and pathomechanics of osteoarthritis. Biomechanical factors such as kinetic and kinematic conditions during walking should be carefully considered for the treatment of cartilage disease in weight bearing joints.
Acknowledgements
This study was funded by NIH R01 AR049792-05 and Basic Science Research Program through the National Research Foundation of Korea (NRF) funded by the Ministry of Education, Science and Technology (2010-0001645).
Footnotes
Publisher's Disclaimer: This is a PDF file of an unedited manuscript that has been accepted for publication. As a service to our customers we are providing this early version of the manuscript. The manuscript will undergo copyediting, typesetting, and review of the resulting proof before it is published in its final citable form. Please note that during the production process errors may be discovered which could affect the content, and all legal disclaimers that apply to the journal pertain.
Conflict of Interest Statement
None
References
- Andriacchi TP, Alexander EJ, Toney MK, Dyrby C, Sum J. A point cluster method for in vivo motion analysis: applied to a study of knee kinematics. Journal of Biomechanical Engineering. 1998;120:743–749. doi: 10.1115/1.2834888. [DOI] [PubMed] [Google Scholar]
- Andriacchi TP, Mundermann A, Smith RL, Alexander EJ, Dyrby CO, Koo S. A framework for the in vivo pathomechanics of osteoarthritis at the knee. Annals of Biomedical Engineering. 2004a;32:447–457. doi: 10.1023/b:abme.0000017541.82498.37. [DOI] [PubMed] [Google Scholar]
- Andriacchi TP, Johnson TS, Hurwitz DE, Natarajan R. Mow VC, Huiskes R. Basic Orthopaedic Biomechanics and Mechanobiology. Lippincott Williams & Wilkins, USA; 2004b. Musculoskeletal dynamics locomotion, and clinical applications; pp. 91–121. [Google Scholar]
- Andriacchi TP, Koo S, Scanlan SF. Gait mechanics influences healthy cartilage morphology and knee osteoarthritis. Journal of Bone and Joint Surgery, Am. 2009;91 Suppl 1:95–101. doi: 10.2106/JBJS.H.01408. [DOI] [PMC free article] [PubMed] [Google Scholar]
- Chaudhari A, Briant P, Bevill S, Koo S, Andriacchi TP. Knee kinematics, cartilage morphology and osteoarthritis following ACL injury. Medicine & Science in Sports & Exercise. 2008;40:215–222. doi: 10.1249/mss.0b013e31815cbb0e. [DOI] [PubMed] [Google Scholar]
- Chaudhuri B. Optimal circular fit to objects in 2 and 3 dimensions. Pattern Recognition Letters. 1990;11:571–574. [Google Scholar]
- Daniel DM, Stone ML, Dobson BE, Fithian DC, Rossman DJ, Kaufman KR. Fate of the ACL-injured patient: a prospective outcome study. American Journal of Sports Medicine. 1994;22:632–644. doi: 10.1177/036354659402200511. [DOI] [PubMed] [Google Scholar]
- DeVita P, Hortoágyi T. Obesity is not associated with increased knee joint torque and power during level walking. Journal of Biomechanics. 2004;37:1631–1632. doi: 10.1016/s0021-9290(03)00119-2. [DOI] [PubMed] [Google Scholar]
- Disler DG, McCauley TR, Wirth CR, Fuchs MD. Detection of knee hyaline cartilage defects using fat-suppressed three-dimensional spoiled gradient-echo MR imaging: comparison with standard MR imaging and correlation with arthroscopy. American Journal of Roentgenology. 1995;165:377–382. doi: 10.2214/ajr.165.2.7618561. [DOI] [PubMed] [Google Scholar]
- Disler DG. Fat-suppressed three-dimensional spoiled gradient-recalled MR imaging: assessment of articular and physeal hyaline cartilage. American Journal of Roentgenology. 1997;169:1117–1123. doi: 10.2214/ajr.169.4.9308475. [DOI] [PubMed] [Google Scholar]
- Eckstein F, Winzheimer M, Westhoff J, Schnier M, Haubner M, Englmeier K, Reiser M, Putz R. Quantitative relationships of normal cartilage volumes of the human knee joint - assessment by magnetic resonance imaging. Anatomy and Embryology. 1998;197:383–390. doi: 10.1007/s004290050149. [DOI] [PubMed] [Google Scholar]
- Hudelmaier M, Glaser C, Englmeier KH, Reiser M, Putz R, Eckstein F. Correlation of knee-joint cartilage morphology with muscle cross-sectional areas vs. anthropometric variables. Anatomical Record Part A-Discoveries in Molecular Cellular and Evolutionary Biology. 2003;270A:175–184. doi: 10.1002/ar.a.10001. [DOI] [PubMed] [Google Scholar]
- Hurwitz DE, Sumner DR, Andriacchi TP, Sugar DA. Dynamic knee loads during gait predict proximal tibial bone distribution. Journal of Biomechanics. 1998;31:423–430. doi: 10.1016/s0021-9290(98)00028-1. [DOI] [PubMed] [Google Scholar]
- Jones G, Glisson M, Hynes K, Cicuttini F. Sex and site differences in cartilage development: a possible explanation for variations in knee osteoarthritis in later life. Arthritis and Rheumatism. 2000;43:2543–2549. doi: 10.1002/1529-0131(200011)43:11<2543::AID-ANR23>3.0.CO;2-K. [DOI] [PubMed] [Google Scholar]
- Jones G, Ding C, Glisson M, Hynes K, Ma D, Cicuttini F. Knee articular cartilage development in children: a longitudinal study of the effect of sex, growth, body composition, and physical activity. Pediatric Research. 2003;54:230–236. doi: 10.1203/01.PDR.0000072781.93856.E6. [DOI] [PubMed] [Google Scholar]
- Kadaba MP, Ramakrishnan HK, Wootten ME, Gainey J, Gorton G, Cochran GV. Repeatability of kinematic, kinetic, and electromyographic data in normal adult gait. Journal of Orthopaedic Research. 1989;7:849–860. doi: 10.1002/jor.1100070611. [DOI] [PubMed] [Google Scholar]
- Koo S, Gold GE, Andriacchi TP. Considerations in measuring cartilage thickness using MRI: Factors influencing reproducibility and accuracy. Osteoarthritis and Cartilage. 2005;13:782–789. doi: 10.1016/j.joca.2005.04.013. [DOI] [PubMed] [Google Scholar]
- Koo S, Andriacchi TP. A comparison of the influence of global functional loads vs. local contact anatomy on articular cartilage thickness at the knee. Journal of Biomechanics. 2007;40:2961–2966. doi: 10.1016/j.jbiomech.2007.02.005. [DOI] [PMC free article] [PubMed] [Google Scholar]
- Koo S, Andriacchi TP. The knee joint center of rotation is predominantly on the lateral side during normal walking. Journal of Biomechanics. 2008;41:1269–1273. doi: 10.1016/j.jbiomech.2008.01.013. [DOI] [PMC free article] [PubMed] [Google Scholar]
- Koo S, Giori NJ, Gold GE, Dyrby CO, Andriacchi TP. Accuracy of 3D cartilage models generated from MR images is dependent on cartilage thickness: Laser scanner based validation of in vivo cartilage. Journal of Biomechanical Engineering. 2009;131:121004. doi: 10.1115/1.4000087. [DOI] [PMC free article] [PubMed] [Google Scholar]
- Li G, Park SE, DeFrate LE, Schutzer ME, Ji L, Gill TJ, Rubash HE. The cartilage thickness distribution in the tibiofemoral joint and its correlation with cartilage-to-cartilage contact. Clinical Biomechanics. 2005;20:736–744. doi: 10.1016/j.clinbiomech.2005.04.001. [DOI] [PubMed] [Google Scholar]
- Lohmander LS, Ostenberg A, Englund M, Roos H. High prevalence of knee osteoarthritis, pain, and functional limitations in female soccer players twelve years after anterior cruciate ligament injury. Arthritis and Rheumatism. 2004;50:3145–3152. doi: 10.1002/art.20589. [DOI] [PubMed] [Google Scholar]
- Miyazaki T, Wada M, Kawahara H, Sato M, Baba H, Shimada S. Dynamic load at baseline can predict radiographic disease progression in medial compartment knee osteoarthritis. Annals of Rheumatic Diseases. 2002;61:617–622. doi: 10.1136/ard.61.7.617. [DOI] [PMC free article] [PubMed] [Google Scholar]
- Schipplein OD, Andriacchi TP. Interaction between active and passive knee stabilizers during level walking. Journal of Orthopaedic Research. 1991;9:113–119. doi: 10.1002/jor.1100090114. [DOI] [PubMed] [Google Scholar]
- Spyropoulos P, Pisciotta JC, Pavlou KN, Cairns MA, Simon SR. Biomechanical gait analysis in obese men. Archives of Physical Medicine and Rehabilitation. 1991;72:1065–1070. [PubMed] [Google Scholar]


