

Abstract
Purpose
Anaplastic thyroid carcinoma (ATC) is one of the most lethal human cancers with a median survival of 6 months. The inhibition of epidermal growth factor receptor (EGFR) alone, or with vascular endothelial growth factor receptor2 (VEGFR2), represents an attractive approach for treatment of ATC. Several reports have examined agents that target these receptors. However, with the misidentification of as many as 60% of all commonly used ATC cell lines, the significance of these past findings is unclear.
Experimental Design
Cell lines authenticated by short tandem repeat profiling were selected to establish xenograft tumors in an orthotopic murine model of ATC. These mice were then treated with vandetanib to evaluate its effects on ATC tumor growth. Dynamic contrast-enhanced magnetic resonance imaging (DCE-MRI) was utilized to measure the impact of vandetanib on tumor vasculature.
Results
Vandetanib inhibited tumor growth of the ATC cell lines Hth83 and 8505C in vivo by 69.3% (p<0.001) and 66.6% (p<0.05), respectively, when compared to control. Significant decreases in vascular permeability (p<0.01) and vascular volume fraction (p<0.05) were detected by DCE-MRI in the orthotopic xenograft tumors after one week of treatment with vandetanib as compared to control.
Conclusion
The inhibition of EGFR and VEGFR2 by vandetanib and its tremendous in vivo anti-tumor activity against ATC make it an attractive candidate for further pre-clinical as well as clinical development for the treatment of this particularly virulent cancer which remains effectively untreatable. Vandetanib disrupts angiogenesis and DCE-MRI is an effective method to quantify changes in vascular function in vivo.
Introduction
There are approximately 38,000 new cases of thyroid carcinoma in the United States each year (1). Anaplastic thyroid cancer accounts for 2% of all thyroid cancers. Although thyroid cancer is an uncommon cause of mortality the subset of patients with anaplastic thyroid carcinoma (ATC) has a grave prognosis with a mortality rate of almost 100%, and a median survival of 4-6 months (1, 2). ATC patients present with aggressive, uncontrolled local neck disease accompanied by lymph node and/or lung metastases (3, 4). Conventional ATC therapy employs a multimodal approach with the use of radiation therapy and conventional chemotherapeutic agents such as doxorubicin. The local disease burden often is so great that the surgical role is confined to tumor debulking and securing the airway (1, 2). Although hyperfractionated accelerated high-dose radiation therapy has improved local-regional control, the median ATC survival rate remains unchanged due to uncontrolled systemic metastasis (5-7). This suggests that lack of good systemic control and effective chemotherapy regimens are the weak links in the multimodal therapy approach.
Development of targeted molecular agents represents an exciting strategy for ATC treatment. Individual types of cancer express various molecules that drive cancer cell growth and survival. These molecules provide novel targets for therapy. Epidermal growth factor receptor (EGFR), a transmembrane cell surface glycoprotein with intrinsic tyrosine kinase activity, is overexpressed in a majority of ATC. Activation of EGFR by its ligands, epidermal growth factor (EGF) or transforming growth factor alpha (TGF-α), activates a cascade of secondary messenger molecules responsible for cell proliferation, increased cell survival and angiogenesis. Pathways that are known to be activated by EGFR include the RAS-RAF-MEK-ERK pathway as well as the AKT-PI3K pathway (8). Targeting EGFR with small molecule inhibitors to its kinase domain or antibodies to its extracellular domain in other cancers that overexpress EGFR, such as colon cancer (9), has proven to be an effective treatment strategy.
Statement of Translational Relevance.
Anaplastic thyroid carcinoma (ATC) is one of the most lethal human cancers. A lack of effective therapy emphasizes the distinct need for novel therapeutic modalities. EGFR and VEGFR2 are potentially attractive targets in the treatment of ATC. This preclinical study targeted EGFR and VEFGR2 by using the tyrosine kinase inhibitor, vandetanib, which resulted in significant tumor growth inhibition in vivo. We employed an orthotopic model of ATC that closely models the behavior of ATC in humans. Our xenografts were imaged by using bioluminescence measurements as a surrogate for tumor growth and dynamic contrast-enhanced magnetic resonance imaging (DCE-MRI) to assess changes in tumor microvasculature. This model serves as a preclinical platform where the effectiveness of targeted therapies can be assessed employing quantifiable imaging-based biomarkers. Our results demonstrate that antiangiogenic agents, such as vandetanib, may have a role in the treatment of ATC and should be developed further for clinical use.
Vascular endothelial growth factor receptor-2 (VEGFR-2) is a tyrosine kinase receptor that, when activated by its ligand vascular endothelial growth factor (VEGF), is responsible for migration and proliferation of endothelial vessels, and the promotion of angiogenesis and vascular growth (10, 11). In the context of cancer progression, tumor angiogenesis is critically important for continued tumor growth and metastasis. The role of VEGF in well- differentiated thyroid cancer is well established, with tumor microvessel density (MVD) and increased VEGF expression linked with shortened disease free-survival and poorer prognosis (12,13). Furthermore, VEGF expression in thyroid cells has been linked with tumorigenic potential by Viglietto et al., specifically linking VEGFR overexpression to ATC (14).
Based upon these findings, we attempted to determine whether, vandetanib (ZD6474), a small molecule tyrosine kinase inhibitor (TKI) of EGFR, VEGFR2 and REarranged during Transfection (RET), would have anti-tumor efficacy in an orthotopic nude mouse model of ATC. Several preclinical studies have examined agents that target EGFR and VEGFR2 in ATC with varying degrees of success (15-17). However, Schweppe et al. (18) recently found that as many as 60% of all of thyroid cell lines in common use today are either mislabeled or duplicates. These worthwhile targets merited validation in cell lines that have been clearly identified as ATC.
In this study we used a panel of seven ATC cell lines with short tandem repeat (STR) profiles known to be unique ATC cell lines. We hypothesized that by inhibiting EGFR and VEGFR2 with the use of vandetanib we would be able to significantly decrease ATC tumor growth in an orthotopic murine model. Specifically, we investigated the expression of VEGFR2 and EGFR in a panel of these validated ATC cell lines and the ability of vandetanib to inhibit phosphorylation of its target receptors. We also assessed the inhibition of proliferation of ATC cell lines in vitro. Additionally, we used immunohistochemistry to assess the effect of vandetanib on angiogenesis and apoptosis in vivo. To further delineate alterations in ATC-tumor vasculature caused by vandetanib, the orthotopic xenograft tumors were assessed with dynamic contrast-enhanced magnetic resonance imaging (DCE-MRI).
Materials and Methods
Reagents
Vandetanib (Astra Zeneca Pharmaceuticals; Macclesfield, United Kingdom) was diluted in dimethyl sulfoxide (DMSO) (Sigma-Aldrich Corp., St. Louis, MO) for in vitro administration. For in vivo administration vandetanib was dissolved in 1% Tween80 (diluted in ddH20).
Cell lines and culture conditions
ATC cell lines C643, Hth-74 clone7, Hth7, Hth104, Hth83, SW1736 were obtained from Dr. Nils-Erik Heldin (University of Uppsala, Sweden). 8505C was obtained from the laboratory of Dr. Gary L. Clayman M.D, who had purchased this cell line from the European Collection of Cell Cultures (ECACC).
Hth83 and Hth104 were grown in RPMI 1640 medium supplemented with 10% fetal bovine serum (FBS), penicillin and streptomycin, sodium pyruvate, L-glutamine and non-essential amino acids. Hth74 clone7, SW1736, C643, 8505C and Hth7 were grown in Eagle's Minimum Essential Medium supplemented with 10% FBS , L-glutamine, non-essential amino acids, penicillin and streptomycin. Adherent monolayer cultures were maintained on plastic and incubated at 37°C in 5% CO2 and 95% air. The cultures were free of Mycoplasma species and were maintained for no more than 10 passages after recovery from frozen stocks.
Hth83 was retrovirally infected with green fluorescent protein (GFP) and the firefly luciferase gene. For construction of the retroviral luciferase vector (Luc), a polymerase chain reaction product of luciferase cDNA was amplified from PGL3 vector (Promega, Madison, WI) and cloned into pBMN-I-GFP (Dr. Garry P. Nolan, Stanford University) to generate pBMN-I-Luc-GFP. The pBMN-I-Luc-GFP vector was transfected into Phoenix cells to generate a Luc-expressing retrovirus that was subsequently used to infect Hth83 cells. Luc-transduced stable Hth83 cells were obtained by sorting GFP-positive cells for green fluorescence by FACScan (Becton Dickinson, Franklin Lakes, NJ).
The luciferase cDNA expression vector used in the transfection of 8505C was constructed by obtaining Luciferase cDNA from pGL3 vector by digesting with SMA I and XBA I restriction enzymes and ligating to ECOR V and NHE1 sites of pIRESneo3 vector (Clontech, Mountain View, CA). After confirming DNA sequence, a stable cell line was made by transfecting the luciferase-pIRESNneo3 plasmid into 8505C cells using lipofectamine 2000 (Invitrogen, Carlsbad, CA) and selected using 600μg/mL of G418 for 3 weeks.
Cell line authentication
DNA was harvested from the cell lines using a commercially available DNA purification kit (Qiagen, Valencia, CA). Harvested DNA was sent to the Genetic Resources Core Facility (Johns Hopkins University, Baltimore, MD) for short tandem repeat (STR) profiling. Each cell line was maintained for no longer than 10 passages after genotyping.
Immunoblot analysis
Subconfluent cultures were grown for 24 hours in serum-free conditions and then treated with vandetanib for 2 hrs. EGF (50ng/mL) was added for 15 minutes. Cells were washed twice with ice-cold PBS and harvested in RIPA lysis buffer [50mmol/L Tris-HCl (pH 7.4), 150mM NaCl, 0.25% deoxycholic acid, 1% NP-40, 1mM EDTA, 1mM PMSF ,1M NaV03, 1X PI and 0.1% sodium dodecyl sulfate (SDS)]. Lysates were sonicated, placed on ice for 20 minutes, and centrifuged. Samples were diluted in sample buffer (10% SDS, 0.5 mM Tris/HCL, (pH 6.8), 0.1 mM dithiothreitol (DTT), 10% (v/v) glycerol, 1% bromphenol blue) and boiled. Equal amounts of protein were resolved using 10% SDS- polyacrylamide gel and transferred to polyvinylidene difluoride (PVDF) membranes. Primary antibodies included: rabbit polyclonal anti-phosphoVEGFR2 (Tyr1054/Tyr1059, Novus Biologicals, Littleton CO), rabbit polyclonal anti-phospho-EGFR (Tyr1068, Cell Signaling Technology, Beverly, MA), anti-phospho-Akt (Ser473, Cell Signaling Technology), or anti-phospho-mitogen activated protein kinase (MAPK; Thr202/Tyr204, Cell Signaling Technology) in 5% bovine serum albumin (BSA) (w/v) in 0.1% (v/v) Tween20 in 1XTBS. Antibodies were visualized using either the Odyssey infrared imaging system (LI-COR Biosciences) or ECL reagent (SuperSignal West chemiluminescent system (Pierce Biotechnology). Membranes were stripped and re-probed for β-actin to verify equal protein loading.
Measurement of cell proliferation
ATC cells lines were plated in 96-well plates at 3000 cells/well in 100μL of 10% FBS media. After 24 hours of incubation, the cells were treated with vandetanib (0.59-150μM) or DMSO alone for 72 hours. MTT assay was performed and absorbance was measured at 570nm with an EL-808 96 well plate reader (Bio Tek Instruments, Winookski, VT). A separate replicate of untreated cells, representing the number of viable cells at time zero (G0) was set aside and read at 24 hours.
Animals and maintenance
Male athymic nude mice, age 8-12 weeks, were purchased from the animal production area of the National Cancer Institute-Frederick Cancer Research and Development Center (Frederick, MD). The mice were fed irradiated mouse chow and housed in laminar flow cabinets under specific pathogen-free conditions. Facilities were approved by the American Association for Accreditation of Laboratory Animal Care in accordance with current regulations and standards of the US Department of Agriculture, the US Department of Health and Human Services, and the National Institute of Health. Procedures and handling were in accordance with the Animal Care and Use Guidelines of the University of Texas M.D. Anderson Cancer Center (Houston, TX) under a protocol approved by the Institutional Animal Care Use Committee.
Establishment of an orthotopic nude mouse model of ATC and treatment
8505C-lucif and Hth83-lucif were injected (5×10⁵ cells/ mouse or 2.5×10⁵ cell/mouse respectively) orthotopically into the right thyroid gland of male athymic nude mice as previously described (19). The tumors were allowed to establish for 5-7 days and the mice were imaged using the IVIS 200 imaging system (Xenogen Corp., Alameda, CA) to assess tumor size. Mice were randomized into two groups with equivalent mean bioluminescence values.
Mice with 8505C-lucif tumors were treated with 50mg/kg vandetanib daily by oral gavage for 4 weeks while the mice with Hth83-lucif tumors were treated with 25mg/kg daily for 3 weeks. Control mice were treated with 150μL 1% Tween80 in PBS. Mice were euthanized if they lost >20% of their body weight or became moribund. At the end of treatment the mice were asphyxiated with carbon dioxide (CO2), and necropsy performed. At the time of necropsy the tumors were measured in three dimensions and the volume was defined as V = XYZ(π/6) where X, Y, and Z represent the radius of the tumor in each dimension.
Bioluminescence imaging of orthotopic thyroid tumors
The mice were anesthetized using 2% isofluorane (Abbott, Abbott Park, IL). An aqueous solution of d-Luciferin (1mg/ml; Xenogen Corp.) was injected at 150mg/kg 5 minutes before imaging. The mice were imaged using the IVIS 200 imaging system (Xenogen Corp.) Photons emitted from the luciferase-expressing cells within each tumor were measured in standardized regions of interest and quantified using the software program Living Images (Xenogen Corp) as an overlay on IGOR software (Wavemetrics, Portland, Oregon). A standardized rectangular region encompassing the head and neck of the mouse in a dorsal position was used to measure the bioluminescence. The animals were imaged on day 0 and on a weekly basis.
DCE-MRI Imaging
Twenty mice were injected orthotopically with 1×10⁵ Hth83-lucif into the right thyroid gland. Tumors were grown to ensure adequate lesion size for imaging. Luciferase activity was and mice were randomized into two groups: vandetanib (25mg/kg daily) and vehicle only. Animals were scanned weekly using the IVIS 200 Imaging system. Mice were imaged using DCE-MRI to establish baseline measurements of microvascular function (day -1). Treatment started the following day (day 0). The mice were then imaged using DCE-MRI 1 day after therapy (day +1) and then again on day +7 and day +14. All data was acquired on a four-channel Biospec 4.7T small animal MR scanner (Bruker Biospin MRI, Billerica, MA) with 26cm imaging gradients. Mice were anesthetized using 0.5-2.0% isofluorane in oxygen, and a heparinized catheter was inserted into the tail vein. Four animals at a time were placed into an exchangeable multi-animal positioning sled that integrates into an array of 35mm linear volume resonators (20). A two-plane T2-weighted imaging sequence (TE = 57.7ms, TR = 2000ms, FOV = 20cm × 10cm over a 256 × 256 matrix) was used to confirm positioning of animals, and T2-weighted coronal images (TE = 80ms, TR = 4000ms, FOV = 6cm × 3cm over a 256 × 192 matrix) were used to locate the tumor within each animal. An axial saturation-recovery sequence (TE = 80ms, TR = 350-4000ms, FOV = 3cm × 3cm over a 128 × 128 matrix) was used to measure the intrinsic T1 of tumor tissue prior to administration of contrast. Dual-tracer dynamic measurements were made using multiple repetitions of a T1-weighted fast, spoiled gradient echo sequence (TE = 2.77ms, TR = 1000ms, FOV = 3cm × 3cm over a 96 × 96 matrix, 50° excitation angle) (21). After one minute of baseline scans, 0.2mM(Gd)/kg PG-Gd-DTPA, a blood-pool contrast agent (22), was injected via the tail-vein catheter. Five minutes later, 0.2mM/kg of Gd-DTPA (Magnevist) was injected.
Immunohistochemical analysis of CD31
Four representative frozen tumor sections (8-10 mm) from each group were mounted on positively charged Superfrost slides (Fischer Scientific, Houston, TX) and fixed in cold acetone.. The slides were washed in PBS, incubated in endogenous peroxidase (3% H2O2 ) and protein blocking solution (5% normal horse serum, 1% normal goat serum in PBS) . The samples were then incubated with rat anti-mouse CD31 antibody (BD Biosciences Pharmingen, San Jose, CA), washed in PBS, blocked with protein block, followed by secondary antibody (goat anti-rat HRP; Jackson Immunoresearch Laboratories, West Grove, PA). After washing the samples with PBS and Brij pH 7.6, the samples were incubated in Chromogen DAB (Research Genetics, Huntsville, AL), washed in ddH2O, counter stained with Gills#3 Hematoxylin and mounted using Universal mount.
Immunofluorescence double staining for CD31/Terminal Deoxynucleotidyl Transferase-Mediated dUTP Nick End Labeling (TUNEL)
Four representative frozen tumor sections were fixed and blocked as above, excluding the endogenous peroxidase step. The slides were incubated with rat anti- mouse CD31 monoclonal antibody (BD Biosciences Pharmingen), washed with PBS, blocked with protein block and incubated with goat anti-rat Alexa 594 antibody (Invitrogen). To stain for TUNEL a commercially available Apoptosis Detection kit (Promega, Madison, WI) was used. Slides were washed with PBS and counterstained with 1:10,000 Hoechst stain (Invitrogen) and mounted using Vectashield mounting medium (Vector laboratories Inc., Burlingame, CA)
Immunofluorescence microscopy was carried out using a Leica DMLA microscope (Leica Microsystems, Bannockburn, IL). The microscope was equipped with a 100-W HBO mercury bulb and filter set (Chroma Inc, Brattleboro, TV) that captures red and blue fluorescent images individually. Images were captured using a cooled charge-coupled device Hamamatsu 5810 camera (Hamamatsu Corp, Bridgewater, NJ) and Image Pro Plus 6.0 software (Media Cybernetics, Bethesda, ML). Color images were captured using the same microscope equipped with a three-chip charge-coupled device color camera (model DXC990; Sony Corp, Tokyo, Japan).
Quantification of microvessel density and apoptotic endothelial cells
Four slides from each group were selected and quantification of apoptotic endothelial cells was expressed as the average of ratio apoptotic endothelial cells to the total number of endothelial cells in four 0.04 mm2 field at a 200X magnification per slide. To quantify microvessel density (MVD), vessels completely stained with anti-CD31 antibodies and were counted at 10 random 0.04 mm2 fields at original magnification of 200X per slide.
Statistical analysis
To calculate the concentration of vandetanib that caused 50% inhibition of proliferation (GI50) we subtracted the optical density measured (OD) at 72 hours from the OD measured at G0. Graphpad Prism 5 (Graph Pad Software, LaJolla, CA) software was used to plot the GI50 using nonlinear curve fit, variable slope, constraining the bottom to 0 using log concentrations of vandetanib. Differences in tumor volumes and immunohistochemical expression of TUNEL and CD31 from the vandetanib and control group were compared using an unpaired Students t-test analysis with Welch's correction. Differences in imaging-based parameters were assessed with the Wilcoxon rank-sum test. P-values of <0.05 were considered statistically significant. GraphPad Prism 5 and MatLab (The MathWorks, Natick, MA) software were used for statistical analysis.
Results
EGF stimulated the phosphorylation of EGFR, VEGFR2 and downstream signaling pathways in a panel of ATC cell lines
After utilizing STR profiling to confirm that our cell lines were of ATC origin (Supplementary Table 1), we evaluated these cell lines for the expression and EGF-induced phosphorylation of EGFR and VEGFR2. Specifically a panel of six ATC cell lines was examined by western blot analysis, and all were found to express both the VEGFR2 and EGFR receptors (Fig. 1A). EGFR and VEGFR2 were minimally phosphorylated after serum starvation for 24 hours. However, in response to 15 minutes of EGF stimulation (50ng/mL) both EGFR and VEGFR2 became phosphorylated as did the downstream signaling kinases AKT and MAPK.
Figure 1. EGF stimulated the phosphorylation of EGFR and VEGFR2 as well as downstream signaling in a panel of ATC cell lines.
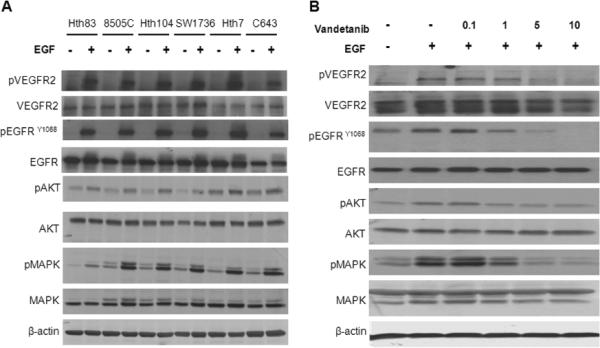
(A) A panel of six ATC cell lines were serum starved for 24 hours and then stimulated with EGF for 15 minutes (50ng/mL). Vandetanib inhibited EGF stimulated phosphorylation of EGFR, VEGFR2, AKT and MAPK in ATC cell line 8505C in a dose dependent manner (B) Cell line 8505C was serum starved for 24 hours, treated with various doses of vandetanib for 2 hours and then stimulated with EGF (50ng/mL) for 15 minutes. (Vandetanib μM)
Vandetanib inhibited phosphorylation of EGFR and VEGFR2 in a dose-dependent manner in vitro
To examine the ability of vandetanib to inhibit phosphorylation of EGFR and VEGFR2, we serum starved the ATC cell line 8505C, then treated it with increasing doses of vandetanib, followed by 15 minutes of EGF stimulation (50ng/mL). We found that vandetanib inhibited EGF stimulated phosphorylation of EGFR and VEGFR2, as well as AKT and MAPK, in a dose-dependent manner (Fig. 1B).
Vandetanib inhibited proliferation of ATC cell lines in vitro
A panel of seven ATC cell lines were incubated in increasing concentrations of vandetanib (0.59-150μM) in media supplemented with 10% FBS. Proliferation was measured using an MTT assay. After 72 hours the proliferation of ATC cell lines was inhibited in a dose-dependent manner with mean GI50 values ranging from 3.30 to 16.98μM (Table 1, Supplementary Fig. 1). However, when we performed a propidium iodide (PI) assay with flow cytometry and cell cycle analysis in cell lines Hth83 and 8505C treated with various doses of vandetanib (3-9μM), we did not see significant apoptosis in vitro (results not shown).
Table 1.
Vandetanib inhibits proliferation of ATC cell lines in vitro
| Cell line | GI50 (μM) Mean ± SD |
|---|---|
| Hth83 | 3.30 ± 0.66 |
| C643 | 3.65 ± 1.22 |
| 8505C | 7.56 ± 1.13 |
| Hth74 | 8.56 ± 1.01 |
| SW1736 | 9.05 ± 0.55 |
| Hth7 | 9.66 ± 0.38 |
| Hth104 | ±16.98 ± NA |
GI50 values are means of at least three independent experiments = standard error (SE).
Inhibition of EGFR and VEGFR2 significantly reduced orthotopic ATC xenograft growth
In order to establish the ability of vandetanib to inhibit growth of ATC in vivo, we generated orthotopic ATC xenografts using cell lines expressing the luciferase gene. This allowed us to measure bioluminescent activity as a surrogate for tumor growth. (Fig. 2). Orthotopic thyroid tumors are not palpable until they grossly compress vital structures. By measuring the bioluminescence activity within each mouse's tumor we were able to identify the presence of tumor at an earlier stage and more accurately randomize the mice into groups with similar size tumors. Once treatment started, we performed weekly bioluminescence quantification. This allowed us to follow tumor growth without having to rely on the less reliable external caliper method of measuring these highly infiltrative tumors that are deeply embedded in the thyroid gland and surrounding structures.
Figure 2. Vandetanib inhibited orthotopic ATC tumor xenograft growth in vivo.

(A) Luciferase activity in ATC xenografts measured as photons/second in a standardized field of interest. Points shown are means (n=7-12) with error bars indicating SE. (B) Representative images showing luciferase activity at the time of completion of the experiment ( 3 weeks for Hth83, 4 weeks for 8505C) Day 0 represents start of treatment. (C) Xenografts generated from ATC cell lines Hth83-luciferase and 8505C-luciferase and treated with vandetanib have significant reduction in tumor volume when compared to control. (Columns represent mean tumor volumes (n=7-12), error bars indicate SE). (D) Representative images of tumors at the time of necropsy.
The mice with xenografts generated from the cell line 8505C-lucif were treated with vandetanib for a total of 4 weeks at a dose of 50mg/kg daily. Based on the lower GI50 of the cell line Hth83 in vitro (3.30 vs. 7.56μM), we treated the Hth83-lucif xenograft bearing mice at a dose of 25mg/kg daily for 3 weeks. Bioluminescence was measured on a weekly basis. (Fig. 2A) At the end of the treatment period, all mice were sacrificed and tumor volume measured. Vandetanib significantly inhibited tumor growth of ATC cell lines Hth83-lucif and 8505C-lucif with mean tumor volume decreased by 69.32% (p<0.0001) and 66.56% (p<0.04) respectively when compared to control (Fig. 2C).
Microvessel density in ATC xenografts was significantly decreased by EGFR and VEGFR2 inhibition
In order evaluate whether the growth inhibitory effect of vandetanib was associated with targeting of tumor angiogenesis through VEGFR-2 inhibition, tumor sections were stained with the endothelial marker CD31 antibody and the number of tumor microvessels were counted in the tumors of vandetanib and control treated animals (Fig. 3). The vandetanib-treated tumors had a significantly reduced MVD of 5.07 +/- 0.76 MVD when compared to tumors from control mice 19.10 +/- 1.48 MVD (Table 3).
Figure 3. Vandetanib inhibited MVD and increased tumor cell and tumor endothelial cell apoptosis in ATC tumor grafts.

Tumors were harvested after 14 days of treatment. Representative frozen sections of Hth83-luciferase tumors were stained with H&E, CD31 (brown) and double-stained with CD31 (red) and TUNEL (green). (H&E and CD31 sections at 100X original magnification, TUNEL and CD31/TUNEL at 200X original magnification.)
EGFR and VEGFR2 inhibition induced apoptosis of ATC tumor and endothelial cells
In order to further clarify the mechanism of vandetanib in vivo we double stained tumor sections with CD31 and TUNEL (Fig. 3). This enabled us to quantify TUNEL staining as a measure of apoptosis alone and in relation to CD31/ endothelial cells. We found that vandetanib caused significant apoptosis of tumor cells when compared to control (14.13% vs. 0.53%; p-value <0.05) (Table 3). In tumors treated with vandetanib, blood vessels were clearly double-stained with TUNEL and CD31. We did not see this double staining in the control sections. While there appeared to be a clear trend of increased apoptotic endothelial cells in tumor sections treated with vandetanib, as compared to control sections, this difference did not reach statistical significance (p=0.07) (Table 2; Fig. 3).
Table 2.
Quantitative immunohistochemical analysis of Hth83-lucif xenografts grown orthotopically in nude mice
| Treatment group | |||
|---|---|---|---|
| Control | Vandetanib | p-value | |
| Apoptosis % | 0.53 ± 0.13 | 14.13 ± 5.60 | <0.05 |
| MVD | 19.10 ± 1.48 | 5.07 ± 0.76 | <0.001 |
| Endothelial cell Apoptosis % | 1.73 ± 0.52 | 37.27 ± 18.36 | 0.07 |
Mean values expressed ± SE. % Apoptosis was measured as apoptotic cells/total cells in a total of 16 0.04 mm2 fields at a original magnification of 200×. MVD was determined by counting the total number of complete blood vessels in 40 0.04 mm2 fields at an original magnification of 200×. % Endothelial cell apoptosis was determined as endothelial cells stained positive for CD31 and TUNEL / total endothelial cells (positive for CD31) in 16 0.04 mm2 fields at an original magnification of 200×. p- value was determined by an unpaired Students t-test with Welch's correction.
DCE-MRI demonstrated significant changes in vascular volume fraction and vascular permeability in orthotopic ATC xenograft tumors treated with vandetanib
To determine the effects of vandetanib on tumor vasculature in vivo, we subjected a cohort of Hth83-lucif-tumor-bearing mice that were treated with vandetanib (25 mg/kg/day) or vehicle to DCE-MRI. Serial imaging of the two groups of mice was performed at baseline (day -1) and following treatment on day 1, day 7 and day 14. The orthotopic xenograft tumors treated with vandetanib demonstrated decreased bioluminescence over the course of the experiment (Fig. 4A), which correlated with a significant decrease in tumor volume compared to the control group at sacrifice (60% decrease in tumor volume, p<0.05). Parametric maps from DCE-MRI studies demonstrated alterations in vascular permeability and vascular volume fraction (VVF) (Fig. 4B). Statistically significant decreases were noted for vascular permeability at all time points compared to baseline (p<0.05) in the vandetanib-treated group (Fig. 5C). VVF was decreased at all times as compared to baseline for the vandetanib-treated group: day 1 (p=0.0571), day 7 (p<0.05) and day 14 (p<0.05). At day 1 post-treatment, vascular permeability was not significantly altered and VVF was decreased in the vandetanib-treated group (p=0.0571) as compared to the control group. At day 7, vascular permeability (p<0.001) and VVF (p=0.0381) were significantly decreased in the vandetanib-treated group as compared to the control group. Thus, imaging-based quantifiable biomarkers demonstrated alteration in tumor vasculature characteristics early in the course of treatment with vandetanib.
Figure 4. DCE-MRI detected significant decreases in vascular permeability and vascular volume fraction in ATC tumor xenografts.

(A) Orthotopically grown xenografts generated from Hth83-luciferase treated with vandetanib and imaged with DCE-MRI, showed significant inhibition of bioluminescence activity and tumor growth 59.9% when compared to control (p-value<0.05). Day 0 represents start of treatment. Error bars indicate SE. (B) Representative parametric maps from DCE-MRI demonstrated visible alterations in vascular permeability and vascular volume fraction. (C) Statistically significant decreased in vascular permeability and vascular volume fraction (y axis relative values) when compared to baseline (treatment day -1) p-values<0.05 at 7 and 14 days of treatment. (n=4, error bars indicate SE)
Discussion
Anaplastic thyroid cancer is a devastating disease and has no effective treatment options. Targeted molecular therapy has improved morbidity and mortality in a number of cancers. EGFR is an attractive potential target for ATC as 58-87% of ATC tissues over-express EGFR when compared to normal thyroid tissue (23-25). VEGFR is crucial to the development of the microcirculation that facilitates growth of most malignancies, and allows continued tumor expansion (10, 11) Combined targeting of these two receptors yielded promising results in recent clinical studies (26). Targeting EGFR or VEGFR in combination with conventional chemotherapeutic therapies showed favorable outcomes in a number of cancers -colon and head and neck squamous cell carcinoma (9, 27, 28). The orally available TKI vandetanib, an inhibitor of VEGFR2, EGFR and RET, produced promising results in the treatment of metastatic hereditary medullary thyroid cancer in ongoing clinical trials (29).
We employed an orthotopic murine model of ATC to study tumor growth and the impact of therapy on ATC in its native environment, as well as the changes in vascular characteristics measured by DCE-MRI,. This model was initially developed by Kim et al. (19) and was recently validated using the cell line 8505C by Nucera et al. (30). The orthotopic model requires direct injection of ATC cells into the thyroid of mice. These tumors closely replicate the clinical behavior of ATC in humans including rapid growth, laryngeal/tracheal invasion and compression, and metastasis to lymph nodes and lungs (31). The orthotopic model of ATC is so analogous to clinical tumor behavior that it is challenging to detect the early stages of tumor growth. The time between initial detection of tumors by palpation and tumor-related morbidity is very short. External caliper measurements as surrogates for measurements of tumor growth are also notoriously inaccurate. Therefore, we chose to transduce our cell lines with the firefly luciferase gene, and use bioluminescence measurements as surrogates for tumor growth.
The use of bioluminescence is well established in models for metastasis and tumor growth in other in vivo tumor models such as mammary and colon cancer (32, 33). Monitoring tumors by bioluminescence measurements permitted early randomization of mice. Although a number of confounding factors, such as tumor necrosis and alterations in tumor vascularity caused by a targeted agent, may affect tumor bioluminescence over time, our bioluminescence measurements corresponded well with tumor volumes at the time of necropsy.
To our knowledge, this is the first report of a TKI that targets both VEGFR2 and EGFR, and their successful growth inhibition of ATC in an orthotopic murine model with cell lines validated by STR sequencing. The identification of EGFR and VEGFR as potential targets in the treatment ATC has been exploited in a number of in vitro and in vivo studies in the past 5-10 years (15-17). These studies have reported encouraging results, with significant inhibition of tumor growth and improved survival rates. Unfortunately, the majority of these studies used human ATC cell lines identified in a recent paper by Scweppe et al. as mislabeled or duplicate (18). In fact, more than half of all commonly used thyroid cancer cell lines have been discredited.
We validated each of our cell lines with STR sequencing. (STR profiles are available as Supplementary Data [Supplemental Table 1]). The profiles were then matched to published STR profiles of known ATC cell lines (18, 34) as well as to the ATCC database. We strictly adhered to the UKCCCR guidelines for cell culture (35). A repository of ATC tissue specimens and matched cell lines that are maintained over time is essential to promote advancement in this area. Because ATC cell lines very rarely express the thyroid cell line markers such as thyroglobulin, thyroid transcription factor-1 (TTF-1) or any of the cytokeratins, a matched tissue/cell line bank is crucial (36).
Our findings show that vandetanib effectively inhibits phosphorylation of its target proteins EGFR and VEGFR2 in ATC in vitro. There appears to be a strong, dose dependent anti-proliferative effect of vandetanib. However, the GI50 values are moderately high (>3.30 μM). This result is consistent with previously published data by Hoffman et al. (37), where the antiproliferative effects of vandetanib were evaluated in a panel of thyroid cell lines. These antiproliferative effects measured in vitro are a function of the sensitivity to EGFR inhibition by vandetanib. Therefore, while inhibition of EGFR may contribute in vivo, VEGFR2 inhibition by vandetanib may play a more significant role. The importance of VEGFR2 inhibition is further substantiated by significantly decreased MVD in tumor sections treated with vandetanib, as well as the trend toward increased endothelial cell apoptosis.
The importance of imaging and measuring tumor angiogenesis was highlighted in recent studies linking tumor perfusion with grade and prognosis in lymphoma and head and neck cancer (38-40). DCE-MRI has been employed to assess the effects of vandetanib in a number of solid tumors (41-44). In three studies, xenograft tumors were established in the animal flank and DCE-MRI studies were performed at baseline and following acute treatment with vandetanib (usually at 24 hours) (41-43). Two studies identified alterations in imaging-based quantifiable measures of tumor vasculature, but one study identified no changes in imaging-based measures at 24 hours. Additionally, a study examined the effects of vandetanib in patients with advanced colorectal cancer and liver metastases in a phase I clinical trial through DCE-MRI studies (44). In that study, no statistically significant changes were identified in the imaging-based vascular biomarkers. These patients were imaged serially, but no explanation was given regarding timing of these studies. A more recent study in patients with pancreatic cancer demonstrated the utility of DCE-MRI in assessing alterations in vascular function following combined treatment with sorafenib and chemotherapy (45).
DCE-MRI has not been previously utilized to assess tumor angiogenesis in an orthotopic murine model of ATC. We identified statistically significant alterations in vascular permeability (day -1, +1, +7 and +14) and VVF in vandetanib-treated animals at day +7, but not at day +1, as compared to controls. These findings underscore the importance of appropriate post-treatment DCE-MRI timing. Additionally, this alteration in imaging-based variables precedes significant differences in tumor volume measured in the treatment vs. control groups (46). There are ongoing investigations to determine the predictive value of these quantifiable, imaging-based biomarkers in subsequent response to treatment. The imaging findings were consistent with our immunohistochemistry studies that revealed decreased endothelial cells in the vandetanib-treated tumors. This preclinical model provides an effective platform to assess the effects of targeted therapies through traditional measures, (e.g., tumor volume) and imaging-based parameters that reflect alterations in the tumor microenvironment. Additionally, this preclinical platform enables evaluation of the effectiveness of a combination of targeted therapies with conventional modalities, such as external beam radiation therapy. This orthotopic xenograft model of ATC can be used to assess the specific sequencing of a variety of treatments to optimize potential regimens for use in clinical trials, and to determine the appropriate timing for imaging studies to identify alterations in imaging-based variables that may reflect significant alterations in the tumor microvasculature. Preclinical therapeutic sequencing based on this model may provide insights that accelerate clinical care improvement. Currently, such improvement might be delayed due to the relatively low incidence of ATC, and the challenge of recruiting a sufficient number of patients to clinical trials.
In summary, we found that inhibition of EGFR and VEGFR2 in ATC by vandetanib causes significant tumor growth inhibition in vivo in an orthotopic xenograft model. This effect most likely results from the antiangiogenic effects of this agent. We found that DCE-MRI is a valuable tool in the quantifiable evaluation of ATC tumor vasculature change in vivo. We have developed a preclinical platform for assessing the sequencing and effectiveness of novel therapies for ATC. Our platform capitalizes on assessment of alterations in tumor microvasculature through non-invasive imaging studies. Based on these new findings, further clinical development of antiangiogenic agents such as vandetanib in the treatment of ATC is warranted.
Supplementary Material
Supplemental Figure Legend.
Supplemental Figure 1. Vandetanib inhibited proliferation of ATC cell lines Hth83 and 8505C in vitro. ATC cell lines Hth3 and 8505C were incubated for 72hrs in increasing concentrations of vandetanib ( 0.59-150 μM ) in media supplemented with 10% FBS. At the end of 72 hrs the optical density of the treated and untreated cells were measured using an MTT assy. Proliferation was found to be inhibited in a dose dependent manner with mean GI50 in at least three independent experiments for Hth83 of 3.30 μM and 7.56 μM for 8505C. Y axis indicates optical density sample/ optical density control at 570 nm, X axis indicates log concentration of Vandetanib in μM and error bars indicate SE (n=6 ).
Acknowledgements
The authors thank Dorinda Smith for her secretarial support and Donald R. Norwood in Scientific Publications and Douglas P. Monroe for their editorial comments and suggestions.
Grant Support: The University of Texas MD Anderson Cancer Center Specialized Program of Research Excellence in Head and Neck Cancer (P50 CA097007A), AstraZeneca, the MD Anderson PANTHEON Program, MD Anderson institutional start-up funds, the National Institutes of Health (NIH) Cancer Center Support Grant (P30 CA016672), and the National Cancer Institute's Small Animal Imaging Resource Program Grant (U24 CA126577). S.Y. Lai was supported by NIH Mentored Career Development Award K08 DE018061. M.K. Gule was supported by NIH training grant T32 CA009599.
References
- 1.Neff RL, Farrar WB, Kloos RT, Burman KD. Anaplastic thyroid cancer. Endocrinol Metab Clin North Am. 2008;37:525–38. xi. doi: 10.1016/j.ecl.2008.02.003. [DOI] [PubMed] [Google Scholar]
- 2.Ries L, Young J, Keel GE, Eisner MP, Lin YD, Horner M-J, editors. SEER Survival Monograph: Cancer Survival Among Adults: U.S. SEER Program, 1988-2001, Patient and Tumor Characteristics. National Cancer Institute; Bethesda, MD: 2007. SEER Program, NIH Pub No 07-6215. 2007. [Google Scholar]
- 3.Ain KB. Anaplastic thyroid carcinoma: a therapeutic challenge. Semin Surg Oncol. 1999;16:64–9. doi: 10.1002/(sici)1098-2388(199901/02)16:1<64::aid-ssu10>3.0.co;2-u. [DOI] [PubMed] [Google Scholar]
- 4.Chang HS, Nam KH, Chung WY, Park CS. Anaplastic thyroid carcinoma: a therapeutic dilemma. Yonsei Med J. 2005;46:759–64. doi: 10.3349/ymj.2005.46.6.759. [DOI] [PMC free article] [PubMed] [Google Scholar]
- 5.Wang Y, Tsang R, Asa S, Dickson B, Arenovich T, Brierley J. Clinical outcome of anaplastic thyroid carcinoma treated with radiotherapy of once- and twice-daily fractionation regimens. Cancer. 2006;107:1786–92. doi: 10.1002/cncr.22203. [DOI] [PubMed] [Google Scholar]
- 6.De Crevoisier R, Baudin E, Bachelot A, et al. Combined treatment of anaplastic thyroid carcinoma with surgery, chemotherapy, and hyperfractionated accelerated external radiotherapy. Int J Radiat Oncol Biol Phys. 2004;60:1137–43. doi: 10.1016/j.ijrobp.2004.05.032. [DOI] [PubMed] [Google Scholar]
- 7.Bhatia A, Rao A, Ang KK, et al. Anaplastic thyroid cancer: Clinical outcomes with conformal radiotherapy. Head Neck. 2010;32:829–36. doi: 10.1002/hed.21257. [DOI] [PubMed] [Google Scholar]
- 8.Mitsudomi T, Yatabe Y. Epidermal growth factor receptor in relation to tumor development: EGFR gene and cancer. FEBS J. 2010;277:301–8. doi: 10.1111/j.1742-4658.2009.07448.x. [DOI] [PubMed] [Google Scholar]
- 9.Wong SF. Cetuximab: an epidermal growth factor receptor monoclonal antibody for the treatment of colorectal cancer. Clin Ther. 2005;27:684–94. doi: 10.1016/j.clinthera.2005.06.003. [DOI] [PubMed] [Google Scholar]
- 10.Ramsden JD. Angiogenesis in the thyroid gland. J Endocrinol. 2000;166:475–80. doi: 10.1677/joe.0.1660475. [DOI] [PubMed] [Google Scholar]
- 11.Hanahan D, Folkman J. Patterns and emerging mechanisms of the angiogenic switch during tumorigenesis. Cell. 1996;86:353–64. doi: 10.1016/s0092-8674(00)80108-7. [DOI] [PubMed] [Google Scholar]
- 12.Fenton C, Patel A, Dinauer C, Robie DK, Tuttle RM, Francis GL. The expression of vascular endothelial growth factor and the type 1 vascular endothelial growth factor receptor correlate with the size of papillary thyroid carcinoma in children and young adults. Thyroid. 2000;10:349–57. doi: 10.1089/thy.2000.10.349. [DOI] [PubMed] [Google Scholar]
- 13.Dhar DK, Kubota H, Kotoh T, et al. Tumor vascularity predicts recurrence in differentiated thyroid carcinoma. Am J Surg. 1998;176:442–7. doi: 10.1016/s0002-9610(98)00238-4. [DOI] [PubMed] [Google Scholar]
- 14.Viglietto G, Maglione D, Rambaldi M, et al. Upregulation of vascular endothelial growth factor (VEGF) and downregulation of placenta growth factor (PlGF) associated with malignancy in human thyroid tumors and cell lines. Oncogene. 1995;11:1569–79. [PubMed] [Google Scholar]
- 15.Kim S, Prichard CN, Younes MN, et al. Cetuximab and irinotecan interact synergistically to inhibit the growth of orthotopic anaplastic thyroid carcinoma xenografts in nude mice. Clin Cancer Res. 2006;12:600–7. doi: 10.1158/1078-0432.CCR-05-1325. [DOI] [PMC free article] [PubMed] [Google Scholar]
- 16.Schiff BA, McMurphy AB, Jasser SA, et al. Epidermal growth factor receptor (EGFR) is overexpressed in anaplastic thyroid cancer, and the EGFR inhibitor gefitinib inhibits the growth of anaplastic thyroid cancer. Clin Cancer Res. 2004;10:8594–602. doi: 10.1158/1078-0432.CCR-04-0690. [DOI] [PubMed] [Google Scholar]
- 17.Kim S, Schiff BA, Yigitbasi OG, et al. Targeted molecular therapy of anaplastic thyroid carcinoma with AEE788. Mol Cancer Ther. 2005;4:632–40. doi: 10.1158/1535-7163.MCT-04-0293. [DOI] [PubMed] [Google Scholar]
- 18.Schweppe RE, Klopper JP, Korch C, et al. Deoxyribonucleic acid profiling analysis of 40 human thyroid cancer cell lines reveals cross-contamination resulting in cell line redundancy and misidentification. J Clin Endocrinol Metab. 2008;93:4331–41. doi: 10.1210/jc.2008-1102. [DOI] [PMC free article] [PubMed] [Google Scholar]
- 19.Kim S, Park YW, Schiff BA, et al. An orthotopic model of anaplastic thyroid carcinoma in athymic nude mice. Clin Cancer Res. 2005;11:1713–21. doi: 10.1158/1078-0432.CCR-04-1908. [DOI] [PubMed] [Google Scholar]
- 20.Ramirez MS, Bankson JA. A practical method for 2D multiple-animal MRI. J Magn Reson Imaging. 2007;26:1162–6. doi: 10.1002/jmri.21112. [DOI] [PubMed] [Google Scholar]
- 21.Weissleder R, Cheng HC, Marecos E, Kwong K, Bogdanov A., Jr Non-invasive in vivo mapping of tumour vascular and interstitial volume fractions. Eur J Cancer. 1998;34:1448–54. doi: 10.1016/s0959-8049(98)00195-6. [DOI] [PubMed] [Google Scholar]
- 22.Wen X, Jackson EF, Price RE, et al. Synthesis and characterization of poly(L-glutamic acid) gadolinium chelate: a new biodegradable MRI contrast agent. Bioconjug Chem. 2004;15:1408–15. doi: 10.1021/bc049910m. [DOI] [PubMed] [Google Scholar]
- 23.Smallridge RC, Marlow LA, Copland JA. Anaplastic thyroid cancer: molecular pathogenesis and emerging therapies. Endocrine-related cancer. 2009;16:17–44. doi: 10.1677/ERC-08-0154. [DOI] [PMC free article] [PubMed] [Google Scholar]
- 24.Lee DH, Lee GK, Kong SY, et al. Epidermal growth factor receptor status in anaplastic thyroid carcinoma. Journal of clinical pathology. 2007;60:881–4. doi: 10.1136/jcp.2006.041251. [DOI] [PMC free article] [PubMed] [Google Scholar]
- 25.Ensinger C, Spizzo G, Moser P, et al. Epidermal growth factor receptor as a novel therapeutic target in anaplastic thyroid carcinomas. Annals of the New York Academy of Sciences. 2004;1030:69–77. doi: 10.1196/annals.1329.009. [DOI] [PubMed] [Google Scholar]
- 26.Caponigro F, Formato R, Caraglia M, Normanno N, Iaffaioli RV. Monoclonal antibodies targeting epidermal growth factor receptor and vascular endothelial growth factor with a focus on head and neck tumors. Curr Opin Oncol. 2005;17:212–7. doi: 10.1097/01.cco.0000159623.68506.cf. [DOI] [PubMed] [Google Scholar]
- 27.Bonner JA, Harari PM, Giralt J, et al. Radiotherapy plus cetuximab for squamous-cell carcinoma of the head and neck. N Engl J Med. 2006;354:567–78. doi: 10.1056/NEJMoa053422. [DOI] [PubMed] [Google Scholar]
- 28.Wagner AD, Arnold D, Grothey AA, Haerting J, Unverzagt S. Anti-angiogenic therapies for metastatic colorectal cancer. Cochrane Database Syst Rev. 2009:CD005392. doi: 10.1002/14651858.CD005392.pub3. [DOI] [PMC free article] [PubMed] [Google Scholar]
- 29.Wells SA, Jr., Gosnell JE, Gagel RF, et al. Vandetanib for the treatment of patients with locally advanced or metastatic hereditary medullary thyroid cancer. J Clin Oncol. 2010;28:767–72. doi: 10.1200/JCO.2009.23.6604. [DOI] [PMC free article] [PubMed] [Google Scholar]
- 30.Nucera C, Nehs MA, Mekel M, et al. A novel orthotopic mouse model of human anaplastic thyroid carcinoma. Thyroid. 2009;19:1077–84. doi: 10.1089/thy.2009.0055. [DOI] [PMC free article] [PubMed] [Google Scholar]
- 31.Kim S. Animal models of cancer in the head and neck region. Clinical and experimental otorhinolaryngology. 2009;2:55–60. doi: 10.3342/ceo.2009.2.2.55. [DOI] [PMC free article] [PubMed] [Google Scholar]
- 32.Shibata MA, Shibata E, Morimoto J, et al. An immunocompetent murine model of metastatic mammary cancer accessible to bioluminescence imaging. Anticancer Res. 2009;29:4389–95. [PubMed] [Google Scholar]
- 33.Surguladze D, Steiner P, Prewett M, Tonra JR. Methods in molecular biology. Vol. 602. Clifton, NJ: 2010. Methods for evaluating effects of an irinotecan + 5-fluorouracil/leucovorin (IFL) regimen in an orthotopic metastatic colorectal cancer model utilizing in vivo bioluminescence imaging. pp. 235–52. [DOI] [PubMed] [Google Scholar]
- 34.Lee JJ, Foukakis T, Hashemi J, et al. Molecular cytogenetic profiles of novel and established human anaplastic thyroid carcinoma models. Thyroid. 2007;17:289–301. doi: 10.1089/thy.2006.0246. [DOI] [PubMed] [Google Scholar]
- 35.UKCCCR guidelines for the use of cell lines in cancer research. Br J Cancer. 2000;82:1495–509. doi: 10.1054/bjoc.1999.1169. [DOI] [PMC free article] [PubMed] [Google Scholar]
- 36.Miettinen M, Franssila KO. Variable expression of keratins and nearly uniform lack of thyroid transcription factor 1 in thyroid anaplastic carcinoma. Human pathology. 2000;31:1139–45. doi: 10.1053/hupa.2000.16667. [DOI] [PubMed] [Google Scholar]
- 37.Hoffmann S, Glaser S, Wunderlich A, et al. Targeting the EGF/VEGF-R system by tyrosinekinase inhibitors--a novel antiproliferative/antiangiogenic strategy in thyroid cancer. Langenbeck's archives of surgery / Deutsche Gesellschaft fur Chirurgie. 2006;391:589–96. doi: 10.1007/s00423-006-0104-y. [DOI] [PubMed] [Google Scholar]
- 38.Miles KA. Perfusion CT for the assessment of tumour vascularity: which protocol? The British journal of radiology. 2003;76:S36–42. doi: 10.1259/bjr/18486642. Spec No 1. [DOI] [PubMed] [Google Scholar]
- 39.Hermans R, Meijerink M, Van den Bogaert W, Rijnders A, Weltens C, Lambin P. Tumor perfusion rate determined noninvasively by dynamic computed tomography predicts outcome in head-and-neck cancer after radiotherapy. Int J Radiat Oncol Biol Phys. 2003;57:1351–6. doi: 10.1016/s0360-3016(03)00764-8. [DOI] [PubMed] [Google Scholar]
- 40.Lehtio K, Eskola O, Viljanen T, et al. Imaging perfusion and hypoxia with PET to predict radiotherapy response in head-and-neck cancer. Int J Radiat Oncol Biol Phys. 2004;59:971–82. doi: 10.1016/j.ijrobp.2003.12.014. [DOI] [PubMed] [Google Scholar]
- 41.Checkley D, Tessier JJ, Kendrew J, Waterton JC, Wedge SR. Use of dynamic contrast-enhanced MRI to evaluate acute treatment with ZD6474, a VEGF signalling inhibitor, in PC-3 prostate tumours. Br J Cancer. 2003;89:1889–95. doi: 10.1038/sj.bjc.6601386. [DOI] [PMC free article] [PubMed] [Google Scholar]
- 42.Ansiaux R, Dewever J, Gregoire V, Feron O, Jordan BF, Gallez B. Decrease in tumor cell oxygen consumption after treatment with vandetanib (ZACTIMA; ZD6474) and its effect on response to radiotherapy. Radiat Res. 2009;172:584–91. doi: 10.1667/RR1744.1. [DOI] [PubMed] [Google Scholar]
- 43.Bradley DP, Tessier JL, Checkley D, et al. Effects of AZD2171 and vandetanib (ZD6474, Zactima) on haemodynamic variables in an SW620 human colon tumour model: an investigation using dynamic contrast-enhanced MRI and the rapid clearance blood pool contrast agent, P792 (gadomelitol). NMR Biomed. 2008;21:42–52. doi: 10.1002/nbm.1161. [DOI] [PubMed] [Google Scholar]
- 44.Mross K, Fasol U, Frost A, et al. DCE-MRI assessment of the effect of vandetanib on tumor vasculature in patients with advanced colorectal cancer and liver metastases: a randomized phase I study. J Angiogenes Res. 2009;1:5. doi: 10.1186/2040-2384-1-5. [DOI] [PMC free article] [PubMed] [Google Scholar]
- 45.Akisik MF, Sandrasegaran K, Bu G, Lin C, Hutchins GD, Chiorean EG. Pancreatic cancer: utility of dynamic contrast-enhanced MR imaging in assessment of antiangiogenic therapy. Radiology. 2010;256:441–9. doi: 10.1148/radiol.10091733. [DOI] [PubMed] [Google Scholar]
- 46.Schwartz DL, Powis G, Thitai-Kumar A, et al. The selective hypoxia inducible factor-1 inhibitor PX-478 provides in vivo radiosensitization through tumor stromal effects. Mol Cancer Ther. 2009;8:947–58. doi: 10.1158/1535-7163.MCT-08-0981. [DOI] [PMC free article] [PubMed] [Google Scholar]
Associated Data
This section collects any data citations, data availability statements, or supplementary materials included in this article.
Supplementary Materials
Supplemental Figure Legend.
Supplemental Figure 1. Vandetanib inhibited proliferation of ATC cell lines Hth83 and 8505C in vitro. ATC cell lines Hth3 and 8505C were incubated for 72hrs in increasing concentrations of vandetanib ( 0.59-150 μM ) in media supplemented with 10% FBS. At the end of 72 hrs the optical density of the treated and untreated cells were measured using an MTT assy. Proliferation was found to be inhibited in a dose dependent manner with mean GI50 in at least three independent experiments for Hth83 of 3.30 μM and 7.56 μM for 8505C. Y axis indicates optical density sample/ optical density control at 570 nm, X axis indicates log concentration of Vandetanib in μM and error bars indicate SE (n=6 ).