Abstract
Prostate T2 mapping was performed in 34 consecutive patients using an accelerated multi-echo spin-echo sequence with four-fold k-space undersampling leading to a net acceleration factor of 3.3 on a 3T scanner. The mean T2 values from the accelerated and conventional, unaccelerated sequences demonstrated a very high correlation (r = 0.99). Different prostate segments demonstrated similarly good interscan reproducibility (p = NS) with slightly larger difference at base: 2.0 ± 1.6 % for left base and 2.1 ± 1.1 % for right base. In patients with subsequent targeted biopsy, T2 values of histologically proven malignant tumor areas were significantly lower than the suspicious looking but non-malignant lesions (p<0.05) and normal areas (p<0.001): 100 ± 10 ms for malignant tumors, 114 ± 23 ms for suspicious lesions and 149 ± 32 ms for normal tissues. The proposed method can provide an effective approach for accelerated T2 quantification for prostate patients.
Keywords: prostate cancer, k-space undersampling, T2 mapping
INTRODUCTION
Prostate cancer is the most common non-cutaneous tumor, and the second most common cause of cancer related death in American men (1). Magnetic resonance imaging (MRI) is currently regarded as the best, non-invasive modality for localization and staging of prostate cancer due to its superior soft tissue contrast and high resolution. T2-weighted turbo spin-echo MRI is the mainstay sequence for depicting prostatic zonal anatomy. Approximately 70% of prostate cancers are found in the peripheral zone (PZ) of the prostate. The primary MR signature of prostate cancer in the PZ is a hypointense region within the normally hyperintense background from healthy glandular tissues on T2 weighted images (2). However, T2-weighted imaging alone is reported to have a wide range of sensitivity and specificity of 22 – 85% and 50 – 99%, respectively (2,3), motivating the exploration of additional MR-based techniques to improve the localization and staging of prostate cancer including MR-spectroscopic imaging, diffusion weighted imaging (DWI), and dynamic contrast enhanced (DCE) imaging. Generally overlooked is the potential value of quantitative T2 mapping. Measurements of tissue T2 values may prove of value in better discriminating cancer from healthy tissues(4,5) and will allow investigators to perform longitudinal studies and inter-scanner and intra-scanner comparisons. Moreover, T2-weighted images have to be digitized in order to be fed into automated decision support systems, while quantitative T2 maps can be incorporated directly.
The standard T2 mapping involves acquiring spin-echo images at increasing echo times (TE) but is associated with long scan durations making this method impractical for most clinical applications. In previous prostate studies, sampling of the relaxation curve was limited to four to six points to reduce the scan time (4–9). Roebuck et al used a Carr-Purcell-Meiboom-Gill (CPMG) sequence to sample the T2 decay with a series of equally spaced refocusing pulses in each repetition time to shorten the scan time (10). While it is more time-efficient than successive acquisition of single-echo spin-echo data, the multi-echo approach still results in rather long scan times because of the long repetition time for each phase encoding step. As a consequence, these measurements are prone to motion artifacts, especially if large volume coverage of the target anatomy is required. Furthermore, the associated specific absorption rate (SAR) is high due to the frequent use of 180° RF pulse series.
Recently, a new reconstruction algorithm combined with a dedicated k-space undersampling pattern was developed to reduce the number of phase-encoding steps in a multi-echo spin-echo measurement without loss of spatial resolution and dynamic range (11). In the proposed approach, the k-space data at each echo time were undersampled and a reconstruction algorithm that exploited the temporal correlation of the MR signal in k-space was used to reconstruct alias-free images. With this method, alias-free brain T2 maps were acquired with four-fold k-space undersampling resulting in a net acceleration factor of 3.4 in healthy volunteers (12). The purpose of the present study was to characterize T2 values of tumorous and normal prostate tissues using this accelerated T2 mapping technique. Lesions that were suspicious for malignant tumor on MRI were confirmed with a targeted prostate biopsy system that fused real-time transrectal ultrasound (TRUS) images with previously acquired MR images (13,14).
MATERIALS AND METHODS
Study Design and Patient Population
This prospective, single institution study was approved by the local institutional review board (IRB) and was compliant with the Health Insurance Portability and Accountability Act (HIPAA); informed consent was obtained from each patient. A total of thirty-four consecutive patients were enrolled in the study. All patients underwent prostate MRI for localization and staging of prostate cancer. Because the present study focused on characterization of malignancy in the PZ zone, eighteen patients with suspicious lesions in the PZ zone were selected for a subsequent targeted biopsy by fusing the previously acquired MR images with TRUS imaging. The mean age of the patients with biopsy confirmed malignant tumor was 59 years and the mean prostate-specific antigen (PSA) level was 6.5 ng/dl (Table 1). The mean age for the patients with negative biopsy was 61 years and the mean PSA was 5.3 ng/dl.
Table 1.
Patients with MRI/TRUS fusion targeted prostate biopsy (median values are presented in parentheses).
| Number of patients |
Number of biopsy cores |
Mean Age(years) |
Mean PSA(ng/dl) |
Mean Tumor Gleason Score |
|
|---|---|---|---|---|---|
| Patients with Positive biopsy | 7 | 13 | 59 (61) | 6.5 (6.2) | 7 (7) |
| Patients with Negative biopsy | 11 | 18 | 61 (60) | 5.3 (4.9) | n/a |
Accelerated T2 Mapping Technique
In a multi-echo spin-echo sequence with constant echo-spacing ΔTE, the k-space data Si(k) at k-space positions k and consecutive echo times TEi are linearly correlated by means of a convolution kernel E(k) (12),
| [1] |
provided the transverse magnetization follows approximately a mono-exponential decay. The convolution kernel E(k) has a well localized peak at k = 0 that diminishes quickly towards higher frequencies. This indicates that data samples that are closely neighboring in k-t-space are highly correlated, with the degree of correlation rapidly diminishing with the distance between the samples.
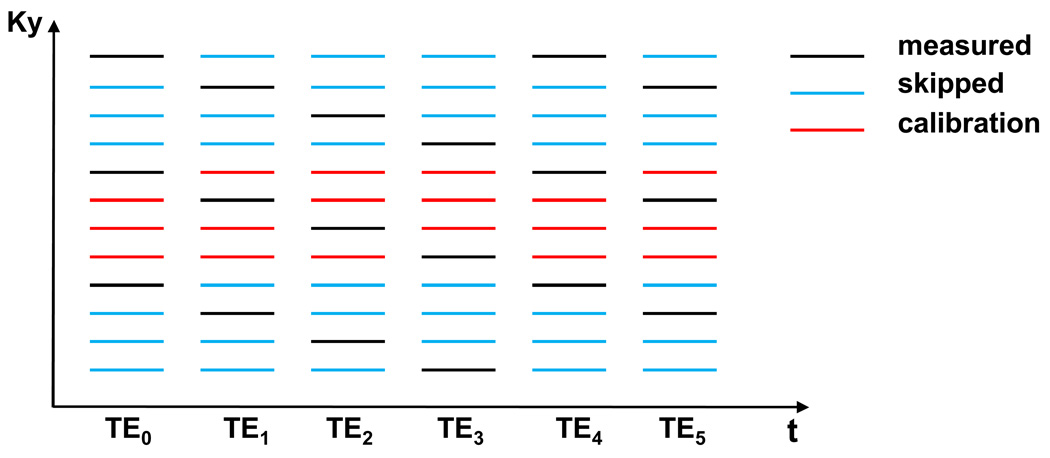
This high intrinsic redundancy in multi-echo spin-echo acquisitions is utilized to reduce the amount of data that is needed to fill k-space. The k-space undersampling scheme is illustrated in Figure 1 for an undersampling factor of R = 4 (11,12). Only one in every R phase-encoding steps (black lines) is acquired at each echo time skipping the rest of the phase-encoding steps (blue lines). The position of the measured k-space line is shifted from one echo time to the next to achieve a better coverage of k-space over time. Therefore, each k-space line is acquired once after R echoes. A number of blocks consisting each of R consecutive k-space lines are acquired in the centre of k-space without undersampling (red lines) for calibration purposes.
Figure 1.
Acquisition scheme for an undersampling factor R = 4. Black lines represent the acquired k-space samples. Blue lines represent the skipped sampling positions corresponding to Nyquist sampling. Red lines represent the samples acquired for autocalibration.
To avoid fold-over artifacts due to undersampling, the missing k-space samples are first estimated by exploiting the linear correlation between the k-space samples at consecutive echo times. Each missing sample Si(k) is estimated by a linear combination of its neighbors in the k-t-space (11,12), according to:
| [2] |
where nτ and nζ define the size of the neighborhood in the echo time and in k-space dimension respectively, and w denotes the coefficients of the linear combination. The k-space index k is either of dimension 2 for 2D acquisitions, or of dimension 3 for 3D acquisitions. Because the reconstruction kernel w is translation-invariant in the k-t-space, the coefficients w in Eq. [2] can be estimated from a subset of data that are acquired with Nyquist sampling for calibration purpose. The reconstruction coefficients w are calculated on the basis of a least-squares fit from the calibration samples:
| [3] |
MR Imaging
Prostate MRI scans including triplane T2-weighted, DWI, DCE, 3D spectroscopic imaging, and T2 mapping were performed using the 16-channel anterior half of a 32-channel SENSE cardiac array (Invivo, Orlando, FL, USA) in combination with an endorectal coil (BPX 30, Medrad, Warrendale, PA, USA) on a 3.0 T whole-body scanner (Achieva 3.0T, Philips Healthcare, Best, the Netherlands) on all patients. Triplane T2-weighted turbo spin-echo images were acquired with TR / TE = 8852 / 120 ms, Field of view (FOV) = 140 mm × 140 mm, 3 mm slice thickness. DCE MRI was acquired with TR / TE = 5.5 / 2.1 ms, FOV = 262 mm × 262 mm , 6 mm slice thickness, obtained during a single-dose bolus injection of 0.1 mmol / kg gadopentetate dimeglumine injected at 3cc/sec. MR spectroscopy was acquired with 3D CSI PRESS, TR / TE = 980 / 100 ms, FOV = 72 mm × 72 mm, 6 mm slice thickness. Prostate T2 maps were acquired with a multi-echo spin-echo sequence with an undersampling factor of R = 4 and 16 calibration lines. The net acceleration factor with respect to the conventional multi-echo spin-echo sequence was 3.3. The following parameters were applied for imaging acquisition: TR = 2200 ms, FOV = 280 mm × 280 mm, data matrix = 256 × 256, 3 mm slice thickness, 10 axial slices. Sixteen echoes were acquired with TE = 32 ms, 48 ms, 64 ms, …, up to 272 ms. The total scan time for T2 mapping was 5 min 48 sec. In eight patients without targeted biopsy, another T2 map with the same parameters was acquired about 30 minutes after the first T2 map scan without repositioning the patients to investigate interscan reproducibility. In another eight patients without targeted biopsy, a single axial slice T2 map was acquired with the same parameters with the conventional, unaccelearated sequence for reference.
Tumor “Ground Truth” Labels with Targeted Biopsy
In eighteen patients, target lesions for MRI/TRUS fusion guided biopsies were identified by an experienced radiologist based on multiparametric MR images (The T2 maps were not used to define the target lesions). The criteria for positive lesions was defined in prior studies (15,16) as circumscribed, round/ellipsoid low-signal intensity areas on T2-weighted images and/or low-signal intensity areas on ADC maps, and/or areas with a choline:citrate ratio of 3 or more standard deviations above the normal value on spectroscopic images, and/or nodular masslike hot spots on Ktrans, Kep maps from DCE MRI. During the biopsy, previously acquired MR images were fused to real-time TRUS, thereby the needle was inserted into the suspicious regions identified on the MRI using ultrasound guidance (13,14).
Data Analysis
Image reconstruction and T2 mapping
The undersampled k-space data were transferred to a PC for data analysis with an in-house built software tool using C++. The missing data were reconstructed according to Eq. [2]. The convolution kernel matrix used for reconstruction of the undersampled images was chosen to be 3 × 3 × 9 (kx, ky and t) using the method described previously (11,12). T2 maps were calculated pixel by pixel by fitting a monoexponential decay to the magnitude of the multi-echo spin-echo images by means of a non-linear least-squares algorithm. Only data above 10 times the standard deviation of noise were analyzed. The noise level was determined from the average of a rectangular area containing 20 × 20 pixels on the left top corner of the image at the first echo time for each slice.
Comparison with the conventional multi-echo spin-echo technique
To investigate the agreement of the accelerated T2 mapping sequence with the conventional T2 mapping sequence, mean T2 values were computed in four ROIs drawn on the single slice from the conventional scan and identically placed ROIs drawn on the corresponding slice from the accelerated scan for each patient. Correlation between the mean T2 values obtained with and without acceleration was assessed and Bland-Altman analysis was performed.
Interscan reproducibility
For the two T2 maps acquired 30 minutes apart, six ROIs were drawn for each patient on six different prostate segments: right apex (RA), left apex (LA), right middle (RM), left middle (LM), right base (RB) and left base (LB). The reproducibility was calculated as the normalized value of the differences between the mean T2 values from the two scans for each ROI.
T2 statistics for malignant tumors
For patients with biopsy results positive for prostate cancer, tumor ROIs were drawn on the suspicious regions previously identified by the radiologist and confirmed with the targeted biopsy. Control ROIs were drawn on the contralateral side of the prostate if it was not suspicious looking on the multiparametric MR images according to the criteria defined above or on the same region on a neighboring slice if the contralateral region was suspicious. Comparisons of T2 values between tumor and control areas were performed by paired Student t-test using Microsoft Excel.
RESULTS
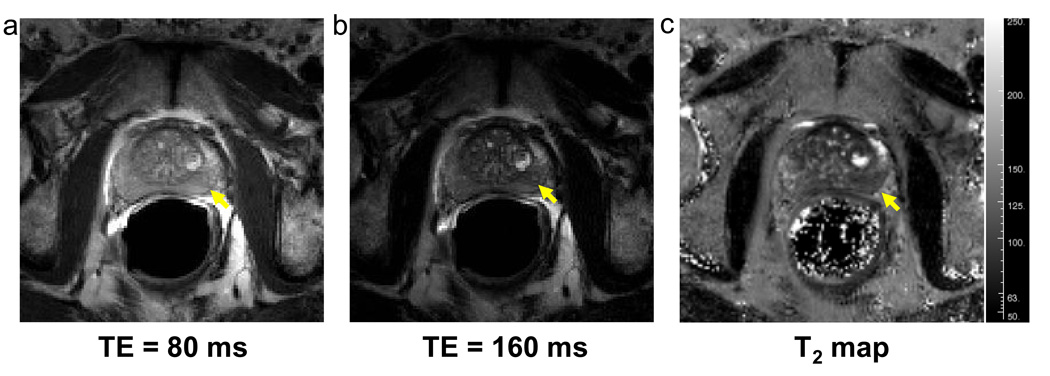
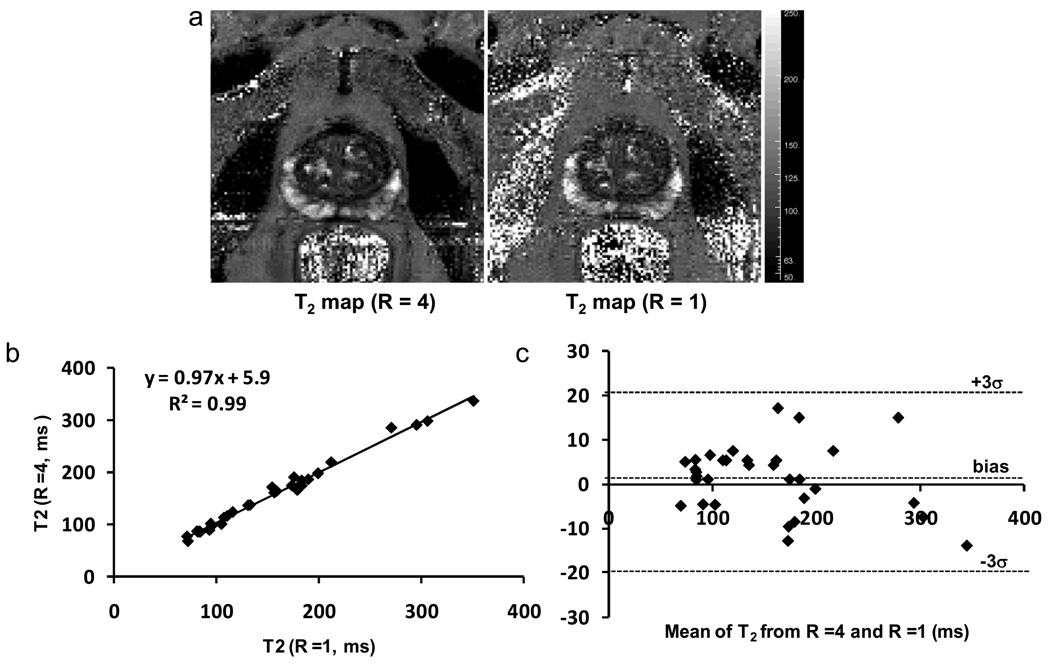
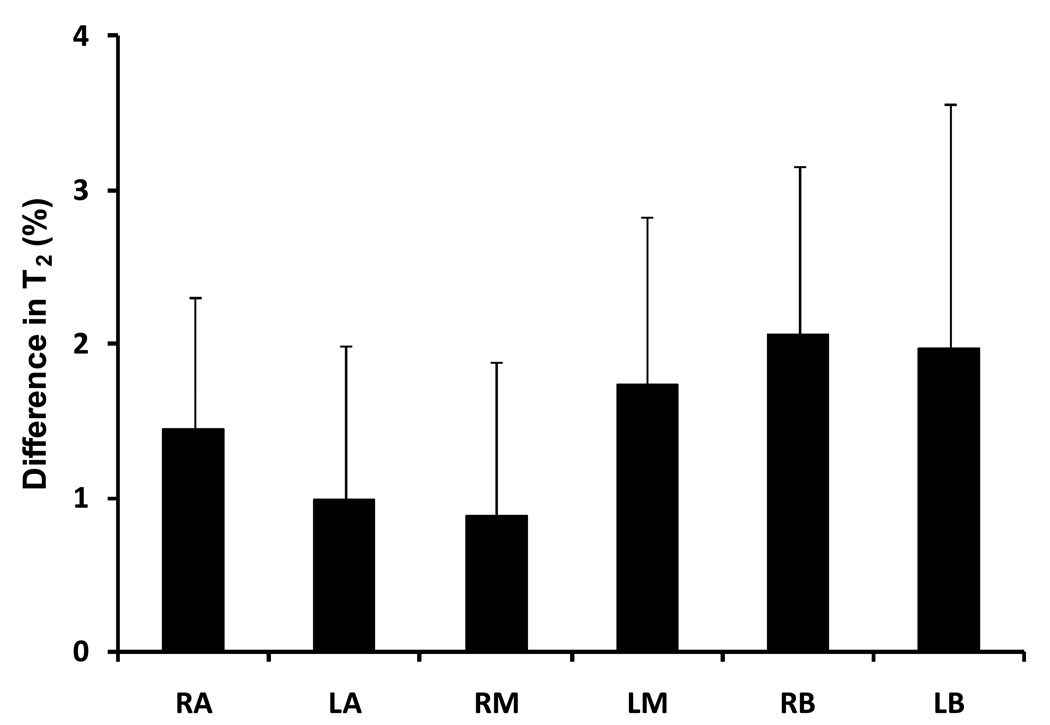
T2 maps were successfully obtained in all 34 patients. Reconstructed images from undersampled data exhibited no visible folding artifacts. Figure 2a and 2b illustrate the reconstructed images acquired at TE = 80 ms and TE = 160 ms from a patient (Yellow arrows indicate a suspicious hypointense area). The T2 map calculated from the reconstructed multi-echo images is illustrated in Figure 2c with the suspicious lesion depicted as a dark spot. In Figure 3a, the accelerated T2 map demonstrated a very good agreement with the reference, unaccelerated approach. A noticeable drop of SNR was observed in the conventional T2 map (R =1) which was acquired with single slice acquisition which led to a shorter TR. The mean T2 values obtained with R = 4 exhibited a strong linear correlation (r =0.99) with the mean T2 values obtained with the conventional sequence (Figure 3b). The slope of the regression curve was very close to 1 with a small intercept of approximately 6 ms. The Bland-Altman plot confirmed the agreement between the conventional and accelerated measurements (Figure 3c). The mean difference between the two methods was 1 ± 7 ms. The interscan reproducibility of the accelerated T2 mapping technique is illustrated in Figure 4. All six prostate segments demonstrated similarly good reproducibility (p = NS) with slightly larger difference at base: 2.0 ± 1.6 % for LB and 2.1 ± 1.1 % for RB.
Figure 2.
The reconstructed images at echo times 80 ms (a) and 160 ms (b) and the calculated T2 map (c) from the reconstructed images from a patient (54 yrs, PSA = 3.6, Gleason 6 (3 +3)). Yellow arrows indicate a suspicious lesion.
Figure 3.
T2 maps (a) acquired from the accelerated approach (R = 4) and the conventional unaccelerated approach (R =1) from a patient(59 yrs, PSA = 11.1), regression plot (b) and Bland-Altman plot (c) of the mean T2 values obtained with the accelerated T2 mapping technique and the conventional T2 mapping. The mean T2 values obtained with R = 4 demonstrated very good correlations (r = 0.99) with the mean T2 values obtained with the conventional sequence. The Bland-Altman plot confirmed the very good agreement between the regular and accelerated measurements.
Figure 4.
Interscan reproducibility of the fast T2 mapping technique. All six segments demonstrated similarly good reproducibility (p = NS) with slightly larger difference at base: 2.0± 1.6 % for LB and 2.1 ± 1.1 % for RB.
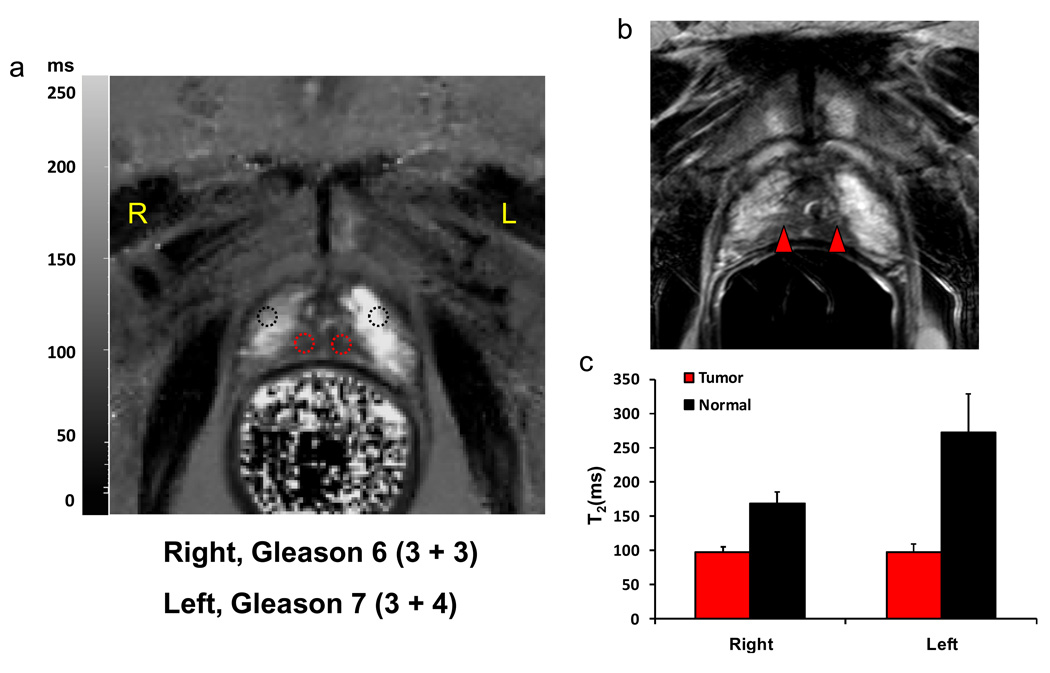
Figure 5 illustrates a representative T2 map from a 71-year-old male (a) and the corresponding lesions for fused MRI/TRUS guided targeted biopsy overlaid on T2-weighted image (b). Two biopsy targets (red arrow heads) were identified based on multiparametric MRI (15,16). The left apical lesion was characterized by low signal intensity on T2-weighted image, low signal intensity on ADC map, moderate hypervascularity on DCE MRI and the right apical lesion was positive on T2-weighted image and ADC map only (data not shown). MR spectroscopy was not contributory to the diagnosis. Fused MR/TRUS guided biopsy targeting these two lesions revealed a malignant tumor with Gleason score = 7 (3 + 4) in the left lesion and a malignant tumor of Gleason score 6 (3 + 3) in the right lesion. These two lesions were conspicuous as hypointensities against the bright background on the T2 map (Figure 5a). The T2 values of the two lesions were 95 ± 7 ms for the right target and 97 ± 13 ms for the left target vs. 169 ± 17 ms for the right control and 272 ± 57 ms for the left control (Figure 5c).
Figure 5.
Representative T2 map (a) and the corresponding lesion targets for fused MRI/TRUS guided biopsy overlaid on the corresponding T2 weighted image (b). Fused MR/TRUS guided biopsy targeted for these two lesions revealed a malignant tumor of Gleason 7 (3 + 4) for the left lesion and a malignant tumor of Gleason 6 (3 + 3) for the right lesion. These two lesions were conspicuous on the T2 map (a) with T2 of 95 ± 7 ms for the right target and 97 ± 13 ms for the left target vs. 169 ± 17 ms for the right control and 272 ± 57 ms for the left control (c).
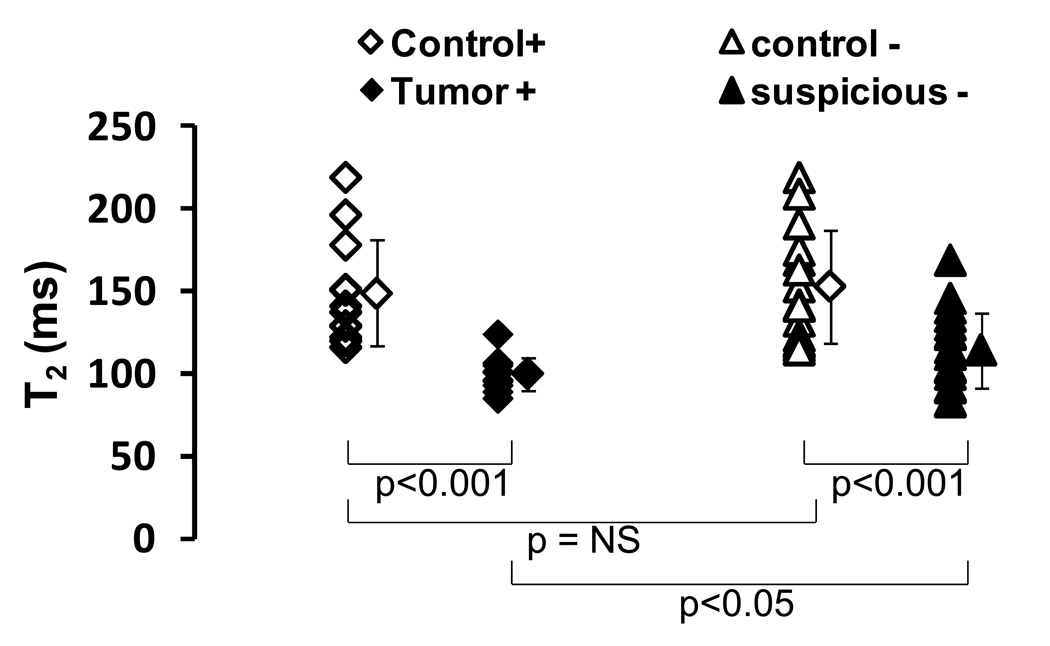
In 18 patients pre-biopsy MR imaging revealed 31 target lesions suspicious for prostate cancer. After fused MRI/TRUS guided targeted biopsy, 13 target lesions in 7 patients were histologically confirmed as prostate cancer (Table 1). The T2 values of malignant tumors ranged from 85 ms to 124 ms and the T2 of suspicious areas with negative biopsy findings fell in the range of 83 ms to 168 ms. The control areas had T2 values all above 113 ms. Statistically, the T2 values of malignant tumors were significantly lower than the control regions: 100 ± 10 ms for malignant tumors and 149 ± 32 ms for controls (p < 0.001) as shown in Figure 6. The T2 values of suspicious regions (with negative biopsy) were lower than the controls (p<0.001): 114 ± 23 ms for suspicious regions vs. 153 ± 34 ms for controls. Compared to malignant tumor areas, the suspicious areas demonstrated higher T2 values (p<0.05) while the control areas from both groups were statistically equivalent (p =NS).
Figure 6.
The T2 values of malignant tumors were significantly lower than the control regions: 100 ± 10 ms for malignant tumors vs. 149 ± 32 ms for controls (p< 0.001). The T2 values of suspicious regions (with negative biopsy) were also lower than the controls: 114 ± 23 ms for suspicious regions vs. 153 ± 34 ms for controls (p<0.001). Compared to malignant tumor areas, the suspicious areas demonstrated higher T2 values (p<0.05) while the control areas from both groups were statistically equivalent (p =NS).
DISCUSSION
Conventional quantitative T2 mapping using the multi-echo spin-echo sequence is associated with rather long scan times because of the long repetition time for each phase encoding step. In this study, T2 values of prostate tissues were characterized with our new accelerated multi-echo spin-echo T2 mapping technique in 34 patients. With k-t-reconstruction utilizing the temporal and spatial correlation of T2 signal decay, fold-over-free images were reconstructed at each echo time providing a series of diagnostic images with variable T2-weighting. As shown in Figure 2, the conspicuity of the suspicious lesion varied with the T2 weighting as the lesion was better depicted on the later echoes. In a group of eight patients for which conventional multi-echo spin-echo data were also acquired, the prostate T2 maps acquired with the proposed approach demonstrated excellent agreement with the conventional T2 maps. The interscan reproducibility study performed in eight patients indicated that T2 maps acquired with the accelerated sequence could be very well reproduced. The slightly worse reproduciblity at the base is likely due to the filling of the bladder over time. Our results demonstrate that this accelerated T2 relaxometry can provide an effective approach to achieve T2 quantification in prostate cancer patients.
The majority of the previous prostate T2 measurements were performed on 1.5T. The reported T2 values of malignant tissues ranged from 100 ms to 89 ms and T2 values of normal tissues ranged from 193 ms to 112 ms (5,8,10,17). There has been only limited investigation of T2 values of the prostate on 3T. Nevertheless, the T2 values from the accelerated T2 mapping technique were comparable to a recent report (18) : 100 ms vs. 109 ms for mean T2 values of malignant tumors and 149 ms vs 142 ms for mean T2 values of control tissues. We have also investigated suspicious but non-malignant areas which demonstrated higher T2 (larger variations) than the malignant areas. Compared to suspicious areas, malignant tumors had lower T2, therefore setting a threshold T2 for suspicious lesions could improve the specificity of T2-weighted imaging for cancer detection.
An undersampling factor of R = 4 used in the current study resulted in a net acceleration factor of 3.3. Due to scan time and SAR consideration, 10 slices were acquired with a scan time of approximately 6 minutes which was about the same as for T2-weighted imaging. However, 10 slices (3 mm thickness) was not able to cover the whole prostate gland. The undersampling factor was typically selected by comparing the root-mean-square error (RMSE) of the reconstructed images with different kernel size and calibration lines. In this study, the undersampling factor was chosen based on our previous investigations which demonstrated a very good agreement between the brain T2 maps acquired with an undersampling factor of R = 4 and those acquired with the conventional unaccelerated approach in volunteers (12). Increasing the undersampling factor can lead to further reduction in the scan time at the cost of lower SNR and higher residual fold-over artifacts on the reconstructed images. Since the reconstructed images in this study showed no visible folder-over artifacts and very good SNR, higher acceleration factors might be used for future scans which could achieve high resolution full-gland coverage T2 mapping within scan time comparable to T2-weighted imaging. To correlate MR findings with pathology is challenging for prostate. It is frequently difficult to obtain the “gold standard” prostatectomy histology because patients are on “watchful waiting” protocols or undergo radiation therapy. Targeted biopsy is an alternative method of validation that employs a stereotactic guidance. The biopsy core was taken from the target defined on MR images therefore providing validation for the ROIs drawn on T2 maps (19).
It should be noted that the assumption of mono-exponential decay is used to derive an echo time invariant reconstruction operator that performs a convolution of the undersampled data. The reconstructed data themselves are not imposed to be mono-exponential. Indeed, previous works reported non-mono-exponential behaviors of the prostate T2 relaxation (20). Echo time dependency associated with multi-exponential decays can be introduced into the reconstruction process by setting the temporal dimension of the convolution kernel equal to the number of echo times. Nevertheless, there are several limitations in our current study. First, the control areas were not biopsied. Nevertheless, the T2 values of healthy tissues from this study agreed very well with a previous report (18) thus are unlikely to be false negative. Second, in the reproducibility study, patients were not actually repositioned between the two scans because it would have required two placements of the endorectal coil. Instead, we reperformed the acquisition with a 30 minutes interval. Finally, our study population and number of tumors analyzed are relatively small; larger patient populations will need to be studied to refine our results.
In conclusion, the accelerated T2 relaxometry can provide an effective approach to speed up T2 quantification with no apparent loss of lesion conspicuity. This method could potentially be incorporated into the standard clinical multiparametric MRI protocols providing a more quantitative approach to improve the detection and staging of prostate cancer.
REFERENCES
- 1.Jemal A, Siegel R, Ward E, Hao Y, Xu J, Thun MJ. Cancer statistics, 2009. 4. Vol. 59. CA: a Cancer Journal for Clinicians; 2009. pp. 225–249. [DOI] [PubMed] [Google Scholar]
- 2.Turkbey B, Albert PS, Kurdziel K, Choyke PL. Imaging localized prostate cancer: current approaches and new developments. Am J Roentgenol. 2009;192(6):1471–1480. doi: 10.2214/AJR.09.2527. [DOI] [PMC free article] [PubMed] [Google Scholar]
- 3.Turkbey B, Pinto PA, Choyke PL. Medscape. Imaging techniques for prostate cancer: implications for focal therapy. Nat Rev Urology. 2009;6(4):191–203. doi: 10.1038/nrurol.2009.27. [DOI] [PMC free article] [PubMed] [Google Scholar]
- 4.Chan I, Wells W, Mulkern RV, Haker S, Zhang J, Zou KH, Maier SE, Tempany CM. Detection of prostate cancer by integration of line-scan diffusion, T2-mapping and T2-weighted magnetic resonance imaging: a multichannel statistical classifier. Med Phys. 2003;30(9):2390–2398. doi: 10.1118/1.1593633. [DOI] [PubMed] [Google Scholar]
- 5.Liney GP, Knowles AJ, Manton DJ, Turnbull LW, Blackband SJ, Horsman A. Comparison of conventional single echo and multi-echo sequences with a fast spin-echo sequence for quantitative T2 mapping: application to the prostate. J Magn Reson Imaging. 1996;6(4):603–607. doi: 10.1002/jmri.1880060408. [DOI] [PubMed] [Google Scholar]
- 6.de Bazelaire CM, Duhamel GD, Rofsky NM, Alsop DC. MR imaging relaxation times of abdominal and pelvic tissues measured in vivo at 3.0 T: preliminary results. Radiology. 2004;230(3):652–659. doi: 10.1148/radiol.2303021331. [DOI] [PubMed] [Google Scholar]
- 7.Gibbs P, Tozer DJ, Liney GP, Turnbull LW. Comparison of quantitative T2 mapping and diffusion-weighted imaging in the normal and pathologic prostate. Magn Reson Med. 2001;46(6):1054–1058. doi: 10.1002/mrm.1298. [DOI] [PubMed] [Google Scholar]
- 8.Liney GP, Lowry M, Turnbull LW, Manton DJ, Knowles AJ, Blackband SJ, Horsman A. Proton MR T2 maps correlate with the citrate concentration in the prostate. NMR Biomed. 1996;9(2):59–64. doi: 10.1002/(SICI)1099-1492(199604)9:2<59::AID-NBM400>3.0.CO;2-2. [DOI] [PubMed] [Google Scholar]
- 9.Liney GP, Turnbull LW, Lowry M, Turnbull LS, Knowles AJ, Horsman A. In vivo quantification of citrate concentration and water T2 relaxation time of the pathologic prostate gland using 1H MRS and MRI. Magn Reson Imaging. 1997;15(10):1177–1186. doi: 10.1016/s0730-725x(97)00182-3. [DOI] [PubMed] [Google Scholar]
- 10.Roebuck JR, Haker SJ, Mitsouras D, Rybicki FJ, Tempany CM, Mulkern RV. Carr-Purcell-Meiboom-Gill imaging of prostate cancer: quantitative T2 values for cancer discrimination. Magn Reson Imaging. 2009;27:497–502. doi: 10.1016/j.mri.2008.08.001. [DOI] [PMC free article] [PubMed] [Google Scholar]
- 11.Sénégas J, Dahnke H. Proc Intl Soc Mag Reson Med 15. Berlin, Germany: ISMRM; 2007. Accelerated R2 mapping through undersampling and k-t reconstruction; p. 1785. [Google Scholar]
- 12.Sénégas J, Liu W, Dahnke H, Song H-T, Jordan EK, Frank JA. Fast T2 relaxometry with an accelerated multi-echo spin-echo sequence. NMR Biomed. 2010 doi: 10.1002/nbm.1521. Epub ahead of print. [DOI] [PubMed] [Google Scholar]
- 13.Singh AK, Kruecker J, Xu S, Glossop N, Guion P, Ullman K, Choyke PL, Wood BJ. Initial clinical experience with real-time transrectal ultrasonography-magnetic resonance imaging fusion-guided prostate biopsy. BJU International. 2008;101(7):841–845. doi: 10.1111/j.1464-410X.2007.07348.x. [DOI] [PMC free article] [PubMed] [Google Scholar]
- 14.Xu S, Kruecker J, Turkbey B, Glossop N, Singh AK, Choyke P, Pinto P, Wood BJ. Real-time MRI-TRUS fusion for guidance of targeted prostate biopsies. Comput Aided Surg. 2008;13(5):255–264. doi: 10.1080/10929080802364645. [DOI] [PMC free article] [PubMed] [Google Scholar]
- 15.Heijmink SW, Futterer JJ, Hambrock T, Takahashi S, Scheenen TW, Huisman HJ, Hulsbergen-Van de Kaa CA, Knipscheer BC, Kiemeney LA, Witjes JA, Barentsz JO. Prostate cancer: body-array versus endorectal coil MR imaging at 3 T--comparison of image quality, localization, and staging performance. Radiology. 2007;244(1):184–195. doi: 10.1148/radiol.2441060425. [DOI] [PubMed] [Google Scholar]
- 16.Turkbey B, Pinto P, Mani H, Bernardo M, Pang Y, Mckinney YL, Khurana K, Ravizzini GC, Albert PS, Merino MJ, Choyke PL. Prostate cancer: value of multiparametric MR imaging at 3 T for detection - histopathologifc correlation. Radiology. 2010;255:89–99. doi: 10.1148/radiol.09090475. [DOI] [PMC free article] [PubMed] [Google Scholar]
- 17.Langer DL, van der Kwast TH, Evans AJ, Trachtenberg J, Wilson BC, Haider MA. Prostate cancer detection with multi-parametric MRI: logistic regression analysis of quantitative T2, diffusion-weighted imaging, and dynamic contrast-enhanced MRI. J Magn Reson Imaging. 2009;30(2):327–334. doi: 10.1002/jmri.21824. [DOI] [PubMed] [Google Scholar]
- 18.Gibbs P, Liney GP, Pickles MD, Zelhof B, Rodrigues G, Turnbull LW. Correlation of ADC and T2 measurements with cell density in prostate cancer at 3.0 Tesla. Invest Radiol. 2009;44(9):572–576. doi: 10.1097/RLI.0b013e3181b4c10e. [DOI] [PubMed] [Google Scholar]
- 19.Turkbey B, Xu S, Kruecker J, Locklin J, Pang Y, Bernardo M, Merino MJ, Wood BJ, Choyke PL, Pinto PA. Documenting the location of prostate biopsies with image fusion. BJU International. 2010 doi: 10.1111/j.1464-410X.2010.09483.x. Epub ahead of print. [DOI] [PMC free article] [PubMed] [Google Scholar]
- 20.Kjaer L, Thomsen C, Iversen P, Henriksen O. In vivo estimation of relaxation processes in benign hyperplasia and carcinoma of prostate gland by magnetic resonance imaging. Magn Reson Imaging. 1986;5:23–30. doi: 10.1016/0730-725x(87)90480-2. [DOI] [PubMed] [Google Scholar]


