Abstract
Multiexponential transverse relaxation in tissue has been interpreted as a marker of water compartmentation. Articular cartilage has been reported to exhibit such relaxation in several studies, with the relative contributions of tissue heterogeneity and tissue microstructure remaining unspecified. In bovine nasal cartilage (BNC), conflicting data regarding the existence of multiexponential relaxation have been reported. Imaging and analysis artifacts as well as rapid chemical exchange between tissue compartments have been identified as potential causes for this discrepancy. Here, we find that disruption of cartilage microstructure by freeze-thawing can greatly alter the character of transverse relaxation in this tissue. We conclude that fresh cartilage exhibits multiexponential relaxation based upon its microstructural water compartments, but that multiexponentiality can be lost or rendered undetectable by freeze-thawing. In addition, we find that increasing chemical exchange by raising sample temperature from 4°C to 37°C does not substantially limit the ability to detect multiexponential relaxation.
Keywords: Multi-component, T2, Bovine nasal cartilage, CPMG, NNLS
Introduction
Quantification of cartilage matrix components with MRI is an active area of investigation, with potential application to the early diagnosis of osteoarthritis and to the assessment of therapeutics for degenerative cartilage disease. Of particular interest is the assessment of proteoglycan (PG) content and distribution; this macromolecule is essential in maintaining hydration and mechanical function of cartilage, and is progressively depleted with cartilage degeneration.
Water compartmentation associated with structural tissue compartments defined through multiexponential T2 analysis has been investigated in a number of tissues, including muscle (1), white matter (2), optic nerve (3), bone (4), and intervertebral disc (5). Consistent with these studies, multiple relaxation components have also been detected systematically in bovine nasal cartilage (BNC) (6), with demonstrated correspondence with macromolecules (7). However, a conflicting interpretation of multiexponential T2 relaxation results in cartilage has recently been put forward; Zheng et al. report only a single relaxation compartment using non-localized T2 relaxation data of BNC (8), and claim that the finding of multiexponential T2 relaxation in BNC is artifactual.
We hypothesize that the discrepancy between our findings, obtained on freshly-harvested samples, and of those of Zheng et al. are due to their study of frozen-thawed samples, This hypothesis is based on the known fact that freezing of cartilage explants has a substantial effect on tissue structure and composition (9,10), although the effect of freezing on water compartmentation as determined by multiexponential T2 analysis has not been previously studied. Further, we expect detected compartment sizes to be altered as a function of temperature due to the temperature dependence of diffusion and exchange effects (11,12).; our data was obtained at 4°C to minimize degradation during data acquisition, while Zheng et al. collected data on samples at room temperature. An example of this effect is seen in Kozlowski et al., who report a reduced MR-derived myelin-bound water fraction (MWF) in both gray and white matter at body temperature as compared to room temperature (13).
Sample freezing is often performed as a matter of convenience, either for storage before MRI studies, or as part of the sample handling for studies involving multiple techniques at different sites. Further, while our previous studies were performed at 4°C, the ultimate objective of the multiexponential approach is to characterize cartilage status in human subjects, at 37°C. Thus, evaluation of the effects of freeze-thawing and sample temperature during data acquisition is of interest independent of the discrepancy between our results (6) and those of Zheng (8).
In this work we evaluate the effects of freeze-thawing and sample temperature on water compartmentation as defined by multiexponential T2 relaxation in BNC. Specifically, we evaluate fresh and freeze-thawed samples at sample temperatures of 4°C, 25°C, and 37°C. Data are acquired using nonlocalized MR measurements in order to minimize the echo time (TE) and increase the signal-to-noise ratio (SNR) as compared to imaging (6), thereby increasing the sensitivity of the experiment to multiple relaxation components. Again, we used BNC as a model system due to its largely isotropic and homogeneous structure (14,15), thereby avoiding the spurious introduction of multiple components reflecting only tissue heterogeneity, rather than compartmentation at the ultrastructural level.
To support our experimental results, extensive non-negative least squares (NNLS) analysis was performed of simulated noisy relaxation data corresponding to our acquisition conditions, since these parameters, SNR, and tissue T2 properties all affect the accuracy of identified T2 components (6,16–18).
Methods
Cartilage Sample Preparation
BNC plugs (3 mm diameter) were removed from the nasal septa of mature cows (Green Village Packing, Green Village, NJ), moistened with Dulbecco’s phosphate buffered saline (DPBS) (Invitrogen, Carlsbad, CA), and stored at 4ºC; all non-cartilage tissues were carefully removed. Samples were randomly divided into a control group (N=4) which was not subject to freezing, and a freeze-thawed group (N=4) that was frozen in DPBS at −20ºC for one week, and then thawed at room temperature prior to data acquisition. Plugs were removed immediately before their respective NMR experiments for control samples or prior to freezing for freeze-thawed samples.
NMR Methods
Relaxation data were acquired with a non-localized Carr-Purcell-Meiboom-Gill (CPMG) pulse sequence with a two step phase cycling scheme 90(x,x)/180(y,-y), 9μs excitation and refocusing pulse lengths, TE/TR = 90μs/10s, 8192 echoes, and number of excitations (NEX) = 64 using a 5mm solenoid coil (m2m Imaging Corp., Cleveland, OH, USA) and a 9.4T Bruker Avance III NMR spectrometer (Bruker, GmbH, Rheinstetten, Germany). Selection of pulse length and echo time were determined experimentally in order to avoid spin-locking effects (19) and excessive probe heating. Prior to experimentation, each sample was gently blotted to remove excess surface water and placed in a 5mm NMR tube containing Fluorinert (Sigma-Aldrich, St. Louis, MO, USA), to maintain sample hydration and eliminate MR signal contamination by bath solution. Sample temperature was controlled by cold air from a vortex tube (Exair, Cincinnati, OH, USA). Measurements were acquired for all samples at 4°C, 25°C, and 37°C.
Fitting of T2 Relaxation Data
The non-negative least squares (NNLS) approach was used for multiexponential T2 analysis as previously described (6); this makes no a priori assumptions about the number of relaxation components present in the signal. Parameters of the procedure included a range of 80 possible T2 values logarithmically spaced over the interval [0.1, 3000] ms, with an optimal regularizer, μ, defined by the condition that chi-squared (χ2) following regularization was 101% of the non-regularized χ2 (18). The first moments and associated fractions for each T2 component were obtained. The PG-bound water compartment (CPG) and bulk water compartment (CLB) have previously been assigned to components with T2 ~30 ms and ~90ms, respectively (7,20). The CPG magnetization fraction, wPG, and T2 relaxation times of both compartments were compared between samples to evaluate the effects of freeze-thawing and sample temperature. Relaxation data were also fit using a nonlinear least squares algorithm in order to obtain conventional monoexponential T2 values (T2,mono) for comparison with multiexponential results. All fitting routines were implemented in MATLAB (MathWorks, Natick, MA).
Simulation of T2 Relaxation Data
Analysis of simulated data was performed to ensure the quality of our results, as described previously (6). Reliability was defined as correctly identifying the number of T2 components in the simulated data, accuracy was defined as the percent error in the derived T2s and weights, and precision was defined as their coefficient of variation (CV). Data were simulated using TE = 90 μs, 8192 echoes, and average experimental values for SNR and the component T2’s and weights. Reliability, accuracy, and precision were evaluated over 100 trials with different noise realizations for each SNR value.
Statistical Analysis
Quantitative comparisons were made using two way repeated measures ANOVA with Holm-Sidak post-hoc analysis, with p<0.05 indicating statistical significance.
Results
Table 1 shows the accuracy and precision of component T2s and fraction weights (w) determined from simulations, using the average SNR from control and treated BNC. The input simulation values for component T2s and weights corresponded to those experimentally derived. While six components were consistently detected experimentally and therefore simulated here, we report values for the two slowly relaxing components. The more rapidly-relaxing of these was assigned to PG-bound water (CPG), while the more slowly relaxing component was assigned to bulk water loosely associated with matrix macromolecules (CLB) (7). Reliability for both control and treated groups was 100%, indicating the consistent ability to resolve these two components in our experiments. T2,PG showed the largest error with accuracies of ~15% and ~19% in control and treated groups, respectively. Component fraction wPG showed smaller errors, of ~9% and ~11% in control and treated groups indicating relatively small systematic errors. The precision of both T2,PG and wPG was within less than 1% in all cases indicating a high degree of reproducibility. These simulations indicate sufficient reliability, accuracy, and precision for resolving PG-bound water and bulk water T2s and component fractions using our acquisition parameters.
Table 1.
Estimated accuracy and precision of T2s and associated weights from multiexponential fits.
| Group | T2,PG | T2,LB | wPG | wLB | |
|---|---|---|---|---|---|
| Fresh | Accuracy | −14.94 | −0.62 | −8.37 | 2.08 |
| Precision | 0.29 | 0.01 | 0.34 | 0.13 | |
| Frozen | Accuracy | −18.26 | −0.31 | −10.42 | 1.15 |
| Precision | 0.41 | 0.01 | 0.33 | 0.13 |
Simulations results for accuracy and precision. Accuracy is defined as average percent error. Precision is reported as the coefficient of variation (CV), defined as the standard deviation over 100 noise realizations divided by the input parameter value × 100. Reliability (not shown), defined as correctly identifying the number of input T2 components, was 100 percent for both young and mature tissue. Reported values are estimated using the average experimental SNRs of 13,249 and 16,301, for fresh and frozen BNC, respectively. In each case, 100 noise realizations using the average T2s and associated weights as input values were simulated. Simulation input values for the PG component, CPG, and the loosely-bound water component, CLB, for fresh and frozen tissue were (T2 ms, % magnetization): fresh CPG = (36.61ms, 6.57%) and CLB = (108.08ms, 83.92%); frozen CPG = (36.31ms, 3.12%) and CLB = (119.31ms, 89.16%).
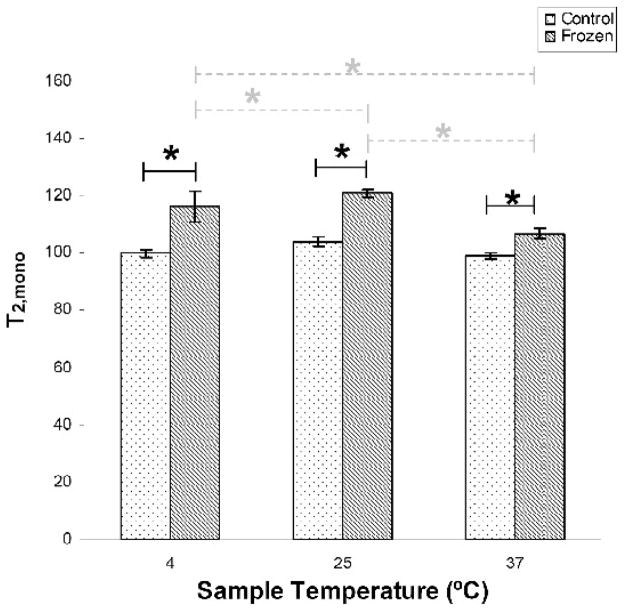
Figure 1 shows that at all three temperatures studied, T2,mono is significantly increased with freeze-thawing. Interestingly, T2,mono was not seen to increase monotonically with temperature, to an extent that was statistically significant in the treated group; it increased from 4ºC to 25ºC and decreased from 25ºC to 37ºC. This is consistent with the qualitative picture presented by Watanabe (21), in which such non-monotonicity is related to chemical exchange.
Figure 1.
Freeze-thawing resulted in significantly increased T2,mono at all three measurement temperatures (solid lines). In addition, samples subjected to freeze-thawing showed significant differences with temperature (dashed lines). * p < 0.05.
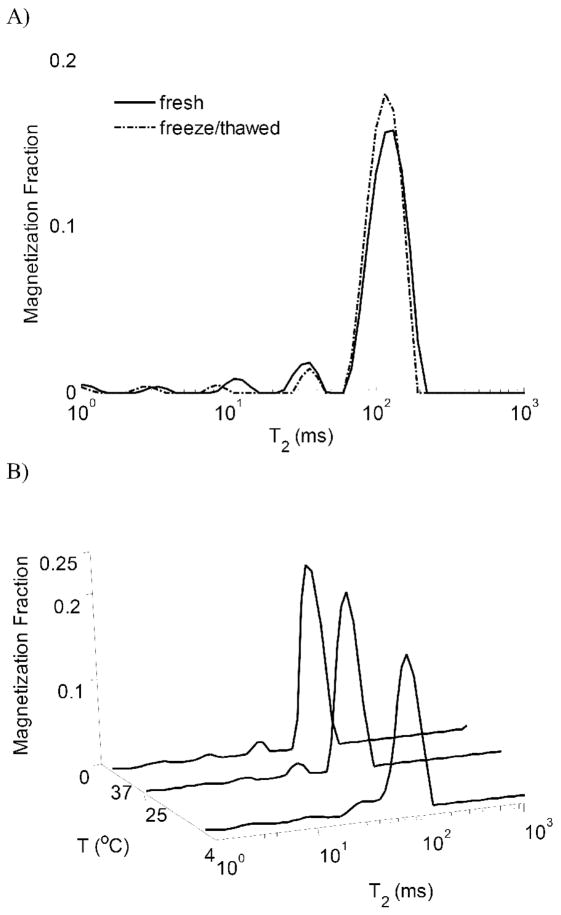
Representative T2 distributions of BNC are shown in Figure 2. CPG was detected in all samples; Figure 3 indicates a significant reduction of wPG due to freeze-thawing at each measurement temperature with the greatest temperature effect seen in the control samples. Within the control samples, wPG significantly decreased with each increase in sample temperature, while freeze-thawed samples showed a significant decrease in wPG only between 4ºC and 37ºC. The attenuated sensitivity to temperature in the freeze-thawed samples is consistent with a decreased exchange between compartments, as could, for example, be due to the development of tissue voids. It should be noted that since component fractions are measured relative to the total water signal, the reduction in wPG is consistent with either a loss of PG or an increase in bulk water, or to a combination of these effects.
Figure 2.
A) Representative T2 distributions obtained at 4°C from BNC before and after freeze-thawing, showing a noticeable decrease in the magnetization fraction of CPG located at ~35ms. B) Representative T2 distributions from fresh BNC obtained at 4°C, 25°C, and 37°C.
Figure 3.
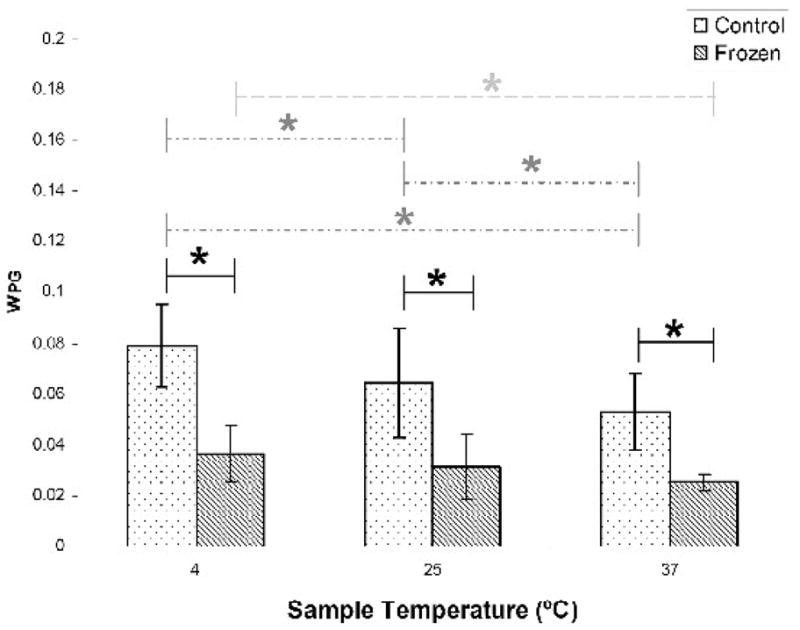
Freeze-thawing resulted in significantly decreased wPG at all three measurement temperatures (solid lines). wPG in control samples significantly decreased with increasing temperature (dotted line). In freeze-thawed samples, wPG was only significantly decreased between 4°C and 37°C (dashed line). * p < 0.05.
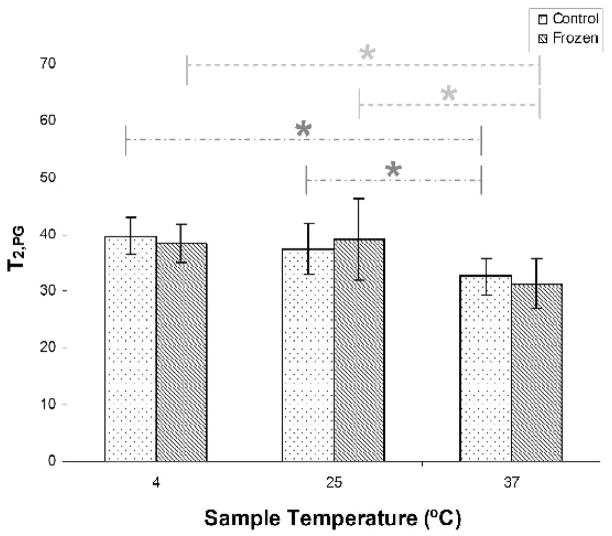
Figure 4 indicates that there is no effect of freeze-thawing on T2,PG. However, T2,PG significantly decreased with increasing temperature between 4ºC and 37ºC and between 25ºC and 37ºC in both sample groups. Similar to T2,mono, the relationship between T2,PG and temperature was non-monotonic in treated samples.
Figure 4.
T2,PG in control samples showed a significant decrease with increasing temperature (dotted lines) between the 4°C and 37°C, and between 25°C and 37°C. Freeze-thawed samples showed the same trends (dashed lines) with temperature. * p < 0.05.
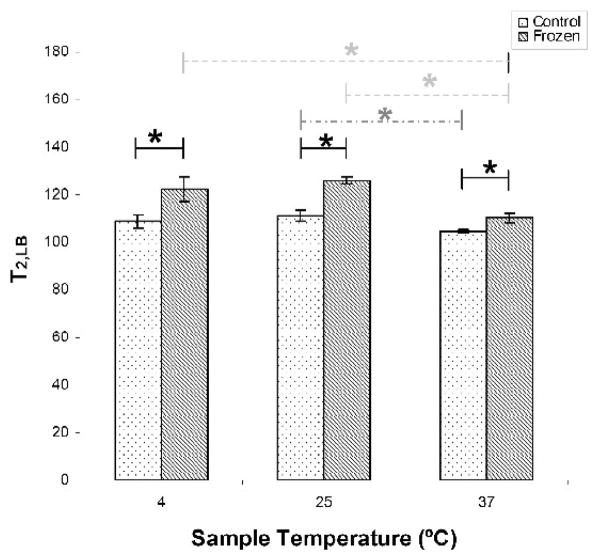
The bulk water component (CLB) was in all cases the largest and most slowly relaxing component in the distribution. As shown in Figure 5, T2,LB increased significantly with freeze-thawing in comparison to fresh samples. T2,LB decreased significantly with a temperature increase from 25ºC to 37ºC for both sample groups, and between 4ºC and 37ºC for freeze-thawed samples. Again, there was a non-monotonic relationship between T2,LB and temperature in both groups.
Figure 5.
Freeze-thawing resulted in significantly increased T2,LB at all three measurement temperatures (solid lines). T2,LB in control samples significantly decreased (dashed line) from 25°C and 37°C. Freeze-thawed samples showed a significant decrease with increasing temperature (dotted lines) between 4°C and 37°C, and between 25°C and 37°C. * p < 0.05.
Discussion
Multiexponential T2 analysis for assessment of compartmentation has been applied extensively in the past, with applications ranging from probing heterogeneity of rock pore sizes (22,23), characterizing meats and food products (24–26), and investigation of normal and diseased tissue (27–29). As a pertinent biological example, a number of studies in neural tissue show a strong relationship between a rapidly relaxing water fraction and myelin content, directly demonstrating the association of a transverse relaxation component with underlying macromolecular composition (2,13).
It is well-established that several factors including SNR, TE and number of acquired echoes, and tissue component T2s and fractions influence the accuracy of component weights and T2s as defined using NNLS (6,16–18). We performed a full set of simulations to validate our experimental results. These simulations indicate sufficient precision under our experimental conditions to detect the reported changes in the magnetization fractions in CPG and CLB, and their corresponding T2s. In particular, the precision of the results, as defined by the coefficient of variation from simulations, was within 1%. This is much smaller than the ~50% difference in wPG seen between control and freeze-thawed BNC and the ~22% decrease seen in this parameter with increasing sample temperature in the control samples.
Considerable care is required to reliably characterize multiexponential decay reflecting co-localized water compartments (8). As is well-recognized, obtaining data on heterogeneous tissue can essentially combine two or more different monoexponential decay curves into one acquired signal. This is a partial volume effect. This is the reason for our focus on BNC in this work; the macromolecular structure of BNC, and hence the corresponding water compartments, are comparable to those in articular cartilage. In the latter, however, multiexponential decay could represent variations in tissue types contributing to the signal rather than different microcompartments. Further, due to the span of T2s of interest in cartilage, data acquisition with non-linearly spaced echoes is an appealing approach. However, it has been reported that this can introduce artifactual multiexponential decay in the presence of rf pulse imperfections (30). We avoided this by use of evenly spaced echoes. Unbound surface water, through condensation or otherwise, on the surface of the sample may introduce or greatly augment the slowly-relaxing water compartment; we immersed our samples in Fluorinert, which avoids this possibility. Important issues relate to the use of imaging, rather than spectroscopic, experiments. Zheng and Xia report the possibility of introducing biexponential decay through use of strong phase-encoding and frequency-encoding gradients (8). In order to avoid this potential effect as well as other complexities, we performed bulk experiments only in the present investigation of the effects of freeze-thawing and sample temperature. In spite of the potential problems with imaging gradients, we note that our present work, using non-localized acquisition, is highly consistent with our ongoing imaging analyses (data not shown). It has also been noted (8) that multiple T2 components in articular cartilage appear to coalesce with orientation of articular cartilage at the magic angle (14). However, it is reported (14) that the more rapidly relaxing component decreased in amplitude, rather than disappearing, at the magic angle. This is consistent with an increase in its T2, as expected from magic-angle orientation, in the presence of exchange between the compartments. The ability to clearly resolve closely-spaced T2 components using NNLS will in any case depend upon the effective TE used, acquisition SNR, and, for NNLS in particular, value of the regularized used and the number of T2 bins. Finally, as noted by Zhang and Xia (8), cartilage is well-known to exhibit at least two water pools. They suggest that rapid exchange may be responsible for the loss of signal components reflecting this. We concur with this, and note that increased intercompartment exchange, in conjunction with matrix disruption and PG loss due to freeze-thawing, may plausibly eliminate or render undetectable separate water compartments (see below).
Frozen Storage
Frozen storage has been shown to damage cartilage matrix due to ice crystal formation. Using scanning electron microscopy, Jomha et al. observed large voids in matrix of freeze-thawed cartilage (31); these were absent in fresh cartilage. It is to be expected that such matrix disruption could alter macromolecular content and water mobility. Consistent with this, Fishbein et al. report an increase in monoexponential T2 with freeze-thawing; this increased with the number of freeze thaw cycles (9). These results are consistent with our observed increase in monoexponential T2 values from 105ms to 121ms resulting from freeze-thawing (Fig 1). Freezing-thawing of cartilage has also been shown to result in a loss of dGEMRIC-derived sulfated glycosaminoglycogen (sGAG) content by as much as 50% (10). These results indicate that the results of multiexponential analysis of cartilage will be significantly affected by freeze-thawing.
We observed multiexponential T2 relaxation in both control and frozen BNC, contrary to the results of Zheng et al. who report only a single T2 component in frozen-thawed BNC (8) using an analysis in which magnetization fractions less than 3% were attributed to the effects of noise and therefore excluded. At a comparable sample temperature of 25°C, our analysis shows a 51% decrease, from 6.5% to 3.2%--just above the cut-off used by Zheng et al.-- in wPG due to freeze-thawing. Indeed, this is consistent with an earlier study by Zheng et al., where they report a reduction in dGEMRIC-derived sGAG content of up to 50% due to freeze-thawing (10). This indicates that the use of fresh samples in our work, and the use of freeze-thawed samples in the work of Zheng et al., can readily account for our finding of multiexponential relaxation behavior and Zheng’s finding of monoexponential behavior.
More generally, our results indicate the sensitivity of the NNLS analysis to matrix alterations induced by freeze-thawing. We found that only the slowly relaxing component, T2,LB, consistently increased with freeze-thawing. This is consistent with the development of enlarged matrix pores secondary to ice damage, resulting in an overall decrease in the dipole-dipole interactions of tissue water with pore boundaries. Similar observations have been reported in gel studies (21).
Sample Temperature
Molecular mobility increases as a function of temperature, leading to a monotonic increase in T2 with temperature in the absence of other effects. Chemical exchange complicates this picture; Watanabe et al have demonstrated a departure from this monotonic relationship as a result of exchange between bound water protons and surface hydration water protons (21). Their results are consistent with our findings in BNC, where we find that T2,PG and T2,LB exhibit a decrease in T2 from 25°C to 37°C. This suggests a significant influence of exchange on these compartments in this temperature range.
The effect of increased exchange on the NNLS-derived water fractions from a two pool system has been modeled by Dula et al. Their simulations demonstrate a decrease in the apparent pool size of the rapidly relaxing component with increased exchange (12). In terms of this analysis, the decrease we observed in wPG with increasing temperature is consistent with increased exchange between the compartments CPG and CLB.
In conclusion, multiexponential transverse relaxation, corresponding to water compartmentation is expected in cartilage, given its known macromolecular composition (6,7). Similar results have been seen in a variety of other tissues (1–5). We find that these water compartments are affected by both frozen storage and sample temperature. This dependence is manifest by alterations in the detected amplitudes and T2s of water fractions defined by multiexponential analysis. The PG-associated magnetization fraction wPG is decreased greatly by sample freezing, to the extent that it can fall below the level of detection (8), and decreases modestly with increased sample temperature. Further, as sample temperature increases, changes in the relaxation times T2,PG and T2,LB indicate increased intercompartment exchange. The consistent detection of multiexponential relaxation in cartilage that has not been frozen and thawed indicates the potential for this technique to be applied in human studies.
Footnotes
Publisher's Disclaimer: This is a PDF file of an unedited manuscript that has been accepted for publication. As a service to our customers we are providing this early version of the manuscript. The manuscript will undergo copyediting, typesetting, and review of the resulting proof before it is published in its final citable form. Please note that during the production process errors may be discovered which could affect the content, and all legal disclaimers that apply to the journal pertain.
References
- 1.Saab G, Thompson RT, Marsh GD. Multicomponent T2 relaxation of in vivo skeletal muscle. Magnetic Resonance in Medicine. 1999;42(1):150–157. doi: 10.1002/(sici)1522-2594(199907)42:1<150::aid-mrm20>3.0.co;2-5. [DOI] [PubMed] [Google Scholar]
- 2.Laule C, Leung E, Li DKB, Troboulsee AL, Paty DW, MacKay AL, Moore GRW. Myelin water imaging in multiple sclerosis: quantitative correlations with histopathology. Multiple Sclerosis. 2006;12(6):747–753. doi: 10.1177/1352458506070928. [DOI] [PubMed] [Google Scholar]
- 3.Peled S, Cory DG, Raymond SA, Kirschner DA, Jolesz FA. Water diffusion, T2, and compartmentation in frog sciatic nerve. Magnetic Resonance in Medicine. 1999;42(5):911–918. doi: 10.1002/(sici)1522-2594(199911)42:5<911::aid-mrm11>3.0.co;2-j. [DOI] [PMC free article] [PubMed] [Google Scholar]
- 4.Horch RA, Nyman JS, Gochberg DF, Does MD. Correlation of 1H NMR characteristics and mechanical properties in human cortical bone. Proceedings of the 18th Annual Meeting of the ISMRM; Stockholm, Sweden. 2010. p. 541. [Google Scholar]
- 5.Nightingale T, MacKay A, Pearce RH, Whittall KP, Flak B. A model of unloaded human intervertebral disk based on NMR relaxation. Magnetic Resonance in Medicine. 2000;43(1):34–44. doi: 10.1002/(sici)1522-2594(200001)43:1<34::aid-mrm5>3.0.co;2-7. [DOI] [PubMed] [Google Scholar]
- 6.Reiter DA, Lin PC, Fishbein KW, Spencer RG. Multicomponent T2 relaxation analysis in cartilage. Magnetic Resonance in Medicine. 2009;61(4):803–809. doi: 10.1002/mrm.21926. [DOI] [PMC free article] [PubMed] [Google Scholar]
- 7.Reiter DA, Roque RA, Lin PC, Irrechukwu O, Pleshko N, Spencer RG. Improved specificity of cartilage matrix assessment using multiexponential T2 parameter maps with validation by Fourier-transform infrared spectroscopic imaging. Proceedings of the 17th Annual Meeting of the ISMRM; Honolulu, Hawai. 2009. p. 72. [Google Scholar]
- 8.Zheng SK, Xia Y. On the measurement of multi-component T2 relaxation in cartilage by MR spectroscopy and imaging. Magnetic Resonance Imaging. 2010;28(4):537–545. doi: 10.1016/j.mri.2009.12.006. [DOI] [PMC free article] [PubMed] [Google Scholar]
- 9.Fishbein KW, Canuto HC, Bajaj P, Camacho NP, Spencer RG. Optimal methods for the preservation of cartilage samples in MRI and correlative biochemical studies. Magnetic Resonance In Medicine. 2007;57(5):866–873. doi: 10.1002/mrm.21189. [DOI] [PubMed] [Google Scholar]
- 10.Zheng SK, Xia Y, Bidthanapally A, Badar F, Ilsar I, Duvoisin N. Damages to the extracellular matrix in articular cartilage due to cryopreservation by microscopic magnetic resonance imaging and biochemistry. Magnetic Resonance Imaging. 2009;27(5):648–655. doi: 10.1016/j.mri.2008.10.003. [DOI] [PMC free article] [PubMed] [Google Scholar]
- 11.Bjarnason TA, Vavasour IM, Chia CLL, MacKay AL. Characterization of the NMR behavior of white matter in bovine brain. Magnetic Resonance in Medicine. 2005;54(5):1072–1081. doi: 10.1002/mrm.20680. [DOI] [PubMed] [Google Scholar]
- 12.Dula AN, Gochberg DF, Valentine HL, Valentine WM, Does MD. Multiexponential T2, magnetization transfer, and quantitative histology in white matter tracts of rat spinal cord. Magnetic Resonance in Medicine. 2010;63(4):902–909. doi: 10.1002/mrm.22267. [DOI] [PMC free article] [PubMed] [Google Scholar]
- 13.Kozlowski P, Liu J, Yung AC, Tetzlaff W. High-resolution myelin water measurements in rat spinal cord. Magnetic Resonance in Medicine. 2008;59(4):796–802. doi: 10.1002/mrm.21527. [DOI] [PubMed] [Google Scholar]
- 14.Henkelman RM, Stanisz GJ, Kim JK, Bronskill MJ. Anisotropy of NMR properties of tissues. Magnetic Resonance in Medicine. 1994;32(5):592–601. doi: 10.1002/mrm.1910320508. [DOI] [PubMed] [Google Scholar]
- 15.Mosher TJ, Dardzinski BJ, Smith MB. Characterization of multiple T2 components in articular cartilage. Proceedings of the 5th Annual Meeting of the ISMRM; Vancouver, BC, Canada. 1997. p. 1331. [Google Scholar]
- 16.Anastasiou A, Hall LD. Optimisation of T2 and M0 measurements of bi-exponential systems. Magnetic Resonance Imaging. 2004;22(1):67–80. doi: 10.1016/j.mri.2003.05.005. [DOI] [PubMed] [Google Scholar]
- 17.Dula AN, Gochberg DF, Does MD. Optimal echo spacing for multi-echo imaging measurements of bi-exponential T2 relaxation. Journal of Magnetic Resonance. 2009;196(2):149–156. doi: 10.1016/j.jmr.2008.11.002. [DOI] [PMC free article] [PubMed] [Google Scholar]
- 18.Graham SJ, Stanchev PL, Bronskill MJ. Criteria for analysis of multicomponent tissue T2 relaxation data. Magnetic Resonance in Medicine. 1996;35(3):370–378. doi: 10.1002/mrm.1910350315. [DOI] [PubMed] [Google Scholar]
- 19.Santyr GE, Henkelman RM, Bronskill MJ. Variation in measured transverse relaxation in tissue resulting from spin locking with the CPMG sequence. Journal of Magnetic Resonance (1969) 1988;79(1):28. [Google Scholar]
- 20.Ghiassi-Nejad M, Torzilli PA, Peemoeller H, Pintar MM. Proton spin-spin relaxation study of molecular dynamics and proteoglycan hydration in articular cartilage. Biomaterials. 2000;21(20):2089–2095. doi: 10.1016/s0142-9612(00)00140-x. [DOI] [PubMed] [Google Scholar]
- 21.Watanabe T, Murase N, Staemmler M, Gersonde K. Multiexponential Proton Relaxation Processes of Compartmentalized Water in Gels. Magnetic Resonance in Medicine. 1992;27(1):118–134. doi: 10.1002/mrm.1910270112. [DOI] [PubMed] [Google Scholar]
- 22.Pomerantz AE, Sigmund EE, Song YQ. Spatial heterogeneity length scales in carbonate rocks. Applied Magnetic Resonance. 2007;32(1–2):221–231. [Google Scholar]
- 23.Song YQ, Cho H, Hopper T, Pomerantz AE, Sun PZ. Magnetic resonance in porous media: Recent progress. Journal Of Chemical Physics. 2008;128(5) doi: 10.1063/1.2833581. [DOI] [PubMed] [Google Scholar]
- 24.Marigheto N, Duarte S, Hills BP. NMR relaxation study of avocado quality. Applied Magnetic Resonance. 2005;29(4):687–701. [Google Scholar]
- 25.Wu ZY, Bertram HC, Bocker U, Ofstad R, Kohler A. Myowater dynamics and protein secondary structural changes as affected by heating rate in three pork qualities: A combined FT-IR microspectroscopic and H-1 NMR relaxometry study. Journal Of Agricultural And Food Chemistry. 2007;55(10):3990–3997. doi: 10.1021/jf070019m. [DOI] [PubMed] [Google Scholar]
- 26.Wu ZY, Bertram HC, Kohler A, Bocker U, Ofstad R, Andersen HJ. Influence of aging and salting on protein secondary structures and water distribution in uncooked and cooked pork. A combined FT-IR microspectroscopy and H-1 NMR relaxometry study. Journal Of Agricultural And Food Chemistry. 2006;54(22):8589–8597. doi: 10.1021/jf061576w. [DOI] [PubMed] [Google Scholar]
- 27.Ababneh Z, Beloeil H, Berde CB, Gambarota G, Maier SE, Mulkern RV. Biexponential parameterization of diffusion and T2 relaxation decay curves in a rat muscle edema model: Decay curve components and water compartments. Magnetic Resonance in Medicine. 2005;54(3):524–531. doi: 10.1002/mrm.20610. [DOI] [PubMed] [Google Scholar]
- 28.Graham SJ, Ness S, Hamilton BS, Bronskill MJ. Magnetic resonance properties of ex vivo breast tissue at 1.5 T. Magnetic Resonance in Medicine. 1997;38(4):669–677. doi: 10.1002/mrm.1910380422. [DOI] [PubMed] [Google Scholar]
- 29.MacKay A, Whittall K, Adler J, Li D, Paty D, Graeb D. In-vivo visualization of myelin water in brain by magnetic-resonance. Magnetic Resonance in Medicine. 1994;31(6):673–677. doi: 10.1002/mrm.1910310614. [DOI] [PubMed] [Google Scholar]
- 30.Does MD, Gore JC. Complications of nonlinear echo time spacing for measurement of T2. NMR in Biomedicine. 2000;13(1):1–7. doi: 10.1002/(sici)1099-1492(200002)13:1<1::aid-nbm603>3.0.co;2-e. [DOI] [PubMed] [Google Scholar]
- 31.Jomha NM, Anoop PC, McGann LE. Intramatrix events during cryopreservation of porcine articular cartilage using rapid cooling. Journal Of Orthopaedic Research. 2004;22(1):152–157. doi: 10.1016/S0736-0266(03)00158-X. [DOI] [PubMed] [Google Scholar]


