

Abstract
Signaling cascades are initiated in the plasma membrane via activation of one molecule by another. The interaction depends on the mutual availability of the molecules to each other and this is determined by their localization and lateral diffusion in the cell membrane. The cytoskeleton plays a very important role in this process by enhancing or restricting the possibility of the signaling partners to meet in the plasma membrane. In this study we explored the mode of diffusion of the cAMP receptor, cAR1, in the plasma membrane of Dictyostelium discoideum cells and how this is regulated by the cytoskeleton. Single-particle tracking of fluorescently labeled cAR1 using total internal reflection microscopy showed that 70% of the cAR1 molecules were mobile. These receptors showed directed motion and we demonstrate that this is not because of tracking along the actin cytoskeleton. Instead, destabilization of the microtubules abolished cAR1 mobility in the plasma membrane and this was confirmed by fluorescence recovery after photobleaching. As a result of microtubule stabilization, one of the first downstream signaling events, the jump of the PH domain of CRAC, was decreased. These results suggest a role for microtubules in cAR1 dynamics and in the ability of cAR1 molecules to interact with their signaling partners.
Keywords: Single-molecule TIRF microscopy, G-protein coupled receptor, directed diffusion, microtubules, actin, FRAP
1. Introduction
The ability of cells to communicate with and respond to their external environment is critical for their survival. In the majority of signaling events G protein-coupled receptors (GPCRs) are crucial intermediates in the transmission of extracellular information into intracellular responses [1]. Unraveling the mechanism of GPCR dynamics may lead to novel therapeutic approaches for treating diseases since GPCRs are tractable drug targets. The paradigm is that stimulation of GPCRs leads to the recruitment and activation of heterotrimeric G-proteins [2], although studies show that GPCRs can also signal in a G-protein independent manner [3–5]. Initial events, fundamental to all types of GPCR signaling, occur at the plasma membrane via protein-protein interactions. Therefore, in addition to acting as a selective barrier, the plasma membrane serves as a platform for initiating and regulating signaling pathways. It is believed that the effectiveness of the signaling cascade depends on the organization and lateral mobility of the signaling components within the plasma membrane [6–10]. The efficiency depends on the probability of interaction between the GPCR and its effectors and this is controlled by the localization and mobility of GPCRs in the plasma membrane. Such a mechanism allows for the spatiotemporal fine-tuning of a cells response to extracellular signals.
Chemotaxis, the directed cell migration towards a chemotactic source, is beautifully displayed in the developmental program of the social amoebae Dictyostelium discoideum. The cyclic adenosine monophosphate, cAMP, was identified as the chemoattractant that controls the aggregation [11]. The cAMP receptors, cAR1-4, are G-protein coupled receptors (GPCRs) that are functionally related to chemokine receptors mediating chemotactic responses of neutrophils, macrophages and lymphocytes. Upon binding of cAMP, the associated G-proteins on the cytosolic side of the membrane are activated and undergo agonist-induced serine phosphorylation [12]. Binding of cAMP to cAR1 leads to activation of second messenger pathways, including the activation of adenylyl cyclase, guanylyl cyclase, phospholipase C, phosphoinositide 3-kinase and PTEN phosphatase [13]. These activations are locally and temporally restricted along the plasma membrane creating a leading and trailing edge of the moving cell. Chemotaxis is a highly self-regulated process and recent evidence suggests that the organization of cAR1 in the plasma membrane plays an important role.
Single-particle tracking is a powerful method to characterize molecular movements by tracking fluorescent molecules in the plasma membrane. Previous single-molecule studies showed that the mobility of cAR1 [14] and the association/dissociation kinetics of cAMP [15] differed between the leading and the trailing edges of chemotaxing Dictyostelium cells. Here we use single-molecule Total Internal Reflection Fluorescence Microscopy (TIRFM) to investigate the modes of motion of cAR1. We demonstrate the existence of two types of receptors, a mobile and immobile receptor as previously seen [14]. We take advantage of a labeling technique that allows for long-term imaging of the receptors to reveal that the mobile receptors do not move randomly in the plasma membrane but rather follow so-called directed diffusion suggesting that the receptor is moving along a structure. As the actin cytoskeleton and the microtubules help regulate the topography of the plasma membrane in eukaryotic cells [16], we also investigated the effect of cytoskeleton destabilization on the dynamic behavior of cAR1. We show that, although the actin cytoskeleton has an inhibiting effect on the rate of cAR1 diffusion, the microtubule network is responsible for the directionality in the mobility. Microtubule destabilization completely abolishes cAR1 mobility in the membrane and furthermore disrupts downstream signaling. We interpret our results based on the current understanding of actin and microtubule-dependent lateral dynamics of membrane proteins and receptor-effector interactions and hypothesize that microtubules regulate the nano-environment of cAR1 in the plasma membrane. This controls the effectiveness of activated cAR1 to interact with downstream signaling partners in the plasma membrane and may provide a mechanism for spatiotemporal signaling of cAR1 important for chemotaxis.
2. Materials and methods
2.1 Cell preparation
The gene encoding full length HaloTag™ protein was fused to the COOH-terminal of cAR1 by fusion PCR technique from the HaloTag® pHT2 vector (Promega) and pEX-GFP vector. This cAR1-Halo fusion sequence was then released by BglII-NotI digestion and cloned into the BglII-NotI site of pJK1, a D. discoideum extra-chromosomal expresion vector [17]. DNA was purified and transformed into JB4 cells (car1–/car3– cells), and these cells served to test the functionality of the cAR1-Halo fusion protein. Wild type cells (AX2, kindly provided by R. Kay) were transformed with the vectors and G418-resistant clones (20 μg/ml in HL5) were selected. PH-GFP (Pleckstrin Homolgy domain of CRAC, cytosolic regulator of adenylate cyclase) and γ-Tubulin-GFP were transformed in AX2 cells. All cell lines were grown and starved at 2×10⁷ cells/ml for 6 hours by shaking in DB buffer and transferred to either 2-well chambered cover-glasses (1.5 Borosilicate Sterile, Lab Tek II) or conventional coverglasses. The cells were measured in phosphate buffer.
2.2 Labeling of cells and drug addition
For single molecule observations the cells were treated with 0.01 μM HaloTag™ TMR (tetramethylrhodamine) ligand (Promega, USA) for 15 min to label the HaloTag™ protein (Promega, USA) covalently. Unbound ligands were washed out by centrifugation before observation. Non-specific labelling was tested on wild-type cells and did not occur. Cells were allowed to adhere for 15 min. to base-cleaned 2-well chambered cover-glasses (1.5 Borosilicate Sterile, Lab Tek II). For FRAP experiments Ax2 cells were transferred to coverglass and incubated with 5μg/μl FM4-64 (Invitrogen) for 15 min. After incubation the dye was washed away and the cells immediately imaged for no longer than 30 min. The cAR1-YFP/Ax2 cells for the FRAP experiments were from a stable cell line and also transferred to coverglass after starvation. Both Latrunculin A (5 μM) and Benomyl (10–100μM) was added to the cells and the cells were imaged after 10–15 min after addition without washing away the drugs. The drugs were diluted in DMSO so that the final DMSO concentration during the measurements was <1%.
2.3 Confocal microscopy and FRAP
Confocal imaging and Fluorescence Recovery after Photobleaching was performed on a SP5 (Leica, Germany) with a 63x, 1.45NA oil objective. GFP, YFP and FM 4-64 fluorescence was excited at 488, 514 and 565 nm respectively, while the emission was collected with photomultiplier tubes after spreading by a prism and the bandwidth adjusted through mirrors. FRAP experiments were performed using a 1μm diameter circular region of interest in the basal plane of the plasma membrane. Photobleaching was performed operating at 100% of laser power by scanning the bleached ROI for 10 iterations, yielding a total bleach time of 0.5s. Recoveries were collected with time intervals adjusted to the mobility of the probe looked at. This was 5 intervals of 150ms followed by 10 of 1 s and 10 of 5s for cAR1-YFP and 20 intervals of 100ms followed by 10 intervals of 500ms for FM4-46. Fluorescence intensity data for the bleached ROI were calculated using Leica software. The fluorescence timeseries were exported to ascii files and transferred to Origin. After background correction and normalization to t0 using a method that is known as double normalization [18], the single data files (approximately 20 curves for each condition) were averaged to create a single curve. The data were compared using the Two-sample Kolmogorov-Smirnov test function in Matlab (The Mathworks, USA).
2.4 Single molecule microscopy
An agar-overlay [19] was used to provide for an optimal cell-to-glass contact, necessary for TIRF. Thin agar sheets were mounted on top of the cells before measuring. The cells were illuminated continuously at 568 nm by an Ar-Kr laser. A system using an acousto-optic tunable filter (AOTF) (Prairie technologies, USA) controlled with Metamorph (Molecular Devices, USA) provided exact values for the intensity and wavelength. Single molecules were visualized using an objective type total internal reflection microscope (IX 71, Olympus, USA) with a 100x objective (PlanApo 100x NA 1.45, Olympus, USA). Fluorescence signals from TMR were monitored through a dichroic mirror in combination with a band-pass (for 568nm, Chroma Technologies) by a CCD camera at 30-msec intervals (Cascade 512B, Photometrics, USA). Typically 500 readouts of a small region of the full array (typically 100×100 pixels, i.e.16 × 16 μm2 in the image plane, of a total 512 × 512 pixels) of the CCD chip was acquired to the PC.
2.5 Data analysis
The data was analyzed following a method as described in [20]. In brief, the intensity profiles of the TMR signals were fitted to two-dimensional Gaussian profiles yielding the fluorescence intensity with an uncertainty of <20% and the position with an accuracy of 25 nm [20]. The signals were validated as individual emitting TMR molecules by observing the intensity in time and determine single-step photobleaching events. Trajectories were constructed from the positional shifts of molecules in consecutive images. The lateral diffusion of Brownian particles in a medium characterized by a diffusion constant D is described by the cumulative probability distribution function for the square displacements, r2 [21,22]:
| Eq.1 |
P(r2, tlag) describes the probability that the Brownian particle starting at the origin will be found within a circle of radius r at time tlag. This mono-exponential fit did not accurately describe the data obtained for cAR1-Halo-TMR and from the trajectories it was already seen that there were two populations of receptors with different type of trajectories. Provided that the system under study segregates into two components Eq. 1 becomes [21]:
| Eq.2 |
Describing the data with this bi-exponential fit results in two receptor populations with each their mean square displacements (MSDi = r12 and r22) and the size of the relative fractions, α and (1 − α) respectively. The cumulative probability distributions P(ri2, tlag) were constructed for each time lag from the single-molecule trajectories, obtained from 30–40 different cells (for each cell line and condition), by counting the number of square displacements with values ≤r2, and subsequent normalization by the total number of data points [21]. Probability distributions with N > 10000 data points were least-square fit to Eq. 2, resulting in a parameter set {r12(tlag), r22 (tlag),α), for each time lag, tlag, between 0.030 and 1.5 s. The data for different tlags were constructed from the same dataset taken with tlag=30 ms by taking the 1-step (tlag=30 ms), 2-step (tlag=60 ms) up to the n-step (tlag=n*30 ms) displacements. This approach of fitting leads to a robust estimation of the mean-square displacements ri2 even when the mobility is not purely random [23]. The cumulative probability distributions P(ri2, tlag) were compared between the different conditions using the Two-sample Kolmogorov-Smirnov test function in Matlab (The Mathworks, USA).
2.6 Mobility analysis
The mode of diffusion and the diffusion coefficient of the respective populations of molecules were determined by fitting the Mean Square Displacement (ri 2) versus tlag plots with different models for diffusion. To analyze the mode of diffusion, long trajectories are necessary and therefore only trajectories longer than 50 images were selected. For the analysis of the (ri 2, tlag) plots, it has to be taken into account that the positional accuracy σ in our measurements is 25 nm, which leads to a constant offset in ri 2 of 4×(0.025 μm)2 = 0.0025 μm2 for all time lags. The (ri 2, tlag) plots were fitted by a free diffusion model,
| Eq.3 |
a model describing diffusion with a flow of constant velocity v [24],
| Eq.4 |
and a model describing confined diffusion [25],
| Eq.5 |
where Dinit is the initial diffusion coefficient for small time-lags and L represents the side-length of a square domain.
3. Results
3.1 Imaging single cAR1 receptors
To study diffusion of cAR1, long-term (~ seconds) tracking of the receptors in the plasma membrane is required. Commonly used green fluorescent protein mutants, like eYFP, bleach rapidly resulting in short trajectories even with TIRFM. HaloTag™ technology provides a labeling technique that allows for longer imaging at the single molecule level (Materials and Methods). A second advantage of the HaloTag technique was that by controlling the concentration of the Halo-TMR ligand the number of fluorescently-tagged receptors can be regulated. This means that only a few, well separated, molecules were fluorescent and their location could be pinpointed by calculating the center of the observed Gaussian point-spread function. Labeling wild-type cells lacking the fusion protein with the Halo-TMR ligand showed no apparent background labeling (data not shown). Together with the use of TIRFM which decreases the background fluorescence significantly by only imaging molecules close to the glass surface, a good signal-to-noise-ration was obtained. This labeling technique made it possible to visualize single receptor molecules in the basal membrane of living Dictyostelium discoideum cells (Fig. 1A, B Supplemental movie M1) with a positional accuracy of 25 nm and a temporal resolution of 30 ms for a few (5–10) seconds. Single-molecule imaging was confirmed by observation of single-step photobleaching of TMR-labeled cAR1 (Figure S1). The fusion protein labeled or unlabeled with Halo-TMR, rescued the developmental defect of car1− cells and was thus shown to be functional (data not shown).
Figure 1. Analysis of cAR1 mobility.
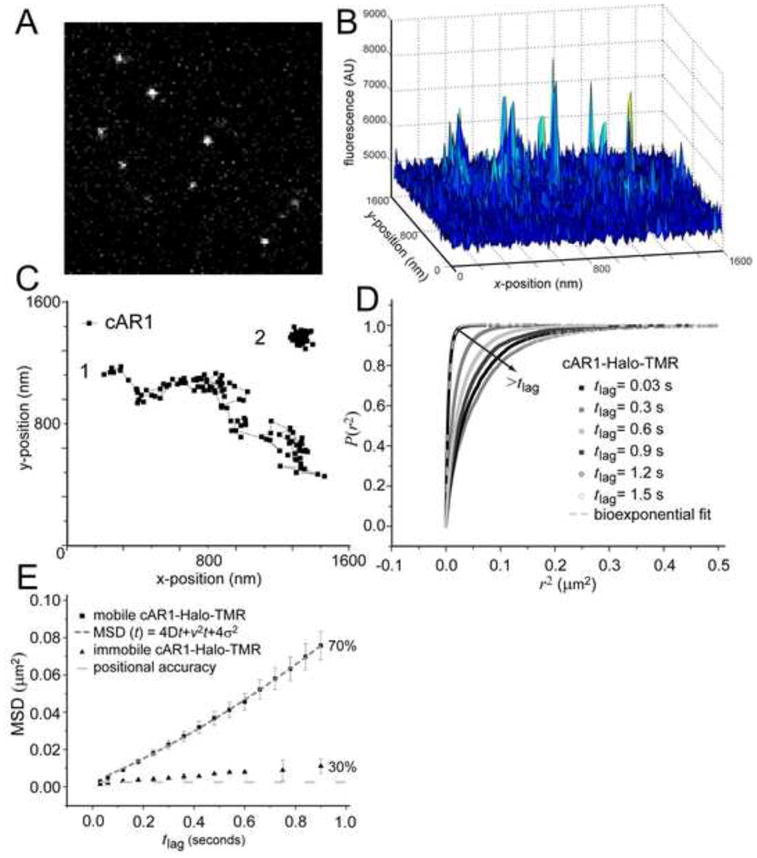
(A) Image from a stack (movie M1, see supplemental material) showing signals form single cAR1-Halo-TMR molecules in the basal membrane of live Dictyostelium cells as imaged with Total Internal Reflection Fluorescence Microscopy (n=19 cells). (B) The 3D graph of the intensities of the single molecules. (C) Representive trajectories of two different dynamic behaviors, mobile (1) and immobile (2), of cAR1. (D) Cumulative probability distributions (P(r2)) of the square displacements (r2) of cAR1-Halo-TMR at different tlag. The PSD were described with a biexponential fit (dashed curve) giving two Mean Square Displacements (ri2(t)) and the fraction size (α) at each tlag. (E) MSD data of single cAR1 molecules versus tlag. The cAR1-Halo-TMR data for the immobile fraction (30% of the molecules) was close to the error in positional accuracy (light grey dashed line) 4σ2= 0.0025 μm2. The mobile fraction (n=59 trajectories) was described by a model describing diffusion with flow (grey dashed line). The fitting results were D=0.015 ± 0.002μm2/s and velocity of v= 0.16 ± 0.02 μm/s.
3.2 cAR1 displays directed motion in the plasma membrane
The cAR1-HaloTag-TMR molecules were tracked in the basal plasma membrane of wild-type Dictyostelium cells. To increase the cell-to-glass surface of the cells, a thin agar sheet was mounted on top of the cells, which flattened the cells and reduced cell motility. Control experiments with cells which were not flattened showed that flattening with agar-overlay had no effect on cAR1 mobility.
Movies were acquired with a 30 ms time sample. In each image from the movie, automated analysis yielded values for the integrated fluorescence signal and the lateral position of the receptors (with high accuracy ~ 25 nm) [26] (Fig, 1A, supplemental movie M1). Trajectories were constructed from the positional shifts of the molecules in consecutive images. These trajectories showed two different types of diffusion: molecules that were moving away from their point of origin and molecules that appear immobile (Fig. 1B). The trajectories were analysed by plotting the cumulative probability (P) of the square displacements (r2, see Methods) [21] in different time lags (Fig 1C). This was fitted to a two-component model (Fig. S2), reflecting two receptor fractions [21] confirming the observation of two types of trajectories. Equation 2 leads to two fractions (with size α=70% and 1−α=30%) each with a characteristic mean squared displacement, MSDi.
The mobility can be further characterized by plotting the MSD against the respective time lags between points (Fig. 1D) and fitting them to different models for diffusion. These models: free Brownian diffusion, directed flow, transient confinement in dynamic microdomains, immobile obstacles and hop diffusion across membrane picket fences [27] correspond to different microscopic organizations of the plasma membrane and the respective effect on the mobility of membrane proteins. In analyzing the MSD plots, the positional accuracy in our measurements, σ=25 nm was taken into account, leading to a constant offset in MSD of 4×(0.025μm)2 = 0.0025μm2. Thirty percent of the receptors were considered immobile in these experiments, since the MSD was close to the positional accuracy (Fig. 1D, black circles). However, on longer timescales the MSD started to deviate from the positional accuracy. This could be attributed to vibrations in the set-up, but it is also possible that this population is moving very slowly. Fitting the data with a model for free diffusion resulted in a diffusion coefficient D=0.0024 ± 0.0005 μm2/s (Fig. S3, red dotted line). However, fitting the result with the model for confined diffusion gave an equally good fit (Fig. S3, blue dotted line), suggesting that 30% of cAR1 molecules diffuse freely with D=0.0026 ± 0.0005 μm2/s in an area with size L=0.46 ± 0.1 μm. Determining which model is more appropriate would require the ability to measure the MSD on timescales much smaller than 30 ms which was not possible in our setup.
The majority of cAR1 receptors (70%) displayed dynamic movement in the plasma membrane. Despite that an agar overlay was used, there were still small plasma membrane movements resulting in molecules moving in and out of focus. These molecules were not picked up in every image of an image stack resulting in truncated trajectories. To circumvent this problem we selected for long traces (n=59) and analyzed these. The plot of this fraction showed a quadratic shape (Fig. 1D, black squares) and could not be described with the model for free diffusion (Fig. S4). Instead we used a model describing diffusion with a drift or flow with constant velocity, v [24], MSD= Dtlag+v2 tlag2+4σ2 (Equation 4). Describing the data with this model indicated that the receptor motion consisted of Brownian motion with coefficient D=0.015 ± 0.002 μm2/s associated with directed movement with velocity v= 0.16 ± 0.01 μm/s (Fig. 1D). The receptors did not change their dynamics upon global cAMP stimulation, they maintained their directed diffusion with only a slight increase in mobility (Fig. S5). Taken together, these data demonstrate that cAR1s movement is not solely random but that it also reflects directed motion, presumably alongside a structure underlying the cell membrane.
3.3 Actin cytoskeleton increases cAR1 mobility
Having observed directed motion in the plasma membrane displacement of cAR1, we next sought to determine whether this is a result of tracking along cytoskeletal components. We first disrupted the actin cytoskeleton using Latrunculin A [28]. Analysis of the cAR1 trajectories showed that the ratio of mobile and immobile receptors was not altered in latrunculin-treated cells: 70% of the receptors were mobile on the timescale measured. Though individual trajectories looked similar (Fig. 2A), the cumulative probability distributions of cAR1-Halo-TMR square displacements (Fig. S6) were significantly different in control cells when compared to Latrunculin A-treated cells, using a two sample Kolmogorov-Smirnov test for all timelags with an acceptance level of 95% (p<10−5). Describing the MSD data with the model for random diffusion associated with directed movement gave a diffusion coefficient of cAR1 in Latrunculin A-treated cells of D=0.017 ± 0.002 μm2/s and a velocity v= 0.28 ± 0.03 μm/s (Fig. 2B). Thus, inhibiting actin polymerization increased the speed of motion, but the movement of the molecules still showed a directional bias. These data demonstrated that the actin cytoskeleton network was not responsible for the directed movement seen in cAR1. Moreover, this result also proved that the observed directed movement was not a consequence of migration of the cell since disruption of the actin cytoskeleton inhibits cell movement.
Figure 2. Disruption of actin cytoskeleton increases cAR1 mobility.
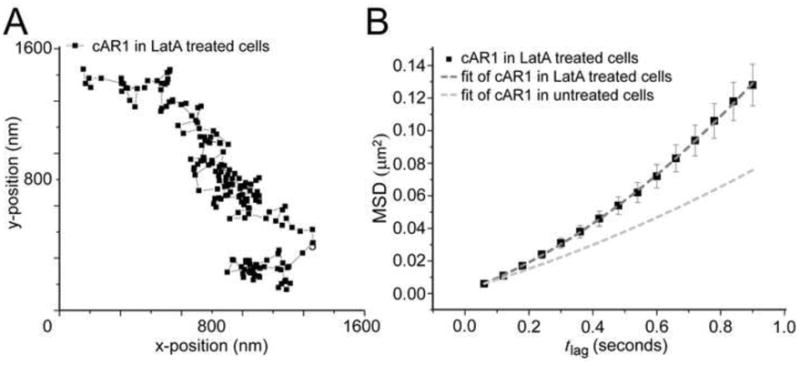
(A) Trajectory of a cAR1 molecule after 10 min incubation with 5 μM Latrunculin (n=20 cells). (B) After Latrunculin treatment there were two populations of cAR1 molecules and the fraction sizes were not changed, 30% immobile and 70% mobile. The mobile population still showed directed movement, but the speed of movement was increased D=0.017 ± 0.002μm2/s and a velocity of v= 0.28 ± 0.03 μm/s (n=21 trajectories)
3.4 cAR1 immobilizes upon microtubules decomposition
We next investigated the role that the microtubule network may have on cAR1 motility. Microtubules have previously been shown to influence mobility of plasma membrane-localized proteins [8,9,29,30]. We depolymerized the microtubules with benomyl (also called benlate), which is a benzimidazole derivative, like nocodazole, thiabendazole and cambendazole and its effects on Dictyostelium discoideum were characterized as less severe than other drugs [31]. Brief treatment with 50 μM of benomyl decomposes the aster-like assemblies near the periphery of the cells [32]. The benomyl-induced disruption of the microtubules nearly eliminated cAR1 mobility completely (Fig. 3A); analysis of these trajectories revealed that the MSD was similar to the positional accuracy for all time lags (Fig. 3B). These measurements also demonstrated that vibrations in our set-up were negligible thus confirming that the immobile population (30%) of cAR1 molecules (Fig. 1D) we observed before adding drug were slowly moving and not completely immobile.
Figure 3. Destabilization of microtubules abolishes cAR1 movement.
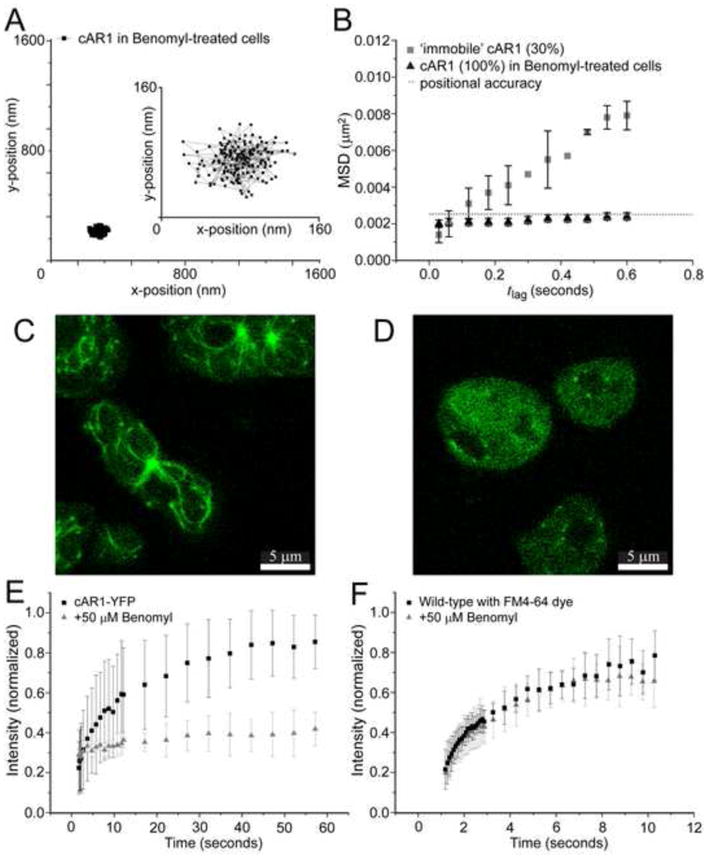
(A) Trajectory of a cAR1 molecule after 10 min incubation with 50 μM Benomyl (n=19 cells), the insert shows the trajectory on a smaller (10x) scale. (B) After destabilization of the microtubules with Benomyl there was only one population of cAR1-Halo-TMR molecules and when compared to the slow population of cAR1-Halo-TMR molecules (black squares), these were all completely immobile after addition of Benomyl (black circles). (C) Microtubules were visualized with tubulin-GFP. (D) After 10 min of incubation with 50 mM Benomyl the aster-like assemblies of microtubules were no longer observed. The microtubules were decomposed and a homogeneous distribution of tubulin-GFP could be seen in the cells. Fluorescence recovery curves of the lipid dye FM4-64 (E) and cAR1-eYFP (F) before (black) and after Benomyl addition (red) (n>10 cells for each condition). The recovery of the fluorescence after photobleaching within a circle of 1μm diameter of the basal plasma membrane is plotted against time. Different time intervals were used for FM4-64 and cAR1-eYFP.
These results suggest that microtubules control cAR1 dynamics in the basal plasma membrane of Dictyostelium cells. cAR1 mobility is stopped at the same concentration of benomyl (50 μM) and time after addition (10 min) as when the disruption of microtubules was observed with fluorescence imaging of γ-tubulin-GFP with confocal microscopy (Fig. 3C, D). The benomyl-induced immobility of cAR1 was not due to cell death, since removal of the drug enabled the cells to go through their developmental program and forming fruiting bodies (data not shown). It was also not caused by the solvent DMSO, which is toxic for cells at concentrations higher than used in our experiments (<1%). Control experiments with only DMSO added showed no effect on receptor mobility (Fig. S7). Another side-effect could be that benomyl was affecting the viscosity of the membrane. The viscosity of the membrane after benomyl treatment was tested with a fluorescent membrane marker. The lipophilic dye N-(3-triethylammoniumpropyl)-4-(6-(4-(diethylamino)phenyl)hexatrienyl)pyridinium dibromide (FM4-64) stains the plasma membrane and is predominantly used to follow the endocytic pathway, but for a short time after incubation it can be used to visualize the plasma membrane. We used fluorescence recovery after photobleaching (FRAP) to test whether the mobility of this dye was changed after treating the cells with benomyl when it was bound to lipids in the plasma membrane. The recovery of the fluorescence was monitored after an area of 1μm diameter was bleached in the basal membrane of the cells. The fluorescence recovery curve of FM 4–64 (Fig. 3E) was not different before and after treatment (2-sample Kolmogorov-Smirnoff test, 95%), demonstrating that the viscosity of the plasma membrane was not affected by benomyl. In contrast, the same experiment with cAR1-eYFP showed no recovery after photobleaching when the cells were treated with benomyl (Fig. 3F). These results again confirmed that cAR1 mobility was inhibited after disruption of the microtubules with the drug and that the overall viscosity of the plasma membrane was unaffected.
3.5 Microtubules disruption leads to decreased signaling downstream of cAR1
One of the first downstream signaling events upon cAR1 activation is the actin-independent translocation of the pleckstrin homology (PH) domain-containing protein CRAC (cytosolic regulator of adenylyl cyclase) [33] to the plasma membrane. The cascade is initiated at the plasma membrane, where Gβγ-sub-units activate PI3K in a Ras-dependent manner [34]. This leads to the formation of phosphatidylinositol 3,4,5 phosphate (PIP3) and the recruitment of CRAC. We used the PH-GFP recruitment to the plasma membrane to monitor the effect of microtubules decomposition on downstream signaling of cAR1. Upon global cAMP stimulation, a uniform recruitment of PH-GFP to the plasma membrane was observed within a few seconds as expected [33] (Fig. 4A, supplemental movie M2). This recruitment was not observed in cells that were treated with benomyl (Fig. 4B, supplemental movie M3). These results suggest that the inability of cAR1 to move in the plasma membrane abrogates downstream signaling and point out an important role for the microtubules in the regulation of cAR1 function.
Figure 4. Downstream signaling disrupted with benomyl.
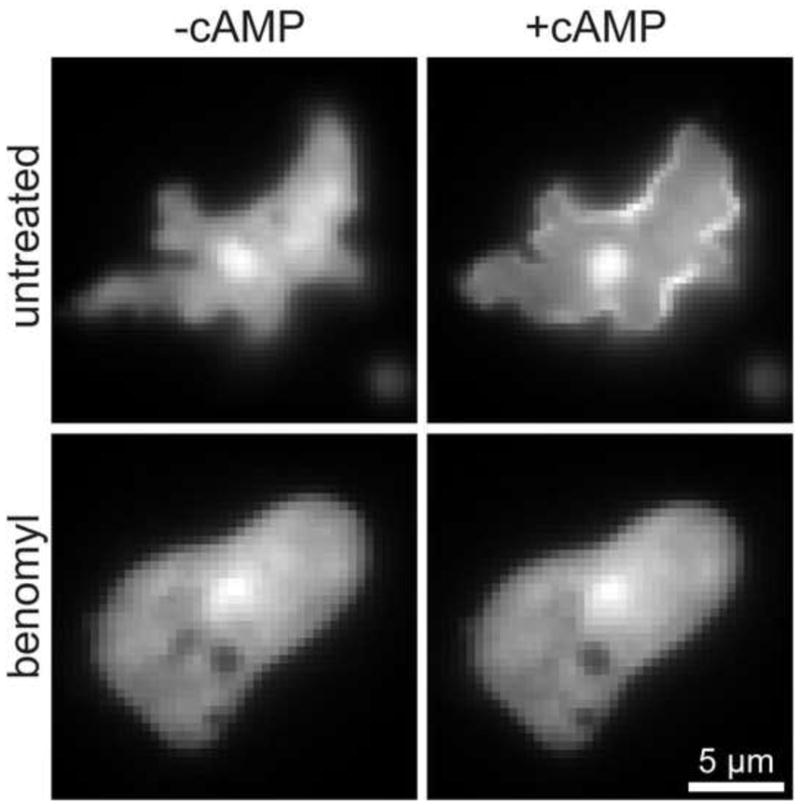
Translocation of PH-GFP to the plasma membrane in the absence (A) or presence of Benomyl (B). Upon cAMP addition there is a jump of PH-GFP (from CRAC) to the plasma membrane in 35 of the observed 51 cells (n=4 experiments). In the presence of Benomyl there was no PH-jump in the 41 observed cells. Images were from movies (see supplemental movies M2 and M3)
4. Discussion
Using TIRFM we were able to visualize long trajectories of single cAR1 receptors in the basal plasma membrane that had been fluorescently tagged using the HaloTag technology. We found two populations of receptor molecules and characterized the types of diffusive behavior. We showed that 70% of the receptors are mobile and have directed motion with D=0.014 μm2/s and v= 0.18 ± 0.07 μm/s. No correlation was seen in the directionality of the receptor motion, but this can be attributed to the fact that we were concurrently observing few, well separated receptors. The directed motion is not a result of cell motility, since immobilizing the cell by disrupting the actin cytoskeleton with the actin depolymerizing drug Latrunculin A did not abolish the directed movement of cAR1 (Fig. 2A). Disruption of the actin cytoskeleton resulted in an increase in cAR1 mobility, showing that actin cytoskeleton has an inhibitory effect on cAR1 mobility. Many reports have been published on the effect of the actin-based membrane cytoskeleton on GPCR mobility in the plasma membrane [35–37]. One of the models proposed, the membrane-skeleton fence model, suggests that the GPCR is directly linked to the actin cytoskeleton and is temporarily confined. Another is the anchored-protein picket model where various transmembrane proteins are anchored and aligned along the membrane cytoskeleton, effectively forming rows of pickets. The hydrodynamic dragging effect of the pickets suppresses the movement of other molecules in the vicinity [38]. No confinement was observed for cAR1 in the plasma membrane on the timescale we measured suggesting that cAR1 is slowed down by the ‘pickets’ on the actin cytoskeleton fence.
We were able to eliminate the directed movement of cAR1 in the basal plasma membrane on the timescale measured by destabilization of the microtubules. The microtubule effect was confirmed by our FRAP experiments with cAR1-eYFP. Microtubules-affecting drugs are very specific and FRAP on a plasma membrane marker showed that immobilizing cAR1 is not due to a change in the membrane viscosity as a side effect of benomyl. Disruption of cytoskeleton elements with the use of drugs can have either an inhibitory or a stimulatory effect in signaling depending on the system looked at [8,9,35]. We investigated this and showed that when microtubules are destabilized, one of the first downstream cAMP signaling events, the jump of the Pleckstrin Homology domain (PH-GFP) of CRAC to the plasma membrane is prevented. We hypothesize that the microtubule-controlled mobility of cAR1 is necessary for cAR1 function, probably by enabling cAR1 to find his signaling partners in the plasma membrane. It has to be noted that it is possible that CRAC binding/transport could require microtubules, although this has not been documented before, independent of whether the receptor is mobile. However, resolving this issue would require uncoupling cAR1 from microtubules without disruption of the microtubules, necessitating more detailed knowledge of the biochemical link between cAR1 and microtubules.
We have shown that microtubules control the mobility of the majority of cAR1 molecules (70%) and that this is important for signaling. We also found a second population of molecules (30%) which we determined to be moving very slowly, since vibration in our set-up was negligible and there was movement to be seen on long timescales. This population may be unaffected by the cytoskeleton, either the actin network or microtubules, as the population was not affected by the drug latrunculin A and the degree of mobility is very close to that seen in benomyl-treated cells. To study the mobility of this population of receptors, imaging rates faster than are possible in our experimental set up are necessary Our imaging rate may be preventing us from discriminating the dynamics of the 30% immobile receptors from the benomyl affected 70% of mobile receptors. Thus, it is possible that the 30% of immobile receptors were not affected by the disruption of microtubules and hence not linked to microtubules, but to other signaling components. The plasma membrane contains diverse structures on nano-meso-scales (2–200 nm) with a variety of lifetimes. To see the structures at the lower limit of size and lifetime, one has to be able to image faster than the 30 ms timeframe applied in our study. In studies using colloidal gold particles in combination with Nomarski (differential interference contrast) or bright-field microscopy, imaging rates of 25 μs resolution can be reached [39]. In our previous single-molecule study, where we showed that there are two receptor populations and that cAR1 mobility is polarized in the apical membrane of chemotaxing cells [14], the diffusion coefficient was quite different compared to what we found in the basal membrane. This again supports the importance of the cytoskeleton in the mobility of cAR1, since the cortex is different for the apical membrane than that of the basal membrane in these rapid moving cells.
Though microtubules have been shown to control the lateral diffusion of plasma membrane receptors in other cell types, including neuronal cells [29,30], the mechanism by which microtubules may affect mobility of cAR1 is unclear as there are only ~ 40 microtubules originating from the centrosome in Dictyostelium cells. The actin network with its many crosslinks and connections with the plasma membrane has been widely described to control the mobility of membrane-localized proteins. It has recently been shown that microtubules have a similar type of network [40]. Microtubules were found to attach to the basal cortex as a dynamic network with many microtubule-microtubule contacts in polarized epithelial cells. Several microtubule plus-end tip proteins, like adenomatous polyposis coli protein (APC) and end-binding protein 1 (EB1) were found to localize along the length of microtubules promoting microtubule-microtubule contacts and attaching the microtubules to the cell cortex along the length of the microtubules: microtubules were shown to grow over and pass APC puncta on the plasma membrane [40] and these puncta could be part of a microdomain. Dictyostelium discoideum have both APC and EB1 and DdEB1 was found to localize along the length of the microtubules [41] indicating that a similar mechanism is possible.
cAR1, among other signaling proteins, was found in detergent-resistant membrane fractions indicating their organization in microdomains [42]. Many signaling molecules have been found in detergent resistant membranes suggesting that these domains function as cell signaling platforms [43]. We hypothesize that cAR1 is localized in microdomains and indirectly coupled to the network of microtubules via microtubule-binding proteins in the microdomains. These microdomains are tracking along microtubules via interaction of proteins in the domain and on the microtubules and thus causing the directed movement of cAR1. In mammalian cells it was found that Gα subunits bind directly to tubulin [44]. In Dictyostelium, the recently found homolog of the Fused kinase, called Tsunami, is localized in puncta at the periphery of the cell and in smaller spots along the length of microtubules in Dictyostelium cells [32], similar to that found for APC in epithelial cells [40]. It was suggested that Tsunami acts in association with microtubules and that it is important for polarization and chemotaxis in Dictyostelium.
If cAR1 is diffusing in a small domain that tracks along the microtubule network, then cAR1 appears immobile upon microtubule disruption. Although cAR1 could still be diffusing in its domain, the receptors’ macroscopic (long-term) diffusion coefficients are now smaller than their microscopic (short-term) diffusion coefficients [39]. A second possible explanation is that receptors are immobilized because of stabilization of the microtubule network. In MCF-7 cell, it has been shown that benomyl, at its half-maximal proliferation inhibitory concentration, strongly suppressed the rate and extent of growing and shortening excursions of individual microtubules without noticeably depolymerizing the microtubule network or decreasing the polymerized mass of tubulin [45]. Furthermore, benomyl treatment caused an increase in the acetylation level of microtubules suggesting that it stabilizes microtubules. Although our study uses a benonmyl concentration that clearly depolymerized the microtubules originating from the centrosome (as shown in Fig. 3B), it is possible that the pieces of the suggested basal microtubule network were stabilized resulting in a fixed position of the domain or even a fixed position of cAR1 if there is a direct link.
Microtubules are of the utmost importance in signaling by trafficking signaling molecules to the signaling platform. The Ang II type 1 receptor (AT1R) traffics into caveolae/lipid rafts together with Rac1 in a microtubule-dependent manner[9]. Microtubules together with actin cytoskeleton restrict cAMP formation by regulating the localization and interaction of GPCR-Gs-AC in caveolae/lipid rafts [8]. Thus microtubules play a role in the localization of signaling proteins in caveolae/lipid microdomains. This is very important for the polarization of signaling in multiple processes including chemotaxis. In many cell types, including Dictyostelium [46] there is an intriguing correlation between the position of the microtubule-organizing center (centrosome) and the direction of movement [16]. Controlling and delivery of signaling molecules to microdomains could therefore be very important in creating a leading versus trailing edge during cell migration as was shown in neurons [29,47].
We propose a mechanism in which cAR1 together with other signaling molecules are localized in microdomains, so called signalosomes, which laterally traffic along submembrane microtubules via microtubules-binding proteins in the domain. In addition, the microtubules also deliver signaling molecules to and from these signaling complexes. In this view the microtubules control the localization and the signaling of these signalosomes in the membrane and this is important in creating a leading versus trailing edge during chemotaxis. A similar mechanism could be essential in a wide variety of cell functions, including cytokinesis, and it will be important to characterize the components of the signalosomes and how they are regulated.
Supplementary Material
Acknowledgments
We thank T. Schmidt for the algorithms written in Matlab to detect and track the fluorescent signals. We also thank M. Rasenick (University of Illinois), W. Marwan (Max Planck Institute for Dynamics of Complex Technical Systems), A. Cambi and A. van Spriel (both at Radboud University Nijmegen Medical Centre) for their help and useful comments on the manuscript. This work was supported by the National Institute of Health (GM71920) to P.I and P.N.D, by the German Science Foundation (FZ-82) to S.K. and to G.S.H and by the Bavarian Ministry for Science and Education to G.S.H..
Abbreviations used in this paper
- GPCR
G-protein coupled receptor
- cAR1
cAMP receptor 1
- TIRFM
Total Internal Reflection Microscopy
- FRAP
Fluorescence Recovery After Photobleaching
- PH
Pleckstrin Homolgy
- TMR
Tetramethylrhodamine
- MSD
Mean Square Displacement
Footnotes
Publisher's Disclaimer: This is a PDF file of an unedited manuscript that has been accepted for publication. As a service to our customers we are providing this early version of the manuscript. The manuscript will undergo copyediting, typesetting, and review of the resulting proof before it is published in its final citable form. Please note that during the production process errors may be discovered which could affect the content, and all legal disclaimers that apply to the journal pertain.
References
- 1.Pierce KL, Premont RT, Lefkowitz RJ. Seven-transmembrane receptors. Nat Rev Mol Cell Biol. 2002;3:639–650. doi: 10.1038/nrm908. [DOI] [PubMed] [Google Scholar]
- 2.Hamm HE. How activated receptors couple to G proteins. Proc Natl Acad Sci U S A. 2001;98:4819–4821. doi: 10.1073/pnas.011099798. [DOI] [PMC free article] [PubMed] [Google Scholar]
- 3.Sun Y, McGarrigle D, Huang XY. When a G protein-coupled receptor does not couple to a G protein. Mol Biosyst. 2007;3:849–854. doi: 10.1039/b706343a. [DOI] [PubMed] [Google Scholar]
- 4.Milne JL, Wu L, Caterina MJ, Devreotes PN. Seven helix cAMP receptors stimulate Ca2+ entry in the absence of functional G proteins in Dictyostelium. J Biol Chem. 1995;270:5926–5931. doi: 10.1074/jbc.270.11.5926. [DOI] [PubMed] [Google Scholar]
- 5.Hall RA, Premont RT, Lefkowitz RJ. Heptahelical receptor signaling: beyond the G protein paradigm. J Cell Biol. 1999;145:927–932. doi: 10.1083/jcb.145.5.927. [DOI] [PMC free article] [PubMed] [Google Scholar]
- 6.Ostrom RS, Insel PA. The evolving role of lipid rafts and caveolae in G protein-coupled receptor signaling: implications for molecular pharmacology. Br J Pharmacol. 2004;143:235–245. doi: 10.1038/sj.bjp.0705930. [DOI] [PMC free article] [PubMed] [Google Scholar]
- 7.Pucadyil TJ, Chattopadhyay A. The human serotonin1A receptor exhibits G-protein-dependent cell surface dynamics. Glycoconj J. 2007;24:25–31. doi: 10.1007/s10719-006-9008-x. [DOI] [PubMed] [Google Scholar]
- 8.Head BP, Patel HH, Roth DM, Murray F, Swaney JS, Niesman IR, Farquhar MG, Insel PA. Microtubules and actin microfilaments regulate lipid raft/caveolae localization of adenylyl cyclase signaling components. J Biol Chem. 2006;281:26391–26399. doi: 10.1074/jbc.M602577200. [DOI] [PubMed] [Google Scholar]
- 9.Zuo L, Ushio-Fukai M, Hilenski LL, Alexander RW. Microtubules regulate angiotensin II type 1 receptor and Rac1 localization in caveolae/lipid rafts: role in redox signaling. Arterioscler Thromb Vasc Biol. 2004;24:1223–1228. doi: 10.1161/01.ATV.0000132400.25045.2a. [DOI] [PubMed] [Google Scholar]
- 10.Allen JA, Halverson-Tamboli RA, Rasenick MM. Lipid raft microdomains and neurotransmitter signalling. Nat Rev Neurosci. 2007;8:128–140. doi: 10.1038/nrn2059. [DOI] [PubMed] [Google Scholar]
- 11.Konijn TM, Van Haastert PJM. Measurement of Chemotaxis in Dictyostelium. Methods in Cell Biology. 1987;28:283–298. doi: 10.1016/s0091-679x(08)61652-0. [DOI] [PubMed] [Google Scholar]
- 12.Gundersen RE, Devreotes PN. Invivo Receptor-Mediated Phosphorylation of A G-Protein in Dictyostelium. Science. 1990;248:591–593. doi: 10.1126/science.2110382. [DOI] [PubMed] [Google Scholar]
- 13.Willard SS, Devreotes PN. Signaling pathways mediating chemotaxis in the social amoeba, Dictyostelium discoideum. Eur J Cell Biol. 2006;85:897–904. doi: 10.1016/j.ejcb.2006.06.003. [DOI] [PubMed] [Google Scholar]
- 14.de Keijzer S, Serge A, van Hemert F, Lommerse PHM, Lamers GEM, Spaink HP, Schmidt T, Snaar-Jagalska BE. A spatially restricted increase in receptor mobility is involved in directional sensing during Dictyostelium discoideum chemotaxis. Journal of Cell Science. 2008;121:1750–1757. doi: 10.1242/jcs.030692. [DOI] [PubMed] [Google Scholar]
- 15.Ueda M, Sako Y, Tanaka T, Devreotes P, Yanagida T. Single-molecule analysis of chemotactic signaling in Dictyostelium cells. Science. 2001 Oct 26;294(5543):864–7. doi: 10.1126/science.1063951. [DOI] [PubMed] [Google Scholar]
- 16.Gundersen GG, Cook TA. Microtubules and signal transduction. Curr Opin Cell Biol. 1999;11:81–94. doi: 10.1016/s0955-0674(99)80010-6. [DOI] [PubMed] [Google Scholar]
- 17.Kim JY, Soede RD, Schaap P, Valkema R, Borleis JA, Van Haastert PJ, Devreotes PN, Hereld D. Phosphorylation of chemoattractant receptors is not essential for chemotaxis or termination of G-protein-mediated responses. J Biol Chem. 1997;272:27313–27318. doi: 10.1074/jbc.272.43.27313. [DOI] [PubMed] [Google Scholar]
- 18.Phair RD, Gorski SA, Misteli T. Measurement of dynamic protein binding to chromatin in vivo, using photobleaching microscopy. Methods Enzymol. 2004;375:393–414. doi: 10.1016/s0076-6879(03)75025-3. [DOI] [PubMed] [Google Scholar]
- 19.Fukui Y, Yumura S, Yumura TK. Agar-overlay immunofluorescence: high-resolution studies of cytoskeletal components and their changes during chemotaxis. Methods Cell Biol. 1987;28:347–356. doi: 10.1016/s0091-679x(08)61655-6. [DOI] [PubMed] [Google Scholar]
- 20.De Keijzer S, Snaar-Jagalska BE, Spaink HP, Schmidt T. Single Molecules and Nanotechnology. Vol. 12. Springer; 2008. Single-Molecule Imaging of Cellular Reactions; pp. 107–129. Springer Series in Biophysics. [Google Scholar]
- 21.Schutz GJ, Schindler H, Schmidt T. Single-molecule microscopy on model membranes reveals anomalous diffusion. Biophysical Journal. 1997;73:1073–1080. doi: 10.1016/S0006-3495(97)78139-6. [DOI] [PMC free article] [PubMed] [Google Scholar]
- 22.Anderson RGW. The caveolae membrane system. Annual Review of Biochemistry. 1998;67:199–225. doi: 10.1146/annurev.biochem.67.1.199. [DOI] [PubMed] [Google Scholar]
- 23.Lommerse PHM, Blab GA, Cognet L, Harms GS, Snaar-Jagalska BE, Spaink HP, Schmidt T. Single-molecule Imaging of the H-Ras membrane-anchor reveals domains in the cytoplasmic lealet of the cell membrane. Biophysical Journal. 2004;86:609–616. doi: 10.1016/S0006-3495(04)74139-9. [DOI] [PMC free article] [PubMed] [Google Scholar]
- 24.Qian H, Sheetz MP, Elson EL. Single particle tracking. Analysis of diffusion and flow in two-dimensional systems. Biophysical Journal. 1991;60:910–21. doi: 10.1016/S0006-3495(91)82125-7. [DOI] [PMC free article] [PubMed] [Google Scholar]
- 25.Kusumi A, Sako Y, Yamamoto M. Confined lateral diffusion of membrane receptors as studied by single particle tracking (nanovid microscopy). Effects of calcium-induced differentiation in cultured epithelial cells. Biophys J. 1993;65:2021–40. doi: 10.1016/S0006-3495(93)81253-0. [DOI] [PMC free article] [PubMed] [Google Scholar]
- 26.Schmidt T, Schutz GJ, Baumgartner W, Gruber HJ, Schindler H. Imaging of single molecule diffusion. Proc Natl Acad Sci U S A. 1996;93:2926–9. doi: 10.1073/pnas.93.7.2926. [DOI] [PMC free article] [PubMed] [Google Scholar]
- 27.Owen DM, Williamson D, Rentero C, Gaus K. Quantitative microscopy: protein dynamics and membrane organisation. Traffic. 2009;10:962–971. doi: 10.1111/j.1600-0854.2009.00908.x. [DOI] [PubMed] [Google Scholar]
- 28.Janetopoulos C, Ma L, Devreotes PN, Iglesias PA. Chemoattractant-induced phosphatidylinositol 3,4,5-trisphosphate accumulation is spatially amplified and adapts, independent of the actin cytoskeleton. Proceedings of the National Academy of Sciences of the United States of America. 2004;101:8951–8956. doi: 10.1073/pnas.0402152101. [DOI] [PMC free article] [PubMed] [Google Scholar]
- 29.Bouzigues C, Morel M, Triller A, Dahan M. Asymmetric redistribution of GABA receptors during GABA gradient sensing by nerve growth cones analyzed by single quantum dot imaging. Proc Natl Acad Sci U S A. 2007;104:11251–11256. doi: 10.1073/pnas.0702536104. [DOI] [PMC free article] [PubMed] [Google Scholar]
- 30.Charrier C, Ehrensperger MV, Dahan M, Levi S, Triller A. Cytoskeleton regulation of glycine receptor number at synapses and diffusion in the plasma membrane. J Neurosci. 2006;26:8502–8511. doi: 10.1523/JNEUROSCI.1758-06.2006. [DOI] [PMC free article] [PubMed] [Google Scholar]
- 31.Welker DL, Williams KL. Mitotic Arrest and Chromosome Doubling Using Thiabendazole, Cambendazole, Nocodazole and Ben Late in the Slime-Mold Dictyostelium-Discoideum. Journal of General Microbiology. 1980;116:397–407. [Google Scholar]
- 32.Tang L, Franca-Koh J, Xiong Y, Chen MY, Long Y, Bickford RM, Knecht DA, Iglesias PAPN. Devreotes, tsunami, the Dictyostelium homolog of the Fused kinase, is required for polarization and chemotaxis. Genes Dev. 2008;22:2278–2290. doi: 10.1101/gad.1694508. [DOI] [PMC free article] [PubMed] [Google Scholar]
- 33.Parent CA, Blacklock BJ, Froehlich WM, Murphy DB, Devreotes PN. G protein signaling events are activated at the leading edge of chemotactic cells. Cell. 1998;95:81–91. doi: 10.1016/s0092-8674(00)81784-5. [DOI] [PubMed] [Google Scholar]
- 34.Sasaki AT, Chun C, Takeda K, Firtel RA. Localized Ras signaling at the leading edge regulates PI3K, cell polarity, and directional cell movement. J Cell Biol. 2004;167:505–518. doi: 10.1083/jcb.200406177. [DOI] [PMC free article] [PubMed] [Google Scholar]
- 35.Ganguly S, Pucadyil TJ, Chattopadhyay A. Actin cytoskeleton-dependent dynamics of the human serotonin1A receptor correlates with receptor signaling. Biophys J. 2008;95:451–463. doi: 10.1529/biophysj.107.125732. [DOI] [PMC free article] [PubMed] [Google Scholar]
- 36.Wheeler D, Sneddon WB, Wang B, Friedman PA, Romero G. NHERF-1 and the cytoskeleton regulate the traffic and membrane dynamics of G protein-coupled receptors. J Biol Chem. 2007;282:25076–2508. doi: 10.1074/jbc.M701544200. [DOI] [PubMed] [Google Scholar]
- 37.Suzuki K, Ritchie K, Kajikawa E, Fujiwara T, Kusumi A. Rapid hop diffusion of a G-protein-coupled receptor in the plasma membrane as revealed by single-molecule techniques. Biophys J. 2005;88:3659–3680. doi: 10.1529/biophysj.104.048538. [DOI] [PMC free article] [PubMed] [Google Scholar]
- 38.Umemura YM, Vrljic M, Nishimura SY, Fujiwara TK, Suzuki KG, Kusumi A. Both MHC class II and its GPI-anchored form undergo hop diffusion as observed by single-molecule tracking. Biophys J. 2008;95:435–450. doi: 10.1529/biophysj.107.123018. [DOI] [PMC free article] [PubMed] [Google Scholar]
- 39.Kusumi A, Shirai YM, Koyama-Honda I, Suzuki KG, Fujiwara TK. Hierarchical organization of the plasma membrane: investigations by single-molecule tracking vs. fluorescence correlation spectroscopy. FEBS Lett. 2010;584:1814–1823. doi: 10.1016/j.febslet.2010.02.047. [DOI] [PubMed] [Google Scholar]
- 40.Reilein A, Nelson WJ. APC is a component of an organizing template for cortical microtubule networks. Nat Cell Biol. 2005;7:463–473. doi: 10.1038/ncb1248. [DOI] [PMC free article] [PubMed] [Google Scholar]
- 41.Hestermann A, Rehberg M, Graf R. Centrosomal microtubule plus end tracking proteins and their role in Dictyostelium cell dynamics. Journal of Muscle Research and Cell Motility. 2002;23:621–630. doi: 10.1023/a:1024450922609. [DOI] [PubMed] [Google Scholar]
- 42.Xiao Z, Devreotes PN. Identification of detergent-resistant plasma membrane microdomains in Dictyostelium: Enrichment of signal transduction proteins. Molecular Biology of the Cell. 1997;8:855–869. doi: 10.1091/mbc.8.5.855. [DOI] [PMC free article] [PubMed] [Google Scholar]
- 43.Simons K, Toomre D. Lipid rafts and signal transduction. Nat Rev Mol Cell Biol. 2000;1:31–39. doi: 10.1038/35036052. [DOI] [PubMed] [Google Scholar]
- 44.Wang N, Yan K, Rasenick MM. Tubulin binds specifically to the signal-transducing proteins, Gs alpha and Gi alpha 1. J Biol Chem. 1990;265:1239–1242. [PubMed] [Google Scholar]
- 45.Rathinasamy K, Panda D. Kinetic stabilization of microtubule dynamic instability by benomyl increases the nuclear transport of p53. Biochem Pharmacol. 2008;76:1669–1680. doi: 10.1016/j.bcp.2008.09.001. [DOI] [PubMed] [Google Scholar]
- 46.Ueda M, Graf R, MacWilliams HK, Schliwa M, Euteneuer U. Centrosome positioning and directionality of cell movements. Proc Natl Acad Sci U S A. 1997;94:9674–9678. doi: 10.1073/pnas.94.18.9674. [DOI] [PMC free article] [PubMed] [Google Scholar]
- 47.Golub T, Caroni P. PI(4,5)P2-dependent microdomain assemblies capture microtubules to promote and control leading edge motility. J Cell Biol. 2005;169:151–165. doi: 10.1083/jcb.200407058. [DOI] [PMC free article] [PubMed] [Google Scholar]
Associated Data
This section collects any data citations, data availability statements, or supplementary materials included in this article.