

Abstract
Muscle and bone form a functional unit. While muscle size is a useful surrogate of mechanical load on bone, the independent contributions to bone strength of muscle force, muscle size, gravitational load (body weight), and physical activity have not been assessed. 321 healthy participants (32% black, 47% male), age 5 to 35 years were assessed. Peak dorsiflexion muscle torque (ft-lbs) of the ankle was assessed using isometric dynamometry. Tibia peripheral quantitative computed tomography measures included polar section modulus (Zp, mm3), periosteal and endosteal circumference (mm), cortical area (mm2), and volumetric bone mineral density (vBMD, mg/cm3) at the 38% site, and muscle cross-sectional area (CSA, mm2) at the 66% site. Physical activity (average hours /week) was assessed by questionnaire. Log linear regression was used to assess determinants of muscle specific force (MSF; torque relative to muscle CSA) and Zp adjusted for age and tibia length. MSF was greater in blacks than whites (p < 0.05) and lower in females than males (p < 0.001). Zp was greater in blacks than whites (p = 0.002) in Tanner stages 1-4, but the difference was attenuated in Tanner 5 (interaction, p = 0.02), R2 = 0.87. Muscle CSA, muscle torque, body weight, and physical activity were added to the model and each load covariate was independently and significantly (all p < 0.02) associated with Zp (R2 = 0.92), periosteal circumference, and cortical area. Inclusion of these measures attenuated but did not eliminate the significant race differences. Only muscle CSA was positively associated with endosteal circumference, while none of the load covariates were associated with vBMD.
In conclusion, bone geometry is associated with several factors that define the mechanical load on bone, independent of age, tibia length, maturation, race, and sex. Race differences in Zp were not explained by these measures of mechanical load. Given that inclusion of muscle torque, body weight and physical activity resulted in a nominal increase in the R2, muscle size is an adequate surrogate for the mechanical load on bone in healthy participants.
Keywords: Peripheral quantitative computed tomography, muscle, muscle-bone unit, body weight, bone strength, physical activity
INTRODUCTION
Bone mass is strongly associated with muscle mass [1]. The skeleton provides lever arms for attachment of muscles and the forces generated by muscle contraction induce changes in bone architecture [2]. During growth, mechanical loading [3], results in a cascade of events that augment bone deposition as needed to strengthen the bone enough to withstand the increased demands [4]. Thus, changes in muscle and bone are coupled as a functional unit [5]. Accordingly, changes in estimated bone strength during growth are highly correlated with changes in lean mass and muscle cross-sectional area (CSA) but not fat mass [6]. When the growing bone is not subject to mechanical loading, muscle size and function are reduced and bone lacks the shape necessary for its function [7]. In a study of arm side-to-side differences in growing tennis players, greater muscle size induced by exercise was positively correlated with changes in bone mass, size, and strength [8]. However, the greater muscle size only accounted for 12 to 16% of the side-to-side variance in bone outcomes, suggesting that other mechanical factors may contribute to bone adaptation during growth.
Muscle strength scales with muscle size; therefore, lean mass, measured by dual energy x-ray absorptiometry (DXA), or muscle CSA, measured by peripheral quantitative computed tomography (pQCT), are often used as surrogates of muscle force in interpretation of bone outcomes [6, 9, 10]. However, muscle CSA does not fully define the loads to which bone is subjected. Ultimately, there are additional factors that form the sum of mechanical loads that can cause bone adaptation. The amount of muscle force that can be generated relative to muscle CSA (i.e. muscle specific force, MSF) can be increased by resistance exercise [11, 12]. Finally, gravitational loading (body weight) may also be a factor in the sum of the load on bone, as illustrated by the deleterious effects of spaceflight on the muscle-bone unit [14]. The independent contributions of these multiple characteristics of mechanical loads that determine bone geometry and volumetric bone mineral density (vBMD) have not been assessed.
We previously reported race and sex differences in pQCT measures of cortical geometry and vBMD that were not explained by race and sex differences in muscle CSA [15, 16]. It is not known if sex and race differences in other components of muscle loading contribute to sex and race differences in bone mass. Therefore, we will extend these analyses [16] to determine if additional measures of mechanical load contribute to race and sex differences in bone geometry and vBMD. The primary objectives of this study were (1) to examine the impact of age, sex, race, and pubertal maturation on MSF in a sample of black and white children, adolescents, and adults, and (2) to describe the independent effects of mechanical loads (muscle CSA, muscle torque, body weight, and physical activity) on bone geometry and vBMD. Secondary objectives were to demonstrate the importance of tibia length in describing the functional muscle-bone unit for both the growing and adult skeleton, and determine if muscle area provides an adequate surrogate of muscle strength in healthy children and adults.
METHODS
Study Participants
As previously described, the study population included healthy children, adolescents, and adults ages 5 to 35 years that were enrolled as participants for bone studies at the Children’s Hospital of Philadelphia (CHOP) [16]. The original study included 665 participants. Muscle torque was measured in all 89 adult participants and in 232 of the 576 pediatric participants enrolled in an ancillary pediatric study, resulting in a total of 321 participants for these analyses.
The study protocol was approved by the Institutional Review Board at CHOP. Informed consent was obtained directly from study participants older than 18 years, and assent along with parental consent from participants less than 18 years of age.
Anthropometry, Physical Maturity, and Race
Anthropometric measures and pubertal development were assessed as previously described [16]. Age- and sex-specific Z-scores for height and body mass index (BMI, kg/m2) were calculated for participants less than 20 years of age (the upper limit of the reference data) [17]. The data analyzed were restricted to participants that self-identified as black (n = 102) or white (n = 219).
Physical Activity Questionnaire
A questionnaire was developed that combined an assessment of physical activity over the prior year based upon Aaron et al. and incorporated a classification of the physical activities from no impact to high impact based upon Kemper et al. [20, 21]. Participants were asked whether they performed any of 55 different activities at least 10 times in the prior year. In order to capture seasonal variability, they were asked to estimate the days per week and minutes per day for each activity for each month. Each activity was assigned an impact level from 0 (e.g. swimming) to 3 (e.g. gymnastics) and the mean time (hours/week) at each activity level was averaged over the prior year. We report the sum of all four categories (total physical activity, hours/week) and the sum of the activities with impact levels of 2 or 3 (moderate to high impact activity, hours/week). This questionnaire was administered in the 231 participants ≤ 21 years of age only.
Bone Assessment by Peripheral Quantitative Computed Tomography
Bone measures in the left tibia were obtained by pQCT as previously described [16]. Cortical measures included volumetric bone mineral density (vBMD, mg/cm3), periosteal and endosteal circumferences (mm), bone area (mm2) within the region defined by the endosteal and periosteal surfaces, and polar section modulus (Zp, mm3). Zp is a function of the cortical periosteal and endosteal dimensions, explaining 77% of the variance in bone failure load [22]. Muscle cross-sectional area (muscle CSA) and fat CSA were assessed at the 66% site.
Biodex Measurement of Muscle Torque
Muscle torque was assessed using Biodex Multi-Joint System 3 Pro (Biodex Medical Systems, Inc, Shirley, NY). High intrarater (0.97 to 0.99) and interrater (0.93 to 0.96) intraclass correlation coefficients have been reported [23]. Peak isometric torque (ft-lbs) was measured in triplicate at -10, 0, 10, and 20 degrees and the highest value recorded for both dorsiflexion and plantarflexion. We report peak isometric torque (ft-lbs) in dorsiflexion (with the foot placed in 20 degrees of plantarflexion), since this measurement had the best reproducibility in our lab (coefficient of variation, 4.3%) and had the best fit (R2) in the regression models. Further, the tibialis anterior attaches directly to the tibia (the bone of interest in this study) and causes dorsiflexion of the ankle.
Statistical Analysis
Stata 11.0 (Stata Corp., College Station, TX) was used for all statistical analyses. A p-value of < 0.05 was considered statistically significant, and two-sided tests of hypotheses were used throughout. Group differences were assessed using Student’s t-test or the sign-rank test for non-normally distributed variables.
Determinants of MSF were evaluated using log linear regression models of muscle torque relative to muscle CSA, adjusted for age, age2, sex (male vs. female), race (black vs. white), and tibia length. Log linear regression was used to evaluate Zp and the other pQCT bone outcomes, adjusted for age, age2, tibia length, Tanner stage (Tanner stage 1 as the referent group), race, Tanner stage x race interaction, sex, and Tanner stage x sex interaction, as previously described [16]. To investigate the influence of load on Zp and the other bone outcomes, muscle CSA, muscle torque, body weight, and total physical activity or moderate to high impact activity were sequentially added to the base bone model and the increases in the R2 were noted. Similar models were used to examine the other pQCT measures of cortical geometry and vBMD.
Tibia length is highly associated with Zp and with muscle CSA. In order to determine the independent contributions of tibia length and muscle CSA to Zp, pearson correlation coefficients were used to assess the relationships between log Zp, log tibia length, and log muscle CSA in participants ≤ age 21 and in participants > age 21. Partial correlation coefficients were obtained to examine the relationship between log Zp and log tibia length, independent of log muscle CSA, and to examine the relationship between log Zp and log muscle CSA, independent of log tibia length.
RESULTS
Participant Characteristics
The participant characteristics are summarized in Table 1. White participants were significantly older than black participants (p = 0.01) due to the greater proportion of whites in the adult group (76%) compared to the pediatric group (65%). The black participants were an average of 0.7 years younger than the white participants (p < 0.01) within Tanner stages 2 through 4, indicating significantly more advanced maturation relative to age. Among the participants age 20 years or younger, height Z-scores did not differ according to race, but BMI Z-scores were significantly greater in the black group compared to the white group in both males (p = 0.0003) and females (p = 0.0001). Among the participants age greater than 20 years of age, height was not significantly different between the white and black groups in the males or females. However, BMI was significantly greater in the black females (p = 0.02) compared to the white females and did not differ between the black and white males. Physical activity was assessed only in participants less than 21 years of age, and both total physical activity (r = -0.14, p = 0.047) and moderate to high impact activity (r = -0.16, p = 0.022) were negatively associated with BMI Z-score.
Table 1.
Demographic and anthropometric characteristics of participants according to sex and race
| Variable | Males |
Females |
||
|---|---|---|---|---|
| White | Black | White | Black | |
| N | 105 | 45 | 114 | 57 |
| Age (years) | 17.7 ± 7.6 | 14.8 ± 6.9 | 17.7 ± 7.9 | 15.9 ± 8.1 |
| N per Tanner Stage | ||||
| Stage 1 | 19 | 10 | 22 | 13 |
| Stage 2 | 8 | 5 | 10 | 3 |
| Stage 3 | 10 | 4 | 10 | 4 |
| Stage 4 | 11 | 11 | 20 | 13 |
| Stage 5 | 57 | 15 | 52 | 24 |
| Anthropometric data in participants ages ≤ 20 years (n = 214) a | ||||
| Height Z-score | 0.33 ± 0.88 | 0.43 ± 1.05 | 0.32 ± 0.68 | 0.57 ± 1.08 |
| BMI Z-score | 0.17 ± 0.81 | 0.93 ± 1.19 | 0.11 ± 0.89 | 0.87 ± 1.06 |
| Anthropometric data in participants ages > 20 years (n = 107) | ||||
| Height (cm) | 180.6 ± 6.3 | 177.6 ± 5.5 | 167.2 ± 6.2 | 166.4 ± 5.5 |
| BMI (kg/m2) | 23.8 ± 2.6 | 24.1 ± 2.9 | 22.7 ± 4.0 | 25.8 ± 5.5 |
| Physical Activity (hr/wk)b | ||||
| Total | 14.5 (9.2 to 21.5) | 13.2 (7.5 to 21.6) | 11.1 (6.9 to 16.5) | 11.5 (6.8 to 21.1) |
| Mod to high impact | 6.5 (3.8 to 9.4) | 6.4 (3.6 to 11.8) | 4.9 (2.2 to 8.3) | 4.3 1.7 to 8.9) |
All values are means ± SD, unless otherwise noted.
Z-scores are limited to participants ≤ 20 years of age because the national reference data for growth Z-scores are available for this age range.
Physical activity data were collected in the 231 participants less than 22 years of age and are presented as median (inter-quartile range).
Muscle Specific Force
The multivariate regression model for muscle torque is shown in Table 2. Muscle torque was positively associated with tibia length and muscle CSA, independent of age, sex and race. Sex, age and race differences in MSF were assessed in this model as muscle torque adjusted for muscle CSA. Females exhibited significantly lower MSF compared to males, adjusted for age, race and tibia length. MSF was significantly greater in the black group compared to the white group (Figure 1), adjusted for the other covariates, and this relationship was more pronounced when the data were limited to participants aged less than or equal to 21 [β: 0.11 (95% CI: 0.11, 0.18), p = 0.001]. However, a test for interaction between race and age was not significant.
Table 2.
Multivariate regression models for Muscle Torque
| Entire Sample R2 = 0.83, n = 320 |
Age ≤ 21 R2 = 0.87, n = 238 |
|||
|---|---|---|---|---|
| β (95% CI) | P | β (95% CI) | P | |
| Intercept | -12.8 (-14.9, -10.8) | < 0.001 | -10.1 (-12.6, -7.7) | < 0.001 |
| Age | 0.05 (0.02, 0.08) | 0.002 | 0.16 (0.09, 0.22) | < 0.001 |
| Age2 | -0.001 (-0.002, -0.00) | 0.005 | -0.004 (-0.006, -0.002) | < 0.001 |
| Female sex | -0.12 (-0.17, -0.06) | < 0.001 | -0.14 (-0.20, -0.08) | < 0.001 |
| Black race | 0.06 (-0.00, 0.12) | 0.047 | 0.11 (0.04, 0.18) | 0.001 |
| Ln (tibia length) | 1.61 (1.19, 2.03) | < 0.001 | 1.05 (0.53, 1.57) | < 0.001 |
| Ln (muscle CSA) | 0.68 (0.50, 0.86) | < 0.001 | 0.66 (0.46, 0.87) | < 0.001 |
Figure 1.
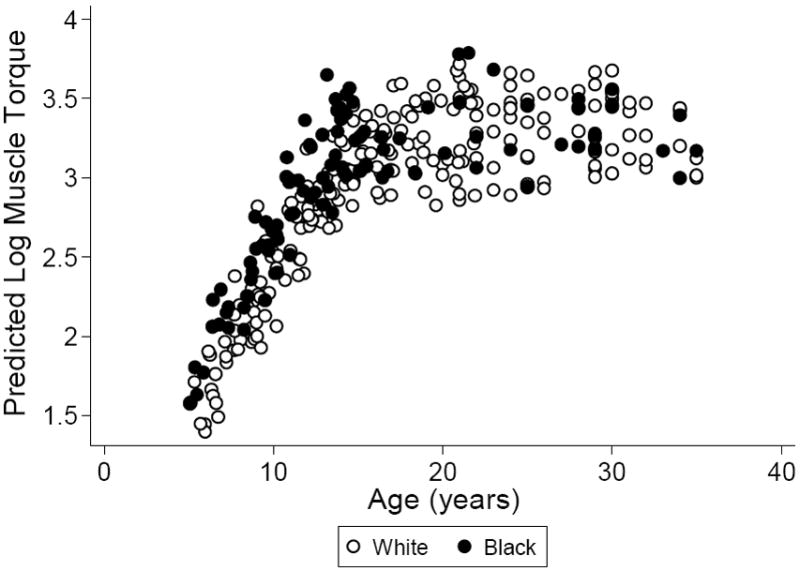
Race differences in the predicted values for muscle torque (log ft-lbs) according to age based on the model in Table 2, comparing whites (open circles) to blacks (closed circles).
Determinants of Zp and Other Cortical Outcomes
The multivariate regression models for Zp are shown in Table 3. Based on our previously published model of determinants of Zp in the full cohort, Model 1 illustrates the independent effects of tibia length, age, maturation, race and sex (R2 = 0.87) [16]. Compared to Tanner stage 1, Tanner stage 5 was associated with significantly greater Zp (p = 0.001). The black group exhibited significantly greater Zp (p = 0.001) compared to the white group, adjusted for the other covariates. However, this race effect was attenuated in the Tanner 5 participants as indicated by the significant Tanner 5 by black group interaction (p = 0.02).
Table 3.
Multivariate regression models for Section Modulus
| Model 1 | Model 2 | Model 3 | ||||
|---|---|---|---|---|---|---|
| Base Model R2 = 0.87 |
Model 1 adjusted for muscle CSA R2 = 0.91 |
Model 1 adjusted for muscle CSA, muscle torque, and body weight R2 = 0.92 |
||||
| β (95% CI) | P | β (95% CI) | P | β (95% CI) | P | |
| Intercept | -5.9 (-7.6, -4.3) | < 0.001 | -8.2 (-9.5, -6.8) | < 0.001 | -5.1 (-6.9, -3.4) | < 0.001 |
| Age | 0.02 (-0.004, 0.05) | 0.10 | -0.008 (-0.03, 0.01) | 0.46 | -0.007 (-0.03, 0.01) | 0.52 |
| Age2 | -0.00 (-0.001, 0.0001) | 0.15 | 0.00 (-0.00, 0.001) | 0.46 | 0.00 (-0.00, 0.001) | 0.58 |
| Ln (tibia length) | 2.19 (1.9, 2.5) | < 0.001 | 1.58 (1.3, 1.8) | < 0.001 | 1.22 (0.94, 1.51) | < 0.001 |
| Tanner stage 2 | -0.08 (-0.35, 0.18) | 0.55 | 0.06 (-0.16, 0.27) | 0.59 | 0.04 (-0.16, 0.25) | 0.69 |
| Tanner stage 3 | 0.18 (-0.08, 0.43) | 0.17 | 0.15 (-0.06, 0.36) | 0.15 | 0.16 (-0.04, 0.36) | 0.12 |
| Tanner stage 4 | 0.19 (-0.05, 0.42) | 0.12 | 0.07 (-0.12, 0.26) | 0.45 | 0.10 (-0.08, 0.29) | 0.27 |
| Tanner stage 5 | 0.35 (0.15, 0.56) | 0.001 | 0.14 (-0.03, 0.31) | 0.10 | 0.16 (-0.008, 0.32) | 0.06 |
| Black race | 0.16 (0.07, 0.25) | 0.001 | 0.12 (0.04, 0.19) | 0.002 | 0.10 (0.03, 0.17) | 0.004 |
| Black race by Tanner interaction | ||||||
| Black, Tanner 2 | 0.03 (-0.14, 0.20) | 0.73 | 0.03 (-0.10, 0.17) | 0.63 | 0.06 (-0.07, 0.19) | 0.37 |
| Black, Tanner 3 | -0.05 (-0.21, 0.11) | 0.55 | -0.06 (-0.19, 0.07) | 0.39 | -0.07 (-0.20, 0.06) | 0.29 |
| Black, Tanner 4 | -0.07 (-0.20, 0.05) | 0.26 | -0.04 (-0.15, 0.06) | 0.41 | -0.05 (-0.16, 0.05) | 0.28 |
| Black, Tanner 5 | -0.14 (-0.24, -0.03) | 0.02 | -0.10 (-0.19, -0.01) | 0.03 | -0.09 (-0.18, -0.01) | 0.03 |
| Female sex | -0.08 (-0.16, 0.004) | 0.06 | -0.03 (-0.10, 0.04) | 0.36 | -0.02 (-0.08, 0.05) | 0.64 |
| Female sex by Tanner interaction | ||||||
| Female, Tanner 2 | 0.08 (-0.08, 0.24) | 0.31 | -0.02 (-0.14, 0.11) | 0.79 | -0.02 (-0.14, 0.11) | 0.79 |
| Female, Tanner 3 | -0.04 (-0.19, 0.11) | 0.61 | -0.07 (-0.20, 0.05) | 0.23 | -0.08 (-0.20, 0.03) | 0.17 |
| Female, Tanner 4 | -0.04 (-0.16, 0.09) | 0.55 | -0.04 (-0.14, 0.06) | 0.39 | -0.07 (-0.17, 0.03) | 0.17 |
| Female, Tanner 5 | -0.11 (-0.21, -0.004) | 0.04 | -0.06 (-0.15, 0.02) | 0.14 | -0.09 (-0.17, -0.007) | 0.03 |
| Ln (muscle CSA) | -- | 0.71 (0.60, 0.82) | < 0.001 | 0.47 (0.33, 0.61) | < 0.001 | |
| Ln (muscle torque) | -- | -- | 0.08 (0.02, 0.14) | 0.01 | ||
| Ln(body weight) | -- | -- | 0.23 (0.11, 0.35) | < 0.001 | ||
Comparable models were generated for the remaining cortical outcomes (data not shown). In the models for cortical area and periosteal circumference, the sex, race and interaction effects were similar to those observed for Zp, as previously described in these subjects [16]. However, the models for vBMD and endosteal circumference revealed different patterns. Cortical vBMD was greater (p = 0.03) in blacks vs. whites, adjusted for the other covariates. And, cortical vBMD was significantly greater in females compared with males in Tanner stages 3 – 5. The greater endosteal circumference in black participants, compared to whites, and in male participants compared to females described in the previous study [16] were not statistically significant here, likely related to the smaller sample size.
Determinants of the Muscle-Bone Unit
Table 3 also shows the multivariate regression model for Zp (R2 = 0.91) adjusted for muscle CSA (Model 2, R2 = 0.91). Greater muscle CSA was significantly associated with greater Zp (p < 0.001). The greater Zp in Tanner stage 5 was no longer statistically significant after adjusting for muscle CSA (p = 0.10). The greater Zp in the black group remained (p = 0.002) as well as the significant Tanner stage 5 x black group interaction (p = 0.03).
Table 3 also shows the full multivariate regression model for Zp adjusted for muscle CSA, muscle torque, and body weight (Model 3, R2 = 0.92). These three load covariates were each independently and significantly associated with greater Zp adjusted for age, tibia length, Tanner stage, race, and sex. Despite the greater MSF observed in black participants, adjusting Zp for the load covariates did not explain the significantly greater Zp (p = 0.004) in the black group compared to the white group (Figure 2). Similar to the model without the load covariates (Model 1), there was a significant negative black group by Tanner stage 5 interaction (p = 0.03). Fat CSA was not significant when it was added to Model 3 without body weight, suggesting there is no independent effect of fat CSA. Total physical activity was added to the base model along with the other load covariates (muscle CSA, muscle torque, and body weight) in the 231 participants ≤ age 21 that completed the questionnaire. In addition to muscle CSA, muscle torque, and body weight, total physical activity (p = 0.01) was an independent predictor of greater Zp (R2 = 0.94). Moderate to high impact activity (p = 0.09) was not significantly associated with Zp.
Figure 2.
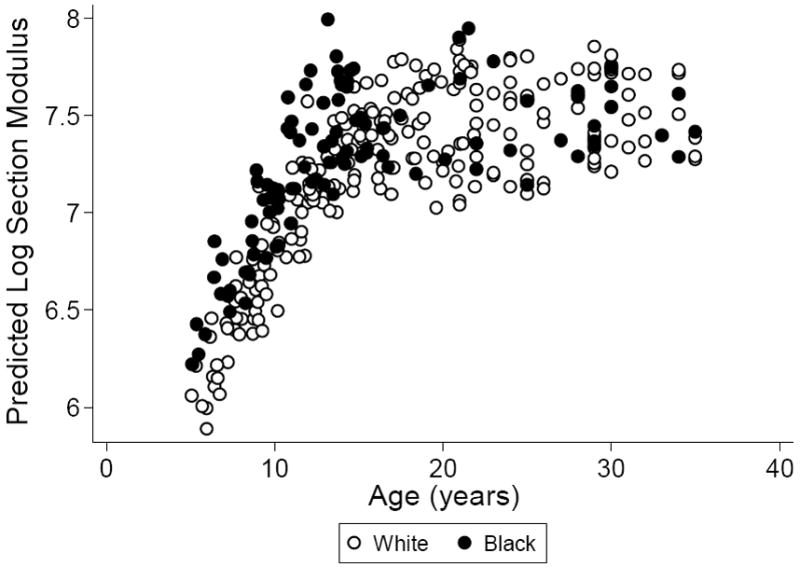
Race differences in the predicted values for Zp (log mm3) according to age based on the model in Table 3, adjusted for muscle CSA, muscle torque, and body weight, and comparing whites (open circles) to blacks (closed circles).
Muscle CSA, muscle torque, and body weight were all significant and independent determinants of periosteal circumference (R2 = 0.92) and cortical area (R2 = 0.92), adjusted for the covariates in Table 3 (data not shown). However, only muscle CSA was positively associated with endosteal circumference (p = 0.001). None of the load covariates were associated with cortical vBMD. When the analyses were conducted in the participants with physical activity data, total physical activity (p = 0.006) and moderate to high impact activity (p = 0.04) were independently and significantly associated with periosteal circumference. Total physical activity and moderate to high impact activity were not associated with cortical vBMD or endosteal circumference.
The Relationships between Bone Length, Muscle CSA, and Zp in the Growing and Adult Skeleton
Univariate analyses (Table 4) demonstrated that, among the children and adolescents, muscle CSA was positively associated with Zp, explaining 85% of the variance in Zp. Conversely, tibia length alone was significantly associated with greater Zp, explaining 84% of the variance in Zp. Multivariate regression analysis indicated that, combined, muscle CSA and tibia length explained 91% of the variance in Zp. However, when muscle CSA was added to the model along with tibia length to determine partial correlation coefficients, muscle CSA explained 42% of the variance in Zp, holding tibia length constant, while tibia length explained 37% of the variance in Zp, holding muscle CSA constant.
Table 4.
Correlation coefficients for relationships with log Zp
| Age ≤ 21 n = 231 |
Age > 21 n = 89 |
|||
|---|---|---|---|---|
| R2 | P | R2 | P | |
| Ln (tibia length) | 0.84 | < 0.001 | 0.45 | < 0.001 |
| Ln (muscle CSA) | 0.85 | < 0.001 | 0.39 | < 0.001 |
| Combined Model | 0.91 | 0.64 | ||
| Ln (tibia length) | 0.37 | < 0.001 | 0.42 | < 0.001 |
| Ln (muscle CSA) | 0.42 | < 0.001 | 0.35 | < 0.001 |
Among adults, muscle CSA alone was associated with greater Zp, explaining 39% of the variance in Zp, while tibia length alone was significantly associated with greater Zp, explaining 45% of the variance in Zp. Combined, muscle CSA and tibia length explained 64% of the variance in Zp. However, when muscle CSA was added to the model along with tibia length to determine partial correlation coefficients, muscle CSA explained 35% of the variance in Zp, holding tibia length constant, while tibia length explained 42% of the variance in Zp, holding muscle CSA constant.
DISCUSSION
This is the first study to examine the independent contributions of bone length, muscle CSA, muscle torque, body weight, and physical activity on cortical bone geometry and vBMD assessed by pQCT in children, adolescents, and adults. This is also the first study to characterize the sex, race, and maturation effects on MSF over a wide age range. We found that MSF was lower in females compared to males and higher in blacks compared to whites, adjusted for age and tibia length. Further, we showed that determinants of mechanical load (muscle CSA, muscle torque, body weight, and physical activity) were all significantly and independently associated with cortical Zp, area, and periosteal circumference, adjusted for age, sex, race, tibia length, and Tanner stage. The mechanical load covariates were not associated with cortical vBMD and only muscle CSA was associated with endosteal circumference. Importantly, bone length is a significant independent predictor of bone outcomes in both the growing and the adult skeleton, independent of muscle CSA. The contribution of bone length to explained variance in bone outcomes was approximately equivalent to muscle CSA.
Our results demonstrated that failing to adjust Zp for tibia length could result in the interpretation that muscle CSA explains 85% of the variance in Zp in children and adolescents. In actuality, after accounting for tibia length, muscle CSA explained only 42% of the variability in Zp. Moreover, even though tibia length is less variable in adults, tibia length was a significant independent predictor of Zp, independent of muscle CSA. Thus, bone length is an important covariate when evaluating bone outcomes in both children and adults and should be an integral component of models evaluating the “functional muscle-bone unit” regardless of the age of the sample population. This is an issue in studies of healthy participants [24], and it becomes particularly imperative in the interpretation of outcomes in clinical populations [25]. For example, Burnham et al. previously reported that in patients with juvenile idiopathic arthritis (JIA), failing to adjust for age and tibia length suggested that patients with JIA had greater Zp compared to healthy controls. However, when age and tibia length were accounted for, (1) Zp was significantly lower in JIA, (2) age and tibia length were both independently and significantly associated with Zp, and (3) a greater proportion of the variance in Zp was explained. This example underscores the importance of bone length is a determinant of bone geometry, independent of muscle size. Our results confirm this finding and demonstrate that bone length should be accounted for in the interpretation of bone outcomes in participants of all ages.
Sex and Race Differences in Muscle Specific Force
There is an overall paucity of studies exploring MSF in children and adults. Our finding of lower MSF in females compared to males, independent of bone length, is consistent with a previous study in children. Kanehisa et al. reported lower MSF in girls compared to boys (n = 60, age 6 to 9 years) evaluated by isokinetic dynamometry (muscle torque) and ultrasonography (muscle CSA) of the thigh [26]. Further, their sample included adults (n = 71, age 18 to 25 years) and they observed lower MSF in the female adults compared to males. Our findings are similar to their study even though we assessed isometric dynamometry of the dorsiflexors at the ankle and their assessment was isokinetic dynamometry of the knee extensors. Like the present study, the sex difference was independent of limb length. Other studies have also suggested that adult females have lower MSF compared to males [27, 28], but some have shown no sex differences [27, 29, 30]. The studies that report no sex difference did not account for limb length and/or assessed sex differences in MSF of the upper body (forearm isometric grip force or isokinetic dynamometry of the elbow flexors and extensors). The studies that reported lower MSF in women compared to men did not account for sex differences in limb length. Thus, the present study is the first to report sex differences across a wide age range with proper adjustment for limb length in the analyses.
We also found that MSF is greater in blacks compared to whites, independent of limb length. In contrast to our finding, Goodpaster et al. reported that elderly whites have greater muscle specific force, assessed by isokinetic dynamometry of the knee extensors, compared to elderly blacks [28]. It is not known whether there is a difference in skeletal muscle physiology that could explain the greater force generating capacity of the muscle relative to the muscle size in the black participants in this study. However, it is possible that race differences in muscle fiber type could explain the greater muscle specific force in blacks compared to whites [31]. The sex and race differences observed in the present study were not explained by physical activity.
Determinants of Bone Geometry
The analyses presented are based on a subset from our previous study in 665 participants [16], as muscle torque data were only available in 321 participants. In this subset, we were still able to show a significantly greater Zp in black participants compared to whites that was not explained by muscle CSA alone. Interestingly, independent of the greater MSF in blacks observed in the present study, the greater Zp among black participants persisted. Further, the race difference persisted when other sources of mechanical load were included in the model (body weight and physical activity), suggesting that mechanical load does not explain race differences in bone geometry. The findings were similar for periosteal circumference and bone area, however, only muscle CSA was associated with endosteal circumference. This suggests mechanical loading does not determine endosteal circumference, in contrast to the significant role of loading on the periosteal surface. Of note, the mechanical load covariates were not associated with vBMD, unlike previous studies using DXA areal-BMD measures. Since the load covariates did not explain a substantial proportion of the variance in addition to muscle CSA, we propose that muscle CSA is an adequate surrogate of the mechanical load on bone in healthy participants.
Limitations
The primary limitation of this study of the development of the functional muscle bone unit is the cross-sectional design. This precludes any conclusions regarding the causal relations between measures of biomechanical loading and bone outcomes. In addition, the study had limited power to detect significant differences in muscle-bone relations in the mature versus growing skeleton. There are several characteristics of skeletal muscle architecture, including muscle fiber type and tendon length, that were not assessed in the present study and could contribute to differences in muscle specific force. Further, we did not assess neural activation of motor units and, independent of muscle size, this could differ between males versus females and blacks versus whites. Another potential limitation is that the muscle torque measurements utilized in this study were from isometric dynamometry, so we were unable to differentiate between concentric and eccentric contraction types [32] and their contribution to bone geometry. It has been suggested that measurements from ground reaction forces, such as mechanography [33], may better represent the mechanical forces that long bones endure, but whether peak jumping force can better describe bone geometry than muscle size alone has not been studied to our knowledge. Lastly, accelerometry measures were not assessed in the present study and could have more accurately described participants’ levels of physical activity.
Conclusion
In summary, these data demonstrated sex and race differences in skeletal muscle force generating capacity, independent of muscle size, in healthy children, adolescents, and adults. These differences in muscle specific force did not explain sex and race differences in bone geometry. Different types of mechanical load may contribute to bone geometry and we demonstrated that muscle size, muscle strength, body weight, and physical activity are each independently and significantly associated with bone geometry. Importantly, in healthy participants, muscle size alone is an adequate surrogate for describing the mechanical load on bone. These findings are likely not applicable to patients with myopathies or dystrophies, and further studies are needed to assess MSF and the muscle-bone unit in childhood chronic diseases potentially affecting muscle size and function. Finally, bone length is a significant determinant of bone geometry, independent of muscle size, and should be accounted for when describing bone outcomes regardless of the age of the participants.
Acknowledgments
We greatly appreciate the dedication and enthusiasm of the children and their families who participated in this study. We also acknowledge the contribution of the Clinical Translational Research Center Nutrition Core staff for their contribution to data acquisition.
Funding Sources: NIH R01-DK060030, R01-HD040714, K24-DK076808, R01-DK064966 and UL1-RR-024134 from the National Center for Research Resources.
Footnotes
Publisher's Disclaimer: This is a PDF file of an unedited manuscript that has been accepted for publication. As a service to our customers we are providing this early version of the manuscript. The manuscript will undergo copyediting, typesetting, and review of the resulting proof before it is published in its final citable form. Please note that during the production process errors may be discovered which could affect the content, and all legal disclaimers that apply to the journal pertain.
Contributor Information
Rachel J. Wetzsteon, Email: wetzsteonr@email.chop.edu.
Babette S. Zemel, Email: zemel@email.chop.edu.
Justine Shults, Email: jshults@mail.med.upenn.edu.
Krista M. Howard, Email: khoward@email.chop.edu.
Lucy W. Kibe, Email: kibe@email.chop.edu.
Mary B. Leonard, Email: leonard@email.chop.edu.
References
- 1.Doyle F, Brown J, Lachance C. Relation between bone mass and muscle weight. Lancet. 1970;1:391–3. doi: 10.1016/s0140-6736(70)91520-5. [DOI] [PubMed] [Google Scholar]
- 2.Burr DB. Muscle strength, bone mass, and age-related bone loss. J Bone Miner Res. 1997;12:1547–51. doi: 10.1359/jbmr.1997.12.10.1547. [DOI] [PubMed] [Google Scholar]
- 3.Schoenau E, Frost HM. The “muscle-bone unit” in children and adolescents. Calcif Tissue Int. 2002;70:405–7. doi: 10.1007/s00223-001-0048-8. Epub 2002 Apr 19. [DOI] [PubMed] [Google Scholar]
- 4.Turner CH, Pavalko FM. Mechanotransduction and functional response of the skeleton to physical stress: the mechanisms and mechanics of bone adaptation. J Orthop Sci. 1998;3:346–55. doi: 10.1007/s007760050064. [DOI] [PubMed] [Google Scholar]
- 5.Lu TW, Taylor SJ, O’Connor JJ, Walker PS. Influence of muscle activity on the forces in the femur: an in vivo study. J Biomech. 1997;30:1101–6. doi: 10.1016/s0021-9290(97)00090-0. [DOI] [PubMed] [Google Scholar]
- 6.Wetzsteon RJ, Petit MA, Macdonald HM, Hughes JM, Beck TJ, McKay HA. Bone structure and volumetric BMD in overweight children: a longitudinal study. J Bone Miner Res. 2008;23:1946–53. doi: 10.1359/jbmr.080810. [DOI] [PubMed] [Google Scholar]
- 7.Frost HM, Schonau E. The “muscle-bone unit” in children and adolescents: a 2000 overview. J Pediatr Endocrinol Metab. 2000;13:571–90. doi: 10.1515/jpem.2000.13.6.571. [DOI] [PubMed] [Google Scholar]
- 8.Daly RM, Saxon L, Turner CH, Robling AG, Bass SL. The relationship between muscle size and bone geometry during growth and in response to exercise. Bone. 2004;34:281–7. doi: 10.1016/j.bone.2003.11.009. [DOI] [PubMed] [Google Scholar]
- 9.Bamman MM, Newcomer BR, Larson-Meyer DE, Weinsier RL, Hunter GR. Evaluation of the strength-size relationship in vivo using various muscle size indices. Med Sci Sports Exerc. 2000;32:1307–13. doi: 10.1097/00005768-200007000-00019. [DOI] [PubMed] [Google Scholar]
- 10.Petit MA, Beck TJ, Shults J, Zemel BS, Foster BJ, Leonard MB. Proximal femur bone geometry is appropriately adapted to lean mass in overweight children and adolescents. Bone. 2005;36:568–76. doi: 10.1016/j.bone.2004.12.003. [DOI] [PubMed] [Google Scholar]
- 11.Morse CI, Tolfrey K, Thom JM, Vassilopoulos V, Maganaris CN, Narici MV. Gastrocnemius muscle specific force in boys and men. J Appl Physiol. 2008;104:469–74. doi: 10.1152/japplphysiol.00697.2007. [DOI] [PubMed] [Google Scholar]
- 12.Reeves ND, Narici MV, Maganaris CN. Effect of resistance training on skeletal muscle-specific force in elderly humans. J Appl Physiol. 2004;96:885–92. doi: 10.1152/japplphysiol.00688.2003. [DOI] [PubMed] [Google Scholar]
- 13.McNitt-Gray JL. Kinetics of the lower extremities during drop landings from three heights. J Biomech. 1993;26:1037–46. doi: 10.1016/s0021-9290(05)80003-x. [DOI] [PubMed] [Google Scholar]
- 14.Pavy-Le Traon A, Heer M, Narici MV, Rittweger J, Vernikos J. From space to Earth: advances in human physiology from 20 years of bed rest studies (1986-2006) Eur J Appl Physiol. 2007;101:143–94. doi: 10.1007/s00421-007-0474-z. [DOI] [PubMed] [Google Scholar]
- 15.Wetzsteon RJ, Hughes JM, Kaufman BC, Vazquez G, Stoffregen TA, Stovitz SD, Petit MA. Ethnic differences in bone geometry and strength are apparent in childhood. Bone. 2009;44:970–5. doi: 10.1016/j.bone.2009.01.006. [DOI] [PubMed] [Google Scholar]
- 16.Leonard MB, Elmi A, Mostoufi-Moab S, Shults J, Burnham JM, Thayu M, Kibe L, Wetzsteon RJ, Zemel BS. Effects of sex, race, and puberty on cortical bone and the functional muscle bone unit in children, adolescents, and young adults. J Clin Endocrinol Metab. 2010;95:1681–9. doi: 10.1210/jc.2009-1913. [DOI] [PMC free article] [PubMed] [Google Scholar]
- 17.Ogden CL, Kuczmarski RJ, Flegal KM, Mei Z, Guo S, Wei R, Grummer-Strawn LM, Curtin LR, Roche AF, Johnson CL. Centers for Disease Control and Prevention 2000 growth charts for the United States: improvements to the 1977 National Center for Health Statistics version. Pediatrics. 2002;109:45–60. doi: 10.1542/peds.109.1.45. [DOI] [PubMed] [Google Scholar]
- 18.Tanner JM, Whitehouse R, Marshall W, Healy M, Goldstein H. Assessment of Skeletal Maturity and Prediction of Adult Height (TW2 Method) London, England: Academic Press; 1975. [Google Scholar]
- 19.Morris NN, Udry JR. Validation of a self-administered instrument to assess stage of adolescent development. Journal of Youth and Adolescence. 1980;9:271–280. doi: 10.1007/BF02088471. [DOI] [PubMed] [Google Scholar]
- 20.Aaron DJ, Kriska AM, Dearwater SR, Cauley JA, Metz KF, LaPorte RE. Reproducibility and validity of an epidemiologic questionnaire to assess past year physical activity in adolescents. Am J Epidemiol. 1995;142:191–201. doi: 10.1093/oxfordjournals.aje.a117618. [DOI] [PubMed] [Google Scholar]
- 21.Kemper HC, Bakker I, Twisk JW, van Mechelen W. Validation of a physical activity questionnaire to measure the effect of mechanical strain on bone mass. Bone. 2002;30:799–804. doi: 10.1016/s8756-3282(02)00709-3. [DOI] [PubMed] [Google Scholar]
- 22.Liu D, Manske SL, Kontulainen SA, Tang C, Guy P, Oxland TR, McKay HA. Tibial geometry is associated with failure load ex vivo: a MRI, pQCT and DXA study. Osteoporos Int. 2007;18:991–7. doi: 10.1007/s00198-007-0325-0. [DOI] [PubMed] [Google Scholar]
- 23.Leggin BG, Neuman RM, Iannotti JP, Williams GR, Thompson EC. Intrarater and interrater reliability of three isometric dynamometers in assessing shoulder strength. J Shoulder Elbow Surg. 1996;5:18–24. doi: 10.1016/s1058-2746(96)80026-7. [DOI] [PubMed] [Google Scholar]
- 24.Schonau E, Werhahn E, Schiedermaier U, Mokow E, Schiessl H, Scheidhauer K, Michalk D. Influence of muscle strength on bone strength during childhood and adolescence. Horm Res. 1996;45(Suppl 1):63–6. doi: 10.1159/000184834. [DOI] [PubMed] [Google Scholar]
- 25.Burnham JM, Shults J, Dubner SE, Sembhi H, Zemel BS, Leonard MB. Bone density, structure, and strength in juvenile idiopathic arthritis: importance of disease severity and muscle deficits. Arthritis Rheum. 2008;58:2518–27. doi: 10.1002/art.23683. [DOI] [PMC free article] [PubMed] [Google Scholar]
- 26.Kanehisa H, Ikegawa S, Tsunoda N, Fukunaga T. Strength and cross-sectional area of knee extensor muscles in children. Eur J Appl Physiol Occup Physiol. 1994;68:402–5. doi: 10.1007/BF00843736. [DOI] [PubMed] [Google Scholar]
- 27.Kanehisa H, Ikegawa S, Fukunaga T. Comparison of muscle cross-sectional area and strength between untrained women and men. Eur J Appl Physiol Occup Physiol. 1994;68:148–54. doi: 10.1007/BF00244028. [DOI] [PubMed] [Google Scholar]
- 28.Goodpaster BH, Carlson CL, Visser M, Kelley DE, Scherzinger A, Harris TB, Stamm E, Newman AB. Attenuation of skeletal muscle and strength in the elderly: The Health ABC Study. J Appl Physiol. 2001;90:2157–65. doi: 10.1152/jappl.2001.90.6.2157. [DOI] [PubMed] [Google Scholar]
- 29.Maughan RJ, Watson JS, Weir J. Strength and cross-sectional area of human skeletal muscle. J Physiol. 1983;338:37–49. doi: 10.1113/jphysiol.1983.sp014658. [DOI] [PMC free article] [PubMed] [Google Scholar]
- 30.Neu CM, Rauch F, Rittweger J, Manz F, Schoenau E. Influence of puberty on muscle development at the forearm. Am J Physiol Endocrinol Metab. 2002;283:E103–7. doi: 10.1152/ajpendo.00445.2001. [DOI] [PubMed] [Google Scholar]
- 31.Ama PF, Simoneau JA, Boulay MR, Serresse O, Theriault G, Bouchard C. Skeletal muscle characteristics in sedentary black and Caucasian males. J Appl Physiol. 1986;61:1758–61. doi: 10.1152/jappl.1986.61.5.1758. [DOI] [PubMed] [Google Scholar]
- 32.Frank AW, Lorbergs AL, Chilibeck PD, Farthing JP, Kontulainen SA. Muscle cross sectional area and grip torque contraction types are similarly related to pQCT derived bone strength indices in the radii of older healthy adults. J Musculoskelet Neuronal Interact. 2010;10:136–41. [PubMed] [Google Scholar]
- 33.Fricke O, Weidler J, Tutlewski B, Schoenau E. Mechanography--a new device for the assessment of muscle function in pediatrics. Pediatr Res. 2006;59:46–9. doi: 10.1203/01.pdr.0000191580.07644.1c. [DOI] [PubMed] [Google Scholar]