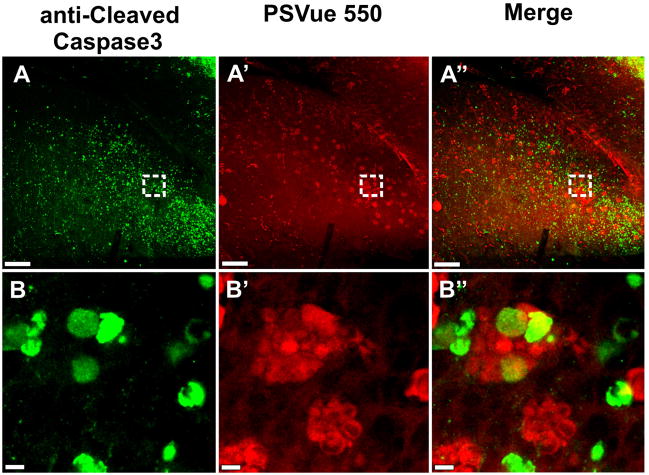
Fig. 8.
Staining with anti-cleaved caspase 3 and PSVue of the cerebellum of an E12.5 Foxg1-cre:: Dicer1 f/f CKO mouse shows widespread caspase 3 upregulation throughout the cerebellum (A). Staining for phosphatidylserine with PSVue shows an overlapping distribution of cells in possibly different stages of degeneration (A′, A″). Higher power images show that anti-cleaved caspase 3-positive cells are mostly individually distributed (B) whereas the PSVue labeled cells are mostly aggregated (B′). Combined imaging shows that either labeling is rarely overlapping with the other, or if they do, both stain weakly (B″). This suggests that either stain reveals cells at different stages of degeneration with the PSVue dye showing presumably cells already ingested by activated microglia cells that turned into macrophages. Bar indicates 100μm A-A″ and 5μm B-B″.

