

Localized correlated spectroscopy, which was performed in vivo in patients with glioblastoma multiforme and healthy control subjects at 3.0 T by using a 32-channel head coil with an optimized acquisition protocol and postprocessing parameters, was performed in 11 minutes—a clinically acceptable time.
Abstract
Purpose:
To develop an in vivo two-dimensional localized correlation spectroscopy technique with which to monitor the biochemistry of the human brain and the pathologic characteristics of diseases in a clinically applicable time, including ascertainment of appropriate postprocessing parameters with which to allow diagnostic and prognostic molecules to be measured, and to investigate how much of the chemical information, known to be available from malignant cultured cells, could be recorded in vivo from human brain.
Materials and Methods:
The study was approved by the institutional review board and was compliant with HIPAA. With use of a 3.0-T clinical magnetic resonance (MR) unit and a 32-channel head coil, localized correlation spectroscopy was performed in six healthy control subjects and six patients with glioblastoma multiforme (GBM) with an acquisition time of 11 minutes. Two-dimensional spectra were processed and analyzed and peak volume ratios were tabulated. The data used were proved to be normally distributed by passing the Shapiro-Wilk normality test. The first row of the spectra was extracted to examine diagnostic features. The pathologic characteristics and grade of each GBM were determined after biopsy or surgery. Statistically significant differences were assessed by using a t test.
Results:
The localized correlation spectroscopy method assigned biochemical species from the healthy human brain. The correlation spectra of GBM were of sufficiently high quality that many of the cross peaks, recorded previously from malignant cell models in vitro, were observed, demonstrating a statistically significant difference (P < .05) between the cross peak volumes measured for healthy subjects and those with GBM (which include lipid, alanine, N-acetylaspartate, γ-aminobutyric acid, glutamine and glutamate, glutathione, aspartate, lysine, threonine, total choline, glycerophosphorylcholine, myo-inositol, imidazole, uridine diphosphate glucose, isocitrate, lactate, and fucose). The first row of the spectra was found to contain diagnostic features.
Conclusion:
Localized correlation spectroscopy of the human brain at 3.0 T with use of a 32-channel head coil was performed in 11 minutes and provided information about neurotransmitters, metabolites, lipids, and macromolecules. The method was able to help differentiate healthy brain from the biochemical signature of GBM in vivo. This method may, in the future, reduce the need for biopsy and is now applicable for the study of selected neurologic diseases.
© RSNA, 2011
Introduction
Gliomas are primary brain tumors that infiltrate normal brain, often appearing to have no particular “margin” on magnetic resonance (MR) images. Primary brain tumors are classified according to their appearance under the microscope; there are four grades of glioma, with glioblastoma multiforme (GBM) being the highest. Currently, biopsy is required to confirm the nature of a glioma. One-dimensional (1D) MR spectroscopy of the brain has been shown to enable the delineation of glioma from other types of brain tumors by means of an increased choline-to-creatine ratio, the presence of lactate, and an increase in myo-inositol and lipid concentration with the concomitant reduction or absence of the N-acetylaspartate (NAA) resonance (1–7).
Jean Jeener introduced two-dimensional (2D) Fourier nuclear MR spectroscopy (8) with a two-pulse sequence: 90°x−t1−90°x−Acq(t2), which, after 2D Fourier transformation, produces a 2D spectrum. The importance of this discovery was realized by Aue et al (9), who developed it further; the method became known as correlation spectroscopy or COSY. A correlation spectroscopy data set is a series of 1D spectra, each with increments in delay (t1) inserted before the terminal readout 90° radiofrequency (RF) pulse. The series of 1D free induction decays are Fourier transformed along the first dimension in t2 (fixed time delay), followed by another Fourier transformation in t1. This generates a 2D correlation spectrum containing diagonal and off-diagonal (cross) peaks. Each cross peak indicates the presence of scalar coupling between the two protons it connects on the diagonal.
The 2D correlation spectroscopy method was first applied to cells in 1984 (10), healthy animal tissue in 1988 (11), diseased and healthy human tissue in 1993 (12), human brain in vivo in 1994 (13), and human immune deficiency in vivo in 2008 (14). The first “localized” in vivo correlation spectroscopy examination of the human brain was performed at 2.0 T in 1994 and took 102 minutes with a 240-cm3 region of interest (13). Independently in 2001, Thomas et al (15) refined this method by acquiring spectra in 35 minutes with use of a 27-cm3 region of interest and a 3.0-inch surface coil at 1.5 T; Ziegler et al (16) used the method to acquire spectra in vivo in 34 minutes by using a quadrature transceiver coil and a 27-cm3 region of interest at 3.0 T.
The neurochemicals reported to date in the 1D proton MR spectra are described by Danielsen and Ross (17) and Govindaraju et al (18). They are reported for cells and tissues in a recent review (19).
The goal for the current study was to utilize in vivo 2D localized correlation spectroscopy to monitor the biochemistry of the human brain and the pathologic characteristics of diseases such as GBM in a clinically applicable time. This development includes ascertaining the appropriate postprocessing parameters with which to allow metabolites to be measured. We also wished to investigate how much of the chemical information, known to be available from malignant cultured cells, could be recorded in vivo from the human brain.
Materials and Methods
Participants
This prospective study took place between May and September 2009 (control subjects) and between September and November 2009 (patients with GBM). This study was approved by the local institutional review board and was compliant with the Health Insurance Portability and Accountability Act. Six patients with GBM and six control subjects were recruited at Massachusetts General Hospital. Patients were referred by the neuro-oncology department at Massachusetts General Hospital and selected by A.G.S., a radiologist with more than 20 years of experience. GBM was diagnosed with routine histopathologic examination in the selected patients before the MR spectroscopy investigation. Patients were included if the tumor had a minimum diameter of 1.0 cm as measured with contrast material–enhanced T1-weighted MR imaging. Patients were excluded if tumors were positioned close to air-filled sinuses (eg, tumors were close to the sinuses of the frontal, ethmoid, and temporal bones) or if motion artifacts were seen on images. Eight patients (median age ± standard deviation, 59.5 years ± 6.5) were initially included in the study; two subjects were excluded because of motion during imaging.
Localized Correlation Spectroscopy
Localized correlation spectroscopy was performed with a TIM Trio unit (model VB17A; Siemens, Erlangen, Germany) equipped with a commercially available 32-channel receive-only head coil (Siemens). Spectroscopy was performed by O.C.A. (a physician and physicist with 10 years of experience) and S.R. (a biophysicist with more than 10 years of experience). Before undergoing spectroscopy, patients were imaged with an MR imaging protocol that included T2-weighted three-dimensional turbo spin-echo imaging with variable flip angle (repetition time = 3.2 seconds, echo time = 494 msec, section thickness = 0.9 mm).
The region of interest was chosen after contrast-enhanced T1-weighted imaging. Care was taken to include as much of the lesion as possible while avoiding the surrounding tissue. Localized shimming was performed with automatic adjustment of first- and second-order shim gradients by using the automatic three-dimensional B0 field mapping technique (Siemens). Automatic shim was then improved by manual adjustment of the above-mentioned shim gradients to achieve a magnitude peak width of water at half-maximum of 14 Hz or less (19). After frequency adjustment, water-selective suppression was optimized by using the water suppression enhanced through T1 effects (WET) technique (20).
The localized correlation spectroscopy sequence (90°−180°−t1−90°) used herein is made out of three shaped and spatially selective RF pulses and was performed by S.R. (a biophysicist with more than 10 years of experience). This is the minimum number of RF pulses that can be used for localization. RF shapes can be sinc, Shinnar-Le Roux, or any section-selective pulse with suitable spectral bandwidth. In this study, the excitation pulses were sinc RF pulses and the 180° RF pulses were optimized Mao pulses (21). The first two RF pulses generate a spin echo, and the third RF pulse acts as a spatially selective and coherence transfer pulse. The RF pulse duration was 2.6 msec for the sinc-shaped 90° pulse and 4.6 msec for the Mao-shaped 180° pulse (21). These settings are different from those originally implemented by Thomas et al (15), where Shinnar-Le Roux pulses for all RF pulses along with a 3.0-inch surface coil were used. The localized pulse sequence used with correlation spectroscopy has only one incremented delay, t1, between the second and third RF pulses. Even though the sequence localizes in a single shot, a phase cycle that eliminates all signals except the desired echo was used. The number of increments determines desired resolution along the vertical frequency axis (F1 domain), whereas the number of averages determines signal-to-noise ratio. Data received by the 32-channel head coil were constructively combined to improve the signal-to-noise ratio by using residual water signal and relative channel weighting, as described by Brown (22).
The spectroscopy sequence was applied with an initial echo time of 30 msec, repetition time of 1.25 seconds, and eight averages per increment. The voxel size was manually adjusted to contain predominantly GBM tissue, the spectral width in the horizontal frequency axis (F2 domain) was 2000 Hz, the t1 increment size was 0.8 msec, the indirect spectral width used was 1250 Hz, and the number of increments was 64. The WET water-suppression method (20) was applied before the acquisition sequence. The acquisition time was 11 minutes.
Data Processing
Data processing was performed by C.E.M. (a spectroscopist with more than 30 years of experience), S.R., P.S. (a biophysicist with more than 15 years of experience), and A.P.L. (a biochemist and radiation therapist with more than 4 years of experience). Because there is no suitable software on the commercial unit to process 2D MR spectroscopy data, the raw spectroscopy data from the unit were transferred to Matlab (Mathworks, Natick, Mass), a numerical computing environment (23), for signal combination from multiple elements followed by row concatenation into a 2D matrix and reformatting. Felix, a specialized and commercial 2D nuclear MR processing software (24), was used for spectral processing and analysis.
The processing parameters were deduced by testing a range of parameters as described by Delikatny et al (25) to produce a correlation spectroscopy data set that was comparable with those recorded for cell suspensions. The data were postprocessed to maximize visibility of those molecules with intermediate and long T2 values. This inherently reduces the contribution of lipid to the resultant spectrum (25).
The processing parameters used for the F2 domain for both healthy brain and GBM were as follows: skewed sine-squared window, 2048 points, and magnitude reconstruction. The processing parameters for the F1 domain for both healthy brain and GBM were as follows: sine-squared window, linear prediction to 90 points, zero-filling to 512 points, and magnitude reconstruction. The creatine methyl resonance at 3.02 ppm was used as an internal chemical shift reference in F1 and F2 (18). All cross peaks are reported as F2-F1 peaks in parts per million.
Statistical Analysis of Cross and Diagonal Peaks
Cross and diagonal peak volumes were measured by using the Felix software, with the creatine diagonal peak at 3.02 ppm as the internal reference for both chemical shift and volume. The statistical significance of all assigned cross and diagonal peaks was calculated by S.R. with use of a t test, and those metabolites with P < .05 are delineated in the Table. The data used for the t test were considered to be normally distributed by passing the Shapiro-Wilk normality test (26). The present statistical findings were presented “as is” without any correction (eg, Bonferroni correction) (27) owing to possible substantial loss in the precision of results due to small sample size. Thus, assuming a mean correlation value of 0 (independent samples), a total of six tests, and an α (probability of error per test) value of .05, the chance of finding one or more significant differences in six tests without Bonferroni correction will be 26.5%.
Resonance Assignments for Human Brain and Glioma (Grade IV) at 3.0-T Localized Correlation Spectroscopy and an in Vitro Human Cell Line at 8.5 T
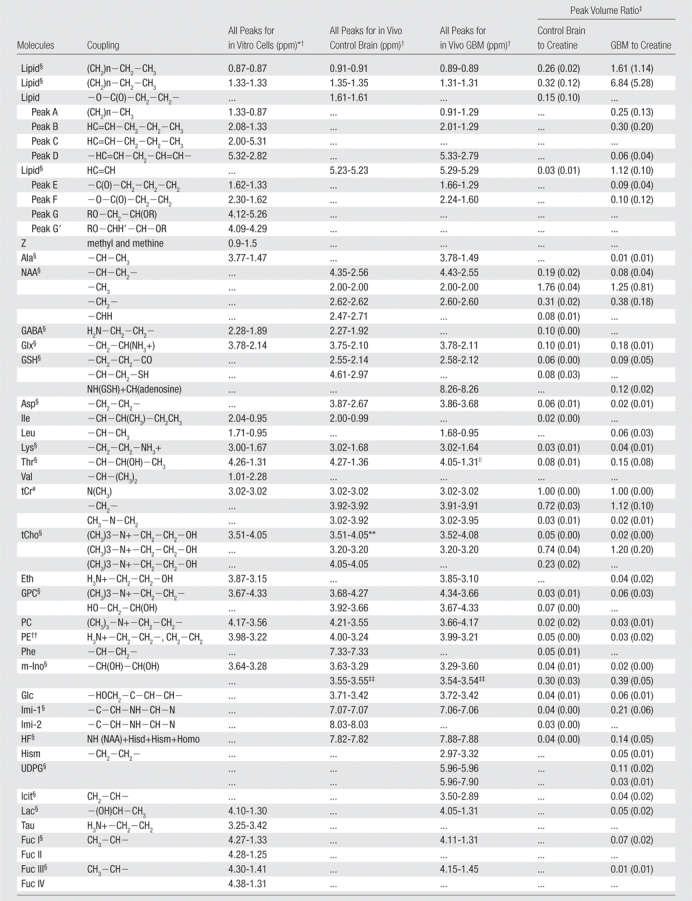
Note.—Ala = alanine; Asp = aspartate; Eth = ethanolamine; Fuc = fucose; GABA = g -aminobutyric acid; Glc = glucose; Glx = glutamate and glutamine; GPC = glycerophosphocholine; GSH = glutathione; HF = high-frequency peak from NAA amine group and imidazole from histamine and histadine; Hism = histamine; Icit = isocitrate; Ile = isoleucine; Imi-1 = imidazole from histamine, histadine, and homocarnosine; Imi-2 = imidazole from histamine and homocarnosine; Lac = lactate; Leu = leucine; Lys = lysine/polyamine; Meth = methionine; m-Ino = myo -inositol; PC = phosophocholine; PE = phosphoethanolamine; Phe = phenylalanine; Tau = taurine; tCho = total choline; tCr = total creatine; Thr = threonine; Tryp = tryptophan; Tyr = tyrosine; UDPG = uridine diphosphate glucose; Val = valine; Z = cholesterol.
Cross peaks are given as F2-F1 peaks.
Numbers in parentheses are standard deviations.
Data were found to be significantly different (P < .05).
Includes lactate.
Used as an internal reference.
Also includes myo-inositol.
Includes histadine, phenylalanine, and tyrosine.
Also includes total creatine.
Results
At 3.0 T and with use of a 32-channel head coil and the experimental conditions described earlier, localized correlation spectroscopy was performed in 11 minutes. A typical 2D localized correlation spectrum of a GBM is shown in Figure 1; the spectral assignments are summarized in the Table. Peak volume ratios, referenced to the creatine diagonal peak, are also summarized in the Table. The spectroscopic data were postprocessed to maximize the visibility of those molecules with intermediate and long T2 values (eg, amino acids, NAA, aspartate, glutamate and glutamine, lactate, and the cell surface fucosylated species) (Table). With these postprocessing parameters (see Materials and Methods), the lipid cross peaks A, B, E, and F (see Table for chemical shifts) are only just visible above the noise level (25). If a different postprocessing method was used (ie, to enhance those molecules with a short T2), the lipid cross peaks would be clearly visible (not shown) (25).
Figure 1:

Localized correlation spectrum in a 68-year-old patient with GBM. Spectroscopy was performed at 3.0 T by using a 32-channel head coil and a voxel size (shown in inset) of 25 × 25 × 20 mm3, increment size of 0.8 msec, 64 increments, eight averages per increment, repetition time of 1.25 seconds, total experimental time of 11 minutes, acquired vector of 1024 points, acquisition time of 512 msec, spectral width in F2 of 2000 Hz, and spectral width in F1 of 1250 Hz. In this case, the tumor filled the entire voxel; hence, the contribution from normal brain tissue is minimal. A summary of assignments and volumes of diagonal resonances and cross peaks is shown in the Table. Cr = creatine, Fuc = fucose, Glx = glutamate and glutamine, GPC = glycerophosphocholine, Icit = isocitrate, Lac = lactate, Lys = lysine/polyamine, PC = phosphocholine, Tau = taurine.
A typical 2D correlation spectrum of healthy brain (processed as in Fig 1) is shown in Figure 2. The spectral assignments and peak volume ratios are also listed for comparison in the Table. A major difference from the localized correlation spectrum of the glioma is the presence of strong cross peaks from NAA at 4.35-2.56 ppm, γ-aminobutyric acid (the major inhibitory neurotransmitter) at 1.89-2.28 ppm, aspartate at 3.87-2.67 ppm, and glutamine plus the excitatory neurotransmitter glutamate at 2.14-2.45 and 2.14–3.78 ppm.
Figure 2:

Localized correlation spectrum in a 42-year-old healthy volunteer. Spectroscopy was performed at 3.0 T by using a 32-channel head coil, voxel size (voxel placement was in the occipital lobe) of 30 × 30 × 30 mm3, increment size of 0.8 msec, 64 increments, eight averages per increment, repetition time of 1.25 seconds, total experimental time of 11 minutes, acquired vector of 1024 points, acquisition time of 512 msec, spectral width in F2 of 2000 Hz, and spectral width in F1 of 1250 Hz. A summary of assignments and volumes of diagonal resonances and cross peaks is shown in the Table. Asp = aspartate, Cho = choline, Cr = creatine, GABA = γ-aminobutyric acid, Glx = glutamate and glutamine, GSH = glutathione, His = histadine, m-Ino = myo-inositol, MM = macromolecules, PE = phenylalanine, Thr = threonine.
Cross peaks observed at 3.50-2.89 ppm in GBM spectra are tentatively assigned to isocitrate, a substrate of isocitrate dehydrogenase, constituting the first report in the spectra from GBM. There were no isocitrate cross peaks seen in 2D data from healthy control subjects.
A goal of this study was to ascertain which spectral characteristics, from these experimental in vivo conditions, were recorded previously from cultured malignant cells and biopsy specimens. In Figure 3, we compare the spectra obtained with 8.5-T 1D proton MR spectroscopy and correlation spectroscopy in a highly tumorigenic malignant colorectal cell line. As described earlier, the postprocessing conditions used for Figures 1 and 2 reduce the contribution to the lipid cross peaks (peaks A–F) but maximize those molecules with a longer T2.
Figure 3:

Spectra from 1D proton MR spectroscopy at 8.5 T (100 images) (top image) and symmetrized correlation spectroscopy (32 averages per increment, 220 increments) (bottom image; horizontal axis represents F2 domain, and vertical axis represents F1 domain) of LIM 1215 (highly tumorigenic) malignant colorectal cells. Data were obtained at 37°C. Line broadening of 3.0 Hz was applied to the 1D MR spectrum, and sine-bell and Lorentzian-gaussian (Lorentzian broadening = −30.0, gaussian broadening = 0.20) window functions were used in tl and t2 domains, respectively, for the data from correlation spectroscopy. Contour plots were generated with the lowest level set close to the noise level and subsequent levels increasing in powers of 2. A = lipid peak A, Ala = alanine, B = lipid peak B, C = lipid peak C, Chol = choline, F = lipid peak F, Fuc = fucose, G = lipid peak G, Glu/Glut = glutamate and glutamine, GPC = glycerophosphocholine, His = histadine, Ile = isoleucine, Inos = inositol, Lac = lactate, Leu = leucine, Lys = lysine/polyamine, PC = phosphocholine, Tau = taurine, Thr = threonine, Val = valine. (Reprinted, with permission, from reference 28.)
Of interest is a difference in the localized correlation spectra between patients with GBM and healthy control subjects (Figs 1, 2) in the methyl-methine coupling region CH(OH)−CH3 (F2: 1.00–1.60 ppm; F1: 3.90–4.50 ppm). In this region in healthy brain, only the amino acid threonine is visible. In the glioma, multiple resonances are seen and are compared in Figure 4 with low and high tumorigenic cell lines (28). These cross peaks are tentatively assigned in the Table to lactate, threonine, and a range of cell surface fucosylated species reported previously to be representative of loss of cellular differentiation (30) and hence a prognostic marker.
Figure 4:

Tentative assignments, for the localized correlation spectroscopy region (F2: 0.90–1.70 ppm; F1: 3.90–4.50 ppm) of the human glioblastoma, to lactate (Lac), threonine (Thr), and cell surface fucosylated moieties (Fuc I–IV) as reported previously from cultured cell lines (28,30–32). Horizontal axis represents F2 domain, and vertical axis represents F1 domain. Image A was obtained from the correlation spectrum of GBM in Figure 1. Image B was obtained from a highly tumorigenic colorectal LIM 1215 cell line. Image C was obtained from the low tumorigenic colorectal LIM 1863 cell line. Note that the expanded GBM has been rotated to allow direct comparison with the published data from in vitro correlation spectroscopy. (B and C were reprinted, with permission, from reference 28.)
When the cross peak volume ratios from healthy brain and GBM were compared, a statistical significance test (P < .05) showed lipid, alanine, NAA, γ-aminobutyric acid, glutamate and glutamine, glutathione, aspartate, lysine, threonine, total choline, glycerophosphorylcholine, myo-inositol, imidazole, uridine diphosphate glucose, isocitrate, lactate, and fucose to be statistically different between the healthy subjects and those with GBM (Table).
The first row of each localized correlation spectroscopy data set (acquired with an echo time of 30 msec), although not of the quality of a single-voxel spectrum collected with conventional means, is of sufficient quality to allow the differentiation of healthy brain from GBM on the basis of resonance ratios (19) (Fig 5). The spectra extracted from the first rows of the localized correlation spectra (Fig 5) might have a lesser signal-to-noise ratio and slightly broader line widths than their typical point-resolved spatially localized spectroscopy 1D counterparts owing to a smaller number of averages and magnitude calculation; however, the major diagnostic parameters are present.
Figure 5:

Typical first rows from localized correlation spectroscopy (echo time = 30 msec) in a patient with GBM (top) and a healthy control subject (bottom).
Discussion
The localized correlation spectra, acquired in vivo from patients with GBM and healthy control subjects at 3.0 T by using a 32-channel head coil with an optimized acquisition protocol and postprocessing parameters, were acquired in 11 minutes—a clinically acceptable time. The excellent signal-to-noise ratio of the in vivo GBM spectra allowed a comparison to be made with biologically well-documented cell lines grown in vitro. This comparison was unexpected. The method allowed each cross peak volume, referenced to creatine, to be recorded and healthy versus disease to be compared—demonstrating a statistically significant difference between the healthy and GBM cohorts for lipid, alanine, NAA, γ-aminobutyric acid, glutamate and glutamine, glutathione, aspartate, lysine, threonine, total choline, glycerophosphorylcholine, myo-inositol, imidazole, uridine diphosphate glucose, isocitrate, lactate, and fucose. It is anticipated that the additional biochemicals recorded and assigned with this method will further improve the existing 1D MR spectroscopy methods known to contribute to disease management and treatment decisions (7,33).
There remain two important issues to be addressed in the localized correlation spectroscopy method. The first is the spectral asymmetry. This occurs owing to the water-suppression technique WET (20), which operates by exciting the water region and spoiling it by using a magnetic field gradient pulse. Adjacent resonances can be affected by this suppression process. For example, NAA has a CH group that resonates at 4.4 ppm and is coupled to the ∼2.6-ppm CH2 group. When the CH is partially affected by water suppression, its magnetization correlation with the neighboring CH2 resonance is reduced. The CH2 moiety of the NAA is not affected and thus yields stronger cross peaks than does the CH group. If we assume a generic correlation spectroscopy pulse sequence of 90°x−t1−90°x−Acq(t2) and use product operator formalism (34), ignoring relaxation effects, the two symmetrical cross peaks arise from −sin (ω1 t1) sin (π J t1) I1z I2y and −sin (ω2 t1) sin (π J t1) I1y I2z, where ω and I are chemical shift and vector operators, respectively, and J is the scalar coupling constant. Thus, if spin 2 resonates closer to water resonance than spin 1, the signal expressed in the first equation will be weaker. This explains the asymmetry seen in localized correlation spectra acquired in this manner and is supported by the findings of Banakar et al (35), who report that asymmetry in localized correlation spectroscopy was not observed in a brain phantom when H2O was replaced by D2O.
The second important issue is the need, in the clinical environment, to minimize time in the imaging unit achieved by limiting the number of points to 64 along the vertical F1 dimension. This is in contrast to the acquisition of at least 1024 points in the F2 dimension. This undersampling along F1 leads to a coarse and low digitization that restricts the spectral resolution in that dimension. Linear prediction and zero-filling partially solve this problem. Nevertheless, the quality of a localized correlation spectrum of GBM compared well with the correlation spectrum obtained from cells at a higher field strength of 8.5 T, where 2048 points were collected in the F2 dimension and 220 points were collected in the F1 dimension. This can be attributed in part to the improved sensitivity of the 32-channel coil.
When comparing the results from the localized correlation spectroscopy method with those from previous 1D MR spectroscopy studies, there are several interesting biochemical features. Ganglioside ceramide was reported previously in GBM and assigned at 5.3 ppm (36). A distinctive molecular fragment in ceramides, RHC=CH−CH(OH)R, is expected to give rise to a cross peak at 5.3-3.9 ppm (37). This cross peak was absent from all localized correlation GBM spectra, rendering this assignment unlikely and exposing a weakness of 1D MR spectroscopy and strength of the 2D localized correlation MR spectroscopy method.
The (glutamate-glutamine)–to-creatine ratio in patients with GBM agrees with reports of higher levels of glutamate in the tumor than in peritumoral tissue (5), which is consistent with reports that GBM secretes large amounts of glutamate (38,39).
The genomic analysis of GBM reports recurrent mutations in the active site of isocitrate dehydrogenase 1 enzyme, which would lead to the accumulation of isocitrate and supports the assignment of isocitrate in the localized correlation spectra of GBM (40–43). In addition, threonine was recorded in the localized correlation spectra of all healthy volunteers but not in the GBM. This is consistent with findings that Akt, a serine-threonine phosphotransferase enzyme, is elevated in 80% of human GBM cases (44).
The comparison of the 0.90–1.70 ppm (F2) and 3.90–4.50 ppm (F1) regions of the localized correlation spectra from an in vitro model of tumorigenisis with the localized correlation spectra from GBM shows that the profiles are remarkably similar. From this, we have made tentative assignments of lactate, threonine, and fucosylated species. The chemical shifts of these molecules, however, are slightly different in vivo (Table). This may be explained by the fact that the intracellular pH in healthy tissue is more acidic than the extracellular pH is. This relationship is reversed in tumors, where intracellular pH is more basic than the extracellular pH (45,46). This pH effect was seen in localized correlation spectra of glioma, where the CH3 and CH groups of lactate are affected differently by pH variation (45,47).
The assignment of the fucosylated species in the GBM spectra obtained with localized correlation spectroscopy is important. A molecule(s) with a long T2 was identified at 1.33 ppm in the spectra from tumors with the capacity to spread (10). A candidate for this assignment was covalently linked fucose, which in the correlation spectrum generated H5-H6 cross peaks. The complexity of this spectral region (31) was altered with a reduction in cellular differentiation and accumulation of genetic alterations (30).
The methine group in fucose, scalar coupled to the methyl group, is adjacent to an oxygen atom that can be protonated to various degrees at different pH values. This moves the chemical shift of the CH group to lower frequency at more basic conditions. We tentatively assign fucose I, fucose II, and fucose IV to the cell surface fucosylated species in the 2D GBM spectra (30). Fucosylated glycoproteins are involved in cell-cell recognition, and the fundamental role of glycoconjugates in biologic processes is now appreciated (48). Because this spectral pattern was observed in localized correlation spectra from GBM, it would appear that this information is now available for inspection at 3.0 T.
This study had several limitations. The first, as discussed earlier, is the spectral asymmetry due to the water suppression technique. The second is the need, in the clinical environment, to minimize time in the imaging unit achieved by limiting the number of points to 64 along the vertical F1 dimension. The third is the type of 2D pulse sequence used (eg, constant time correlation spectroscopy vs variable time correlation spectroscopy). A further limitation is the small number of subjects in each category.
In conclusion, localized correlation spectroscopy of the brain, undertaken at 3.0 T by using a 32-channel head coil in 11 minutes, allows differences in metabolites between healthy brain and GBM to be recorded.
The spectral resolution of the localized correlation spectrum allowed a comparison with spectra recorded from malignant cultured cell lines. The localized correlation spectroscopy method is now applicable for the study of neurologic diseases.
Advances in Knowledge.
Two-dimensional localized correlation spectra can be acquired from the human brain, in vivo, in 11 minutes at 3.0 T.
The localized correlation spectroscopy method can unambiguously assign chemical information in the healthy human brain by separating those resonances that are composites in the one-dimensional spectrum along a second frequency; each cross peak, showing scalar coupling between protons on the diagonal, can be measured with statistical significance, enabling the healthy brain to be differentiated from disease.
The localized correlation spectroscopy method, when applied to the study of glioblastoma in vivo, provides similar findings to those recorded from cell culture models.
Implication for Patient Care.
The localized correlation spectroscopy method is applicable to the study of tumors in humans.
Disclosures of Potential Conflicts of Interest: S.R. Financial activities related to the present article: none to disclose. Financial activities not related to the present article: none to disclose. Other relationships: none to disclose. O.C.A. Financial activities related to the present article: none to disclose. Financial activities not related to the present article: none to disclose. Other relationships: none to disclose. P.S. Financial activities related to the present article: none to disclose. Financial activities not related to the present article: institution received grants or grants are pending from Harvard Catalyst and Draper Laboratory; institution receives money for travel to other sites for technical support or collaborative research from Siemens Healthcare; institution receives research funds from Siemens Healthcare. Other relationships: none to disclose. A.P.L. Financial activities related to the present article: none to disclose. Financial activities not related to the present article: institution received grants or grants are pending from Siemens Medical. Other relationships: none to disclose. A.G.S. Financial activities related to the present article: none to disclose. Financial activities not related to the present article: is on the board at ACR-Image Metrix; receives money for consultancy from BayerScheringPharma, Bristol Meyers Squibb, Biogenidec, Merrimack Pharmaceuticals, Olea Medical, Mitsubishi Pharma, GE Healthcare, Regeneron, Novartis, Roche, Siemens Medical, Takeda, and AstraZeneca; institution receives money for consultancy from Novartis, Roche, Takeda, and AstraZeneca; received money for expert testimony from Kit; institution received a grant or grants are pending from the Medical Research Council; receives payment for lectures including service on speakers bureaus from ACR-Image Metrix; has stock or stock options from Catalyst Medical and Breakaway Imaging. Other relationships: none to disclose. C.E.M. Financial activities related to the present article: none to disclose. Financial activities not related to the present article: institution has grants/grants pending from Harvard Catalyst; institution receives money for travel to other sites for technical support or to undertake research from Siemens Healthcare; institution receives research funds from Siemens Healthcare. Other relationships: none to disclose.
Acknowledgments
The authors thank the Australian Research Council for the Project Discovery Grant (DP0663987).
Received June 3, 2010; revision requested July 14; revision received October 12; accepted October 27; final version accepted December 15.
Supported by a Project Discovery Grant (DP0663987) from the Australian Research Council.
Funding: This research was supported by the National Institutes of Health (grant R01 1200-206456).
Abbreviations:
- GBM
- glioblastoma multiforme
- 1D
- one-dimensional
- RF
- radiofrequency
- 2D
- two-dimensional
- WET
- water suppression enhanced through T1 effects
References
- 1.Schupp DG, Merkle H, Ellermann JM, Ke Y, Garwood M. Localized detection of glioma glycolysis using edited 1H MRS. Magn Reson Med 1993;30(1):18–27 [DOI] [PubMed] [Google Scholar]
- 2.Li XJ, Jin H, Lu Y, Oh J, Chang S, Nelson SJ. Identification of MRI and 1H MRSI parameters that may predict survival for patients with malignant gliomas. NMR Biomed 2004;17(1):10–20 [DOI] [PubMed] [Google Scholar]
- 3.Oshiro S, Tsugu H, Komatsu F, et al. Quantitative assessment of gliomas by proton magnetic resonance spectroscopy. Anticancer Res 2007;27(6A):3757–3763 [PubMed] [Google Scholar]
- 4.Harting I, Hartmann M, Jost G, et al. Differentiating primary central nervous system lymphoma from glioma in humans using localised proton magnetic resonance spectroscopy. Neurosci Lett 2003;342(3):163–166 [DOI] [PubMed] [Google Scholar]
- 5.Tabatabaei P, Bergström P, Henriksson R, Bergenheim AT. Glucose metabolites, glutamate and glycerol in malignant glioma tumours during radiotherapy. J Neurooncol 2008;90(1):35–39 [DOI] [PubMed] [Google Scholar]
- 6.Weis J, Ring P, Olofsson T, Ortiz-Nieto F, Wikström J. Short echo time MR spectroscopy of brain tumors: grading of cerebral gliomas by correlation analysis of normalized spectral amplitudes. J Magn Reson Imaging 2010;31(1):39–45 [DOI] [PubMed] [Google Scholar]
- 7.Lin A, Bluml S, Mamelak AN. Efficacy of proton magnetic resonance spectroscopy in clinical decision making for patients with suspected malignant brain tumors. J Neurooncol 1999;45(1):69–81 [DOI] [PubMed] [Google Scholar]
- 8.Jeener AJ. Presented at the Ampere International Summer School, Basko Polje, Yugoslavia, 1971 [Google Scholar]
- 9.Aue WP, Bartholdi E, Ernst RR. Two-dimensional spectroscopy: application to nuclear magnetic resonance. J Chem Phys 1976;64(5):2229–2246 [Google Scholar]
- 10.Cross KJ, Holmes KT, Mountford CE, Wright PE. Assignment of acyl chain resonances from membranes of mammalian cells by two-dimensional NMR methods. Biochemistry 1984;23(25):5895–5897 [DOI] [PubMed] [Google Scholar]
- 11.Williams PG, Saunders JK, Dyne M, Mountford CE, Holmes KT. Application of a T2-filtered COSY experiment to identify the origin of slowly relaxing species in normal and malignant tissue. Magn Reson Med 1988;7(4):463–471 [DOI] [PubMed] [Google Scholar]
- 12.Delikatny EJ, Russell P, Hunter JC, et al. Proton MR and human cervical neoplasia: ex vivo spectroscopy allows distinction of invasive carcinoma of the cervix from carcinoma in situ and other preinvasive lesions. Radiology 1993;188(3):791–796 [DOI] [PubMed] [Google Scholar]
- 13.Brereton IM, Galloway GJ, Rose SE, Doddrell DM. Localized two-dimensional shift correlated spectroscopy in humans at 2 Tesla. Magn Reson Med 1994;32(2):251–257 [DOI] [PubMed] [Google Scholar]
- 14.Banakar S, Thomas MA, Deveikis A, Watzl JQY, Hayes J, Keller MA. Two-dimensional 1H MR spectroscopy of the brain in human immunodeficiency virus (HIV)–infected children. J Magn Reson Imaging 2008;27(4):710–717 [DOI] [PubMed] [Google Scholar]
- 15.Thomas MA, Yue K, Binesh N, et al. Localized two-dimensional shift correlated MR spectroscopy of human brain. Magn Reson Med 2001;46(1):58–67 [DOI] [PubMed] [Google Scholar]
- 16.Ziegler A, Gillet B, Belloeil JC, Macher JP, Decorps M, Nedelec JC. Localized 2D correlation spectroscopy in human brain at 3 T. MAGMA 2001;14(1):45–49 [DOI] [PubMed] [Google Scholar]
- 17.Danielsen E, Ross B. Magnetic resonance spectroscopy: diagnosis of neurological diseases New York, NY: Dekker, 1999 [Google Scholar]
- 18.Govindaraju V, Young K, Maudsley AA. Proton NMR chemical shifts and coupling constants for brain metabolites. NMR Biomed 2000;13(3):129–153 [DOI] [PubMed] [Google Scholar]
- 19.Mountford CE, Stanwell P, Lin A, Ramadan S, Ross B. Neurospectroscopy: the past, present and future. Chem Rev 2010;110(5):3060–3086 [DOI] [PubMed] [Google Scholar]
- 20.Ogg RJ, Kingsley PB, Taylor JS. WET, a T1- and B1-insensitive water-suppression method for in vivo localized 1H NMR spectroscopy. J Magn Reson B 1994;104(1):1–10 [DOI] [PubMed] [Google Scholar]
- 21.Mao J, Mareci TH, Andrew ER. Experimental study of optimal selective 180 degree radiofrequency pulses. J Magn Reson 1988;79(1):1–10 [Google Scholar]
- 22.Brown MA. Time-domain combination of MR spectroscopy data acquired using phased-array coils. Magn Reson Med 2004;52(5):1207–1213 [DOI] [PubMed] [Google Scholar]
- 23.MATLAB. http://www.mathworks.com/. Version 7.0.1.24704 (R14). Published January 2, 1994. Accessed July 2, 2010.
- 24.Accelrys Felix NMR. http://www.felixnmr.com/. Version 2007. Published January 15, 2007. Accessed July 2, 2010.
- 25.Delikatny EJ, Hull WE, Mountford CE. The effect of altering time domains and window functions in two-dimensional proton COSY spectra of biological specimens. J Magn Reson 1991;94(3):563–573 [Google Scholar]
- 26.Shapiro SS, Wilk MB. Analysis of variance test for normality (complete samples). Biometrika 1965;52:591–611 [Google Scholar]
- 27.Perneger TV. What’s wrong with Bonferroni adjustments. BMJ 1998;316(7139):1236–1238 [DOI] [PMC free article] [PubMed] [Google Scholar]
- 28.Lean CL, Mackinnon WB, Delikatny EJ, Whitehead RH, Mountford CE. Cell-surface fucosylation and magnetic resonance spectroscopy characterization of human malignant colorectal cells. Biochemistry 1992;31(45):11095–11105 [DOI] [PubMed] [Google Scholar]
- 29.Ramadan S, Mountford C. Two-dimensional magnetic resonance spectroscopy on biopsy and in vivo. In: Webb GA, ed. Annual Reports on NMR Spectroscopy. Burlington, Mass: Academic Press, 2009; 161–199 [Google Scholar]
- 30.Mackinnon WB, Huschtscha L, Dent K, Hancock R, Paraskeva C, Mountford CE. Correlation of cellular differentiation in human colorectal carcinoma and adenoma cell lines with metabolite profiles determined by 1H magnetic resonance spectroscopy. Int J Cancer 1994;59(2):248–261 [DOI] [PubMed] [Google Scholar]
- 31.Paraskeva C, Corfield AP, Harper S, Hague A, Audcent K, Williams AC. Colorectal carcinogenesis: sequential steps in the in vitro immortalization and transformation of human colonic epithelial cells (review). Anticancer Res 1990;10(5A):1189–1200 [PubMed] [Google Scholar]
- 32.Lean CL, Mackinnon WB, Mountford CE. Fucose in 1H COSY spectra of plasma membrane fragments shed from human malignant colorectal cells. Magn Reson Med 1991;20(2):306–311 [DOI] [PubMed] [Google Scholar]
- 33.Adamson AJ, Rand SD, Prost RW, Kim TA, Schultz C, Haughton VM. Focal brain lesions: effect of single-voxel proton MR spectroscopic findings on treatment decisions. Radiology 1998;209(1):73–78 [DOI] [PubMed] [Google Scholar]
- 34.Sorensen OW, Eich GM, Levitt MH, Bodenhausen G, Ernst RR. Product operator-formalism for the description of NMR pulse experiments. Prog NMR Spectrosc 1983;16:163–192 [Google Scholar]
- 35.Banakar S, Venkatraman T, Yue K, Binesh N, Thomas MA. Asymmetry of localized two-dimensional shift correlated MR spectroscopy. Proceedings of International Conference on Mathematics and Engineering Techniques in Medicine and Biological Sciences, Las Vegas, Nevada, 2002; 500–504 [Google Scholar]
- 36.Lombardi V, Valko L, Valko M, et al. 1H NMR ganglioside ceramide resonance region on the differential diagnosis of low and high malignancy of brain gliomas. Cell Mol Neurobiol 1997;17(5):521–535 [DOI] [PMC free article] [PubMed] [Google Scholar]
- 37.Reich HJ. Proton NMR chemical shifts. http://www.chem.wisc.edu/areas/reich/handouts/nmr-h/hdata.htm. Published September 20, 2005. Updated March 23, 2010. Accessed Febuary 1, 2010
- 38.van Vuurden DG, Yazdani M, Bosma I, et al. Attenuated AMPA receptor expression allows glioblastoma cell survival in glutamate-rich environment. PLoS One 2009;4(6):e5953. [DOI] [PMC free article] [PubMed] [Google Scholar]
- 39.Schunemann D, Grivicich I, Regner A, et al. Glutamate promotes cell growth by EGFR signaling on U-87MG human glioblastoma cell line. Pathol Oncol Res 2010;16(2):285–293 [DOI] [PubMed] [Google Scholar]
- 40.Parsons DW, Jones S, Zhang XS, et al. An integrated genomic analysis of human glioblastoma multiforme. Science 2008;321(5897):1807–1812 [DOI] [PMC free article] [PubMed] [Google Scholar]
- 41.Wishart DS, Knox C, Guo AC, et al. HMDB: a knowledgebase for the human metabolome. Nucleic Acids Res 2009;37(database issue):D603–D610 [DOI] [PMC free article] [PubMed] [Google Scholar]
- 42.Yan H, Parsons DW, Jin GL, et al. IDH1 and IDH2 mutations in gliomas. N Engl J Med 2009;360(8):765–773 [DOI] [PMC free article] [PubMed] [Google Scholar]
- 43.Yan H, Parsons DW, Jin GL, et al. IDH1 and IDH2 mutations play a fundamental role in glioma development [abstr]. Neuro Oncol 2009;11(5):608 [Google Scholar]
- 44.Barbero S, Bonavia R, Bajetto A, et al. Stromal cell-derived factor 1α stimulates human glioblastoma cell growth through the activation of both extracellular signal-regulated kinases 1/2 and Akt. Cancer Res 2003;63(8):1969–1974 [PubMed] [Google Scholar]
- 45.Gillies RJ, Raghunand N, Garcia-Martin ML, Gatenby RA. pH imaging: a review of pH measurement methods and applications in cancers. IEEE Eng Med Biol Mag 2004;23(5):57–64 [DOI] [PubMed] [Google Scholar]
- 46.Stubbs M, Rodrigues L, Howe FA, et al. Metabolic consequences of a reversed pH gradient in rat tumors. Cancer Res 1994;54(15):4011–4016 [PubMed] [Google Scholar]
- 47.Zuppi C, Messana I, Forni F, et al. 1H NMR spectra of normal urines: reference ranges of the major metabolites. Clin Chim Acta 1997;265(1):85–97 [DOI] [PubMed] [Google Scholar]
- 48.Murrey HE, Hsieh-Wilson LC. The chemical neurobiology of carbohydrates. Chem Rev 2008;108(5):1708–1731 [DOI] [PMC free article] [PubMed] [Google Scholar]