

The data presented herein suggest that the presence of inflammation may be detected at 13C-MR spectroscopy as the increased conversion of hyperpolarized 13C-pyruvate into 13C-lactate.
Abstract
Purpose:
To examine the feasibility of using magnetic resonance (MR) spectroscopy with hyperpolarized carbon 13 (13C)–labeled pyruvate to detect inflammation.
Materials and Methods:
The animal care and use committee approved all work with animals. Arthritis was induced in the right hind paw of six rats; the left hind paw served as an internal control. The lactate dehydrogenase–catalyzed conversion of pyruvate to lactate was measured in inflamed and control paws by using 13C MR spectroscopy. Clinical and histologic data were obtained to confirm the presence and severity of arthritis. Hyperpolarized 13C-pyruvate was intravenously injected into the rats before simultaneous imaging of both paws with 13C MR spectroscopy. The Wilcoxon signed rank test was used to test for differences in metabolites between the control and arthritic paws.
Results:
All animals showed findings of inflammation in the affected paws and no signs of arthritis in the control paws at both visible inspection (clinical index of 3 for arthritic paws and 0 for control paws) and histologic examination (histologic score of 3–5 for arthritic paws and 0 for control paws). Analysis of the spectroscopic profiles of 13C-pyruvate and converted 13C-lactate showed an increase in the amount of 13C-lactate in inflamed paws (median lactate-to-pyruvate ratio, 0.50; mean lactate-to-pyruvate ratio ± standard deviation, 0.52 ± 0.16) versus control paws (median lactate-to-pyruvate ratio, 0.27; mean lactate-to-pyruvate ratio, 0.32 ± 0.11) (P < .03). The ratio of 13C-lactate to total 13C was also significantly increased in inflamed paws compared with control paws (P < .03).
Conclusion:
These results suggest that alterations in the conversion of pyruvate to lactate as detected with 13C-MR spectroscopy may be indicative of the presence of inflammatory arthritis.
© RSNA, 2011
Introduction
Quantitative, objective, and noninvasive biomarkers are needed for detecting autoimmune disorders (including inflammatory arthritis) and monitoring their treatment (1). Current clinical measures for detection and monitoring are either invasive or fail to provide a direct indication of disease activity; in addition, they are often subjective and difficult to standardize (2–4). Serum biomarkers (5) and several molecular imaging techniques have been described for arthritis imaging, but techniques specifically tailored to arthritis are not widely used or are still in developmental stages (6,7). The technique of magnetic resonance (MR) spectroscopic imaging with hyperpolarized carbon 13 (13C)–labeled biomolecules offers much promise in surmounting these obstacles.
The development of hyperpolarized MR imaging agents presents a new noninvasive imaging strategy for probing normal biologic and disease processes (8). Polarization of metabolically active substrates such as pyruvate permits in vivo metabolic imaging of the injected agent and downstream metabolic products. The metabolic products can be differentiated from the substrate on the basis of their chemical shifts.
Pyruvate may be an ideal noninvasive imaging biomarker of inflammatory arthritis. Pyruvate occupies a key intersection in several metabolic pathways as an intermediary in energy metabolism in living cells, and inflamed tissues have increased energy demands. Pyruvate levels are elevated in joints affected by osteoarthritis (9), and the amount of lactic acid, a metabolic product of pyruvate, is elevated in the synovial fluid of patients with rheumatoid arthritis (10). Inhibitors of pyruvate metabolism downregulate inflammation (11). Proton (hydrogen 1 [1H]) nuclear MR studies have also demonstrated elevated lactate levels in the synovial fluid and synovium of patients with rheumatoid arthritis and in rodent models of inflammatory arthritis (12–15).
The goal of this preliminary study was to test whether MR spectroscopic imaging with hyperpolarized 13C-labeled pyruvate can provide an objective and quantitative measure of arthritis, which may eventually be helpful in clinical decision making and treatment planning. Alterations in pyruvate metabolism may be interrogated by injecting a bolus of hyperpolarized 13C-pyruvate—a nontoxic, easily polarized, and rapidly metabolized substrate (16). Currently, no previous studies have examined the feasibility of using hyperpolarized 13C-labeled pyruvate to detect inflammation. We hypothesize that it may be possible to detect the presence of inflammation by depicting alterations in the conversion of hyperpolarized 13C-pyruvate to lactate at 13C MR spectroscopy.
Materials and Methods
Research support in the form of equipment maintenance was provided by GE Healthcare. Those authors that were not employees of GE Healthcare had control of inclusion of any data and information that might present a conflict of interest for those authors who are employees of GE Healthcare. J.D.M., Y.F.Y., D.M., and D.M.S. have submitted a patent application that describes this method for detecting inflammation with 13C MR spectroscopy and hyperpolarized 13C-pyruvate.
Animal Preparation
The administrative panel on laboratory animal care at our institution approved all animal procedures for this work. Inflammation was induced in plantar tissues of the right hind paw of six juvenile Sprague-Dawley rats (weight, 80–90 g; age, 4–5 weeks) by means of a single subcutaneous injection of 0.4 mL/kg Freund complete adjuvant (Lee Laboratories, Grayson, Ga) (17). A control solution of 50 μL of sterile 0.9% sodium chloride was injected in the subcutaneous plantar tissues of the left hind paw. Clinical signs of arthritis were recorded each day after arthritis induction for each hind paw with a visual assessment of arthritis (clinical index) and a measurement of paw thickness (both performed by J.D.M.). A clinical index was obtained for each paw, as follows: 0 = no evidence of inflammation, 1 = subtle inflammation (localized edema), 2 = easily identified swelling but localized to either the dorsal or ventral surface of the paw, and 3 = swelling in all aspects of the paw (18). Paw swelling was measured as an increase in thickness of the middle part of the paw (lateral dimension of the middle part of paw just distal to the malleoli) by using a Kafer dial thickness gauge (Long Island Indicator, Hauppauge, NY) (18). All animals were imaged 7 days after the induction of arthritis, when the arthritis was at the acute phase of activity for this animal model.
Animals were anesthetized with isoflurane (1%–2%) mixed with 100% oxygen at 0.5–1.0 L/min by means of a nose cone before placement of an intravenous catheter into the tail vein and during MR imaging. Rats were placed on a heating pad inside the radiofrequency coil to maintain a core body temperature of 37°C. Heart rate, oxygen saturation, body temperature, and respiration rate were monitored throughout the imaging experiment. The hind paws were prepared for tissue processing after completion of the imaging experiments.
MR Hardware and Radiofrequency Coils
The animal experiments were performed with a 3.0-T clinical MR unit (Signa Excite; GE Healthcare, Waukesha, Wis) optimized for rodent and 13C imaging. Rat hind paws were positioned in a custom-built dual-tuned 1H-13C quadrature birdcage radiofrequency coil (50 mm inner diameter, 70 mm long) designed for both signal excitation and reception. The coil was based on a previously published design (19), but with a second half-Helmholtz unit added to provide quadrature operation in the proton mode.
Polarization Technique
Samples of [1-13C]pyruvate were hyperpolarized with dynamic nuclear polarization (16,20) by using a HyperSense polarizer (Oxford Instruments, Abingdon, England). The polarized mixture consisted of 18 mg of [1-13C]pyruvate (99% enriched, Isotex Diagnostics, Friendswood Tex) mixed with OX063 radical (Oxford Instruments) and 3.0 μL of a 50:1 dilution of ProHance (Bracco Diagnostics, Princeton, NJ). The microwave irradiation frequency was 94.08 GHz, in accordance with the electron resonance frequency for the 3.35-T polarizer magnet. The sample temperature was kept at 1.4 K by using a vacuum-pumped liquid helium system. After polarization, the frozen sample was rapidly dissolved by using a 4.0-mL solution of 185°C 100 mmol/L NaOH, 40 mmol/L Trizma preset pH 7.6 crystals (Sigma Aldrich, St Louis, Mo), and 100 mg/L disodium edetic acid (EDTA) buffer. The final concentration of the injected pyruvate solution was 80 mmol/L (pH, 7.4–7.6); 0.5 mL of this solution was injected intravenously into each rat over 8 seconds.
MR Imaging Protocol
Both hind paws were placed in the center of the 1H-13C coil with the rat in the prone position. The hind paws were positioned symmetrically with respect to the amplitude of static field (B0) by aligning the plantar surfaces along the z-axis with the toes of each paw pointed inferiorly to the animal and positioned symmetrically with respect to the x-y plane. This positioning placed only the tail and both hind paws in the transverse field of view and enabled simultaneous imaging of both the arthritic and control paws. A 1-mL syringe phantom filled with 1.7 mol/L nonhyperpolarized 13C-lactate was placed adjacent to the left hind paw within the field of view and used as a quantitative reference.
For proton imaging, transmit gain was determined by using a standard automatic preimaging protocol. Proton localization imaging was performed in three planes followed by T2-weighted fast spin-echo thin-section imaging through the hind paws in the transverse plane. T2-weighted fast spin-echo imaging was performed with a 40 × 40-mm field of view, a 256 × 256 matrix, and 1-mm-thick sections.
For 13C imaging, the transmit gain was adjusted manually by using the signal from a nonpolarized 13C-lactate reference phantom. The 13C imaging prescription in the transverse plane was based on T2-weighted fast spin-echo images and centered on the mid-paws approximately 5–6 mm distal to the malleoli. Single-time-point MR spectroscopic images were obtained 20 seconds after the start of injection with a free induction decay chemical shift imaging sequence by using centric phase encoding and a progressively increasing excitation flip angle (21) with the following parameters: 10-mm-thick sections, nominal in-plane resolution of 2.5 × 2.5 mm, 40 × 40-mm field of view, 5-kHz spectral bandwidth, and 256 points.
Tissue Processing and Analysis
Control and inflamed paws were dissected, fixed, decalcified with Kristensen solution, embedded in paraffin, and sliced with a microtome for staining with hematoxylin-eosin for subsequent histologic analysis. Histologic changes (inflammatory cell infiltration) were graded as previously described (22), with minor modifications, by J.D.M. (4 years of experience) (23,24). Briefly, inflammation was scored on a scale of 0–5, where 0 = normal, 1 = minimal infiltration of inflammatory cells, 2 = mild infiltration, 3 = moderate infiltration, 4 = marked infiltration, and 5 = severe infiltration.
MR Data Reconstruction and Analysis
Metabolic maps for 13C-pyruvate and 13C-lactate were reconstructed from the free induction decay chemical shift imaging data as previously described (25). Briefly, spectra were phased and corrected for B0 inhomogeneities. Then, 13C-pyruvate and 13C-lacate levels were calculated by using peak integration. Tissue-specific signal intensities of each metabolite were calculated as the total signal in the respective metabolic maps in regions of interest (ROIs) in the tail and left and right hind paws as defined on the corresponding proton reference image. The ROIs were drawn in the dorsal portion of each paw at the site of the Freund complete adjuvant or normal saline injection; these ROIs included approximately half of the area of the paw as demonstrated on the transverse metabolic maps and T2-weighted MR images. To minimize the possibility of noise producing erroneous lactate-to-pyruvate ratios, the ratios were set to 0 in pixels in the ROI where either the lactate or pyruvate intensities were less than 10% of the corresponding maximum intensities (26). For display of individual spectra, first-order phase correction was performed and the baseline was subtracted by fitting a spline to signal-free regions of the smoothed spectrum. All data processing was performed with custom software by using Matlab (MathWorks, Natick, Mass). Statistical analysis was performed with Prism 5 (GraphPad Software, La Jolla, Calif).
Statistical Methods
The Student t test was used to test for differences in mean paw thickness. The Wilcoxon matched-pairs signed rank test was used to test for differences between the control and arthritic paws for both the labeled 13C lactate–to-pyruvate and labeled 13C lactate–to-total 13C ratios.
Results
Clinical and Histologic Measures of Inflammatory Arthritis
Clinical signs of inflammation in the right hind paws were visible on the day of imaging, which was 7 days after induction of inflammation. The right hind paws were visibly inflamed, and the inflamed paws of all six animals were graded as having a clinical index of 3; the clinical index for the left control hind paw was 0. The inflamed paws showed a significant increase in thickness, with a mean thickness (±standard deviation) of 9.3 mm ± 0.4 for right paws versus 8.1 mm ± 0.2 for left paws (P < .001). Figure 1 shows the typical time-course of arthritis in this rat model in a separate group of five arthritic rats that were followed up for changes in joint thickness and clinical index; the progression of arthritis may be grouped into the acute phase (∼1–9 days after arthritis induction), subacute phase (∼10–20 days after arthritis induction), and chronic phase (≥21 days after arthritis induction). Histologic slices from the paws of the six rats imaged with 13C MR spectroscopy showed inflammatory changes in the plantar aspect of the paw at the site of Freund complete adjuvant injection, including the presence of inflammatory cells and bone alterations (Fig 2). At histologic analysis, four of the six rats had an inflammatory infiltration score of 4, one rat had an inflammatory infiltration score of 3, and one rat had an inflammatory infiltration score of 5; none of the rats had inflammation in the control left hind paw at histologic analysis.
Figure 1:

Graph shows clinical measures of paw inflammation. Data points show changes in paw thickness (thickness of arthritic right paw subtracted by thickness of control left paw) and clinical index scores in the Freund complete adjuvant rat model of arthritis. Brackets are standard deviations. For clinical index, 0 = no evidence of inflammation, 1 = subtle inflammation, 2 = easily identified swelling but localized to either the dorsal or ventral surface of paw, and 3 = swelling in all aspects of paw.
Figure 2:

Photomicrographs (hematoxylin-eosin stain; original magnification, ×20) show histologic changes of inflammation in one rat 7 days after induction of arthritis. cb = cortical bone. A, Photomicrograph of specimen from control paw shows normal tissue architecture in cortical bone and muscle (m). B, Photomicrograph of specimen from arthritic paw shows accumulation of inflammatory cells (ic) in muscle and periostitis with bone erosion (arrow).
Single-Time-Point Free Induction Decay Chemical Shift Imaging
On metabolic maps, the 13C-lactate signal in the inflamed paw was higher than that in the control paw and tail (Fig 3). This visible increase in lactate signal in the inflamed paws also corresponded to a visible decrease in the pyruvate signal and an increase in the labeled 13C lactate–to-pyruvate ratio as depicted on the metabolic maps.
Figure 3:

Quantitative metabolic maps of lactate-to-pyruvate ratio (Lac/Pyr, top left), pyruvate (top right), and lactate (bottom left) after injection of hyperpolarized 13C-pyruvate. Lactate production in the arthritic right (R) paw is increased, as measured with the lactate-to-pyruvate ratio. Color bar indicates the values for the lactate-to-pyruvate ratio, with red indicative of a maximum ratio of 1.03. In the map for pyruvate, red indicates the maximum signal intensity of 1485 arbitrary units (au) for 13C-pyruvate. In the map for lactate, red indicates a maximum signal intensity of 674 au for 13C-lactate. 1H MR images (lower right) show soft tissue swelling in arthritic right paw compared with control left (L) paw and ROI analysis applied for the metabolic maps. T = tail.
ROI measurements in the paws and tail in the six arthritic animals showed that the amount of lactate signal in the arthritic paw was significantly higher than that in the control paw and tail (Table, Fig 4) when measured with either the labeled 13C lactate–to-pyruvate ratio (P < .03) or the labeled 13C lactate–to-total 13C ratio (P < .03).
ROI Measurements in Control and Inflamed Tissues
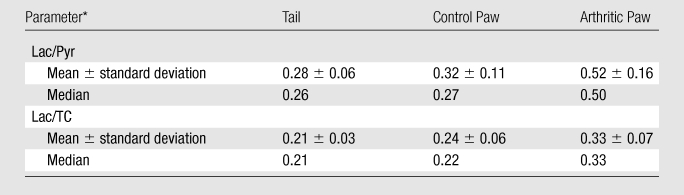
Lac/Pyr = 13C-labeled lactate–to-pyruvate ratio, Lac/TC = 13C-labeled lactate–to–total 13C ratio.
Figure 4:

Graph shows lactate-to-pyruvate ratios measured in six arthritic rats. A 65% increase in the mean lactate-to-pyruvate ratio (standard deviation, 33%; range, 38%–126%) was observed in the arthritic paw compared with the control paw on the opposite side. Measurements were obtained 20 seconds after injection of 0.5-mL bolus of 80 mmol/L hyperpolarized 13C-pyruvate.
Spectra from individual voxels interrogated on the metabolic maps showed that the amount of 13C-lactate at the site of arthritis induction in the plantar soft tissues was higher than that in tissues remote from the site of arthritis induction (dorsal side of the inflamed paw), tail, and control paw (Fig 5). These spectra also showed 13C-alanine signal in the control paw but not in the inflamed paw (Fig 5).
Figure 5:

Spectroscopic profiles from single 2.5 × 2.5 × 10-mm voxels in control and arthritic tissues in one rat. Increased 13C-lactate production is demonstrated in the plantar surface of the arthritic right paw (lactate-to-pyruvate ratio = 0.70) in comparison to the control left paw (lactate-to-pyruvate ratio = 0.57), tail (lactate-to-pyruvate ratio = 0.37), and tissues away from the site of arthritis induction in the dorsal right paw (lactate-to-pyruvate ratio = 0.57). Arrow = alanine production in control left paw; no alanine is observed in arthritic paw. a.u. = Arbitrary units, sig. int. = signal intensity.
Discussion
Our results suggest that MR spectroscopy with hyperpolarized 13C-pyruvate depicts alterations in the amount of 13C-lactate signal in inflamed tissue. We found a 65% increase in the mean lactate-to-pyruvate ratio in the presence of inflammation. The inflamed tissue could be detected as an increase in the labeled lactate–to-pyruvate ratio on 13C chemical shift images. This increased 13C-lactate signal appears to identify inflammation in this rodent model and suggests that MR spectroscopy with hyperpolarized 13C-pyruvate may be a rapid and noninvasive method with which to quantify arthritis activity.
Pyruvate has been selected for study as a potential biomarker of inflammatory arthritis because it is a biomolecule with a low toxicity profile and has favorable properties for 13C MR spectroscopy. 13C MR spectroscopy relies on the procedure of dynamic nuclear polarization to increase the signal-to-noise ratio by a dramatic four orders of magnitude (16). This signal can be detected with a clinical MR imaging unit and may enable real-time visualization of in vivo metabolic processes and quantitative measurements of metabolism by means of select enzyme-catalyzed pathways (25,27).
The data presented herein may also provide initial insights into arthritis metabolism in vivo and are consistent with previous biochemical and nuclear MR studies of synovial fluid and synovium performed on ex vivo samples from arthritic animals and humans with inflammatory arthritis (12–15). A key feature of the rheumatoid joint is a hypoxic environment (28), and elevated lactate concentrations detectable in rheumatoid arthritis are a characteristic feature of the hypoxic and acidotic conditions present in affected joints (14).
Our data further implicate lactate as a marker of inflammation and suggest that increased production of lactate is an ongoing process. Although alterations in blood flow to inflamed and control tissues may have an effect on the amount of hyperpolarized pyruvate available for conversion to lactate, the use of the lactate-to-pyruvate ratio should help correct for these potential variations in substrate concentration and serve as a more precise measure of lactate production when comparisons are made across inflamed and control tissues. We also detected a small amount of 13C-alanine in the control paw, but 13C-alanine was detected above background in the inflamed paw. This supports the hypothesis that, in sites of inflammation, pyruvate is shunted away from alanine and toward lactate production.
The results of this study demonstrate that, in the animal model, inflammation is accompanied by a significant alteration in the lactate-to-pyruvate ratio. However, this finding is only the beginning of the process of establishing the potential use of this method for detecting inflammation in humans. The overlap of the ratios between arthritic and control paws in other animals indicates that more testing and refinement of the method will be necessary.
Further evaluation of this technique for application in arthritis is warranted for several reasons. A combination of factors likely influence the observed 13C-lactate signal; these factors include in vivo rate constants for lactate dehydrogenase, exchange rates versus enzymatic flux, inflow of metabolites, and the endogenous biodistribution and concentrations of lactate, pyruvate, and the oxidized and reduced forms of nicotinamide adenine dinucleotide (20,29,30). Other animal models that mimic rheumatoid arthritis may also need to be examined with this technique to confirm these preliminary results.
Although we induced inflammation, which was intended to be localized to the right hind paw, systemic effects are well described in this model system (17) and in rheumatoid arthritis (31). Thus, although we used the left paw as an internal control, there may be some degree of systemic inflammation. It will be important to establish baseline levels of lactate production in normal paw tissues so they can be compared with the presumably unaffected tissues in arthritis models.
In conclusion, the data presented herein suggest that the presence of inflammation may be detected at 13C MR spectroscopy as the increased conversion of hyperpolarized 13C-pyruvate into 13C-lactate. Our initial data show that the amount of lactate produced from pyruvate can be quantified and that the conversion to lactate is increased in inflamed tissues. This imaging strategy holds promise as an objective and noninvasive measure of disease activity in autoimmune diseases such as rheumatoid arthritis.
Practical application: This technique is promising for future clinical detection of inflammation. If further testing supports the preliminary results of this report, the technique may be used as a quantitative measure of disease activity in inflammatory disorders and autoimmune diseases such as rheumatoid arthritis.
Advances in Knowledge.
The data presented herein suggest that alterations in the conversion of hyperpolarized 13C-pyruvate to 13C-lactate as detected with 13C MR spectroscopy may be indicative of the presence of inflammatory arthritis.
This imaging strategy can be used to quantify the amount of lactate produced from pyruvate in normal and diseased joints, and the conversion to lactate appears increased in inflamed tissues.
Implication for Patient Care.
This imaging strategy holds promise as a noninvasive measure of disease activity for autoimmune diseases such as rheumatoid arthritis.
Disclosures of Potential Conflicts of Interest: J.D.M. Financial activities related to the present article: institution received research support in the form of equipment maintenance from GE Healthcare. Financial activities not related to the present article: institution received money from GE Healthcare for a patent pending. Other relationships: none to disclose. Y.F.Y. Financial activities related to the present article: none to disclose. Financial activities not related to the present article: will receive money for a patent pending. Other relationships: none to disclose. D.M. Financial activities related to the present article: institution received research support in the form of equipment maintenance from GE Healthcare. Financial activities not related to the present article: institution received money from GE Healthcare for a patent pending. Other relationships: none to disclose. J.S.T. Financial activities related to the present article: none to disclose. Financial activities not related to the present article: none to disclose. Other relationships: none to disclose. R.E.H. Financial activities related to the present article: none to disclose. Financial activities not related to the present article: none to disclose. Other relationships: none to disclose. D.M.S. Financial activities related to the present article: none to disclose. Financial activities not related to the present article: none to disclose. Other relationships: none to disclose.
Received September 23, 2010; revision requested November 2; revision received December 22; accepted December 29; final version accepted January 6, 2011.
Supported by a Society of Pediatric Radiology Research and Education Foundation Grant.
Funding: This research was supported by the National Institutes of Health (grants RR09784, EB009070, AA018681, and 2674-2).
See also Science to Practice in this issue.
Abbreviation:
- ROI
- region of interest
References
- 1.Nam J, Villeneuve E, Emery P. The role of biomarkers in the management of patients with rheumatoid arthritis. Curr Rheumatol Rep 2009;11(5):371–377 [DOI] [PubMed] [Google Scholar]
- 2.Ravelli A, Martini A. Juvenile idiopathic arthritis. Lancet 2007;369(9563):767–778 [DOI] [PubMed] [Google Scholar]
- 3.Felson DT, Anderson JJ, Boers M, et al. American College of Rheumatology. Preliminary definition of improvement in rheumatoid arthritis. Arthritis Rheum 1995;38(6):727–735 [DOI] [PubMed] [Google Scholar]
- 4.Felson DT, Anderson JJ, Boers M, et al. The American College of Rheumatology preliminary core set of disease activity measures for rheumatoid arthritis clinical trials. The Committee on Outcome Measures in Rheumatoid Arthritis Clinical Trials. Arthritis Rheum 1993;36(6):729–740 [DOI] [PubMed] [Google Scholar]
- 5.Lindstrom TM, Robinson WH. Biomarkers for rheumatoid arthritis: making it personal. Scand J Clin Lab Invest Suppl 2010;242:79–84 [DOI] [PMC free article] [PubMed] [Google Scholar]
- 6.Biswal S, Resnick DL, Hoffman JM, Gambhir SS. Molecular imaging: integration of molecular imaging into the musculoskeletal imaging practice. Radiology 2007;244(3):651–671 [DOI] [PubMed] [Google Scholar]
- 7.McQueen FM, Ostergaard M. Established rheumatoid arthritis—new imaging modalities. Best Pract Res Clin Rheumatol 2007;21(5):841–856 [DOI] [PubMed] [Google Scholar]
- 8.Golman K, Ardenkjaer-Larsen JH, Petersson JS, Mansson S, Leunbach I. Molecular imaging with endogenous substances. Proc Natl Acad Sci U S A 2003;100(18):10435–10439 [DOI] [PMC free article] [PubMed] [Google Scholar]
- 9.Damyanovich AZ, Staples JR, Chan AD, Marshall KW. Comparative study of normal and osteoarthritic canine synovial fluid using 500 MHz 1H magnetic resonance spectroscopy. J Orthop Res 1999;17(2):223–231 [DOI] [PubMed] [Google Scholar]
- 10.Falchuk KH, Goetzl EJ, Kulka JP. Respiratory gases of synovial fluids: an approach to synovial tissue circulatory-metabolic imbalance in rheumatoid arthritis. Am J Med 1970;49(2):223–231 [DOI] [PubMed] [Google Scholar]
- 11.Fink MP. Ethyl pyruvate: a novel anti-inflammatory agent. J Intern Med 2007;261(4):349–362 [DOI] [PubMed] [Google Scholar]
- 12.Hitchon CA, El-Gabalawy HS, Bezabeh T. Characterization of synovial tissue from arthritis patients: a proton magnetic resonance spectroscopic investigation. Rheumatol Int 2009;29(10):1205–1211 [DOI] [PubMed] [Google Scholar]
- 13.Meshitsuka S, Yamazaki E, Inoue M, Hagino H, Teshima R, Yamamoto K. Nuclear magnetic resonance studies of synovial fluids from patients with rheumatoid arthritis and osteoarthritis. Clin Chim Acta 1999;281(1-2):163–167 [DOI] [PubMed] [Google Scholar]
- 14.Naughton D, Whelan M, Smith EC, Williams R, Blake DR, Grootveld M. An investigation of the abnormal metabolic status of synovial fluid from patients with rheumatoid arthritis by high field proton nuclear magnetic resonance spectroscopy. FEBS Lett 1993;317(1-2):135–138 [DOI] [PubMed] [Google Scholar]
- 15.Naughton DP, Haywood R, Blake DR, Edmonds S, Hawkes GE, Grootveld M. A comparative evaluation of the metabolic profiles of normal and inflammatory knee-joint synovial fluids by high resolution proton NMR spectroscopy. FEBS Lett 1993;332(3):221–225 [DOI] [PubMed] [Google Scholar]
- 16.Ardenkjaer-Larsen JH, Fridlund B, Gram A, et al. Increase in signal-to-noise ratio of >10,000 times in liquid-state NMR. Proc Natl Acad Sci U S A 2003;100(18):10158–10163 [DOI] [PMC free article] [PubMed] [Google Scholar]
- 17.Pearson CM. Development of arthritis, periarthritis and periostitis in rats given adjuvants. Proc Soc Exp Biol Med 1956;91(1):95–101 [DOI] [PubMed] [Google Scholar]
- 18.Lee DM, Friend DS, Gurish MF, Benoist C, Mathis D, Brenner MB. Mast cells: a cellular link between autoantibodies and inflammatory arthritis. Science 2002;297(5587):1689–1692 [DOI] [PubMed] [Google Scholar]
- 19.Derby K, Tropp J, Hawryszko C. Design and evaluation of a novel dual-tuned resonator for spectroscopic imaging. J Magn Reson 1990;86:645–651 [Google Scholar]
- 20.Spielman DM, Mayer D, Yen YF, Tropp J, Hurd RE, Pfefferbaum A. In vivo measurement of ethanol metabolism in the rat liver using magnetic resonance spectroscopy of hyperpolarized [1-13C]pyruvate. Magn Reson Med 2009;62(2):307–313 [DOI] [PMC free article] [PubMed] [Google Scholar]
- 21.Yen YF, Kohler SJ, Chen AP, et al. Imaging considerations for in vivo 13C metabolic mapping using hyperpolarized 13C-pyruvate. Magn Reson Med 2009;62(1):1–10 [DOI] [PMC free article] [PubMed] [Google Scholar]
- 22.Pettit AR, Ji H, von Stechow D, et al. TRANCE/RANKL knockout mice are protected from bone erosion in a serum transfer model of arthritis. Am J Pathol 2001;159(5):1689–1699 [DOI] [PMC free article] [PubMed] [Google Scholar]
- 23.Chen M, Boilard E, Nigrovic PA, et al. Predominance of cyclooxygenase 1 over cyclooxygenase 2 in the generation of proinflammatory prostaglandins in autoantibody-driven K/BxN serum-transfer arthritis. Arthritis Rheum 2008;58(5):1354–1365 [DOI] [PubMed] [Google Scholar]
- 24.MacKenzie JD, Limpa-Amara N, Mahmood A, et al. In vivo µSPECT quantification of 99mTc-MDP joint localization in the K/BxN mouse model of inflammatory arthritis. [abstr]. J Nucl Med 2005;46(suppl 2):217P [Google Scholar]
- 25.Kohler SJ, Yen Y, Wolber J, et al. In vivo 13 carbon metabolic imaging at 3T with hyperpolarized 13C-1-pyruvate. Magn Reson Med 2007;58(1):65–69 [DOI] [PubMed] [Google Scholar]
- 26.Day SE, Kettunen MI, Gallagher FA, et al. Detecting tumor response to treatment using hyperpolarized 13C magnetic resonance imaging and spectroscopy. Nat Med 2007;13(11):1382–1387 [DOI] [PubMed] [Google Scholar]
- 27.Merritt ME, Harrison C, Storey C, Jeffrey FM, Sherry AD, Malloy CR. Hyperpolarized 13C allows a direct measure of flux through a single enzyme-catalyzed step by NMR. Proc Natl Acad Sci U S A 2007;104(50):19773–19777 [DOI] [PMC free article] [PubMed] [Google Scholar]
- 28.Taylor PC, Sivakumar B. Hypoxia and angiogenesis in rheumatoid arthritis. Curr Opin Rheumatol 2005;17(3):293–298 [DOI] [PubMed] [Google Scholar]
- 29.Kettunen MI, Hu DE, Witney TH, et al. Magnetization transfer measurements of exchange between hyperpolarized [1-13C]pyruvate and [1-13C]lactate in a murine lymphoma. Magn Reson Med 2010;63(4):872–880 [DOI] [PubMed] [Google Scholar]
- 30.Chen AP, Leung K, Lam W, Hurd RE, Vigneron DB, Cunningham CH. Design of spectral-spatial outer volume suppression RF pulses for tissue specific metabolic characterization with hyperpolarized 13C pyruvate. J Magn Reson 2009;200(2):344–348 [DOI] [PMC free article] [PubMed] [Google Scholar]
- 31.Scott DL, Wolfe F, Huizinga TW. Rheumatoid arthritis. Lancet 2010;376(9746):1094–1108 [DOI] [PubMed] [Google Scholar]