

Abstract
Purpose
To determine whether treatment response to the Aurora B kinase inhibitor, AZD1152, could be monitored early in the course of therapy by non-invasive [18F]FDG and/or [18F]FLT PET imaging.
Experimental design
AZD1152-treated and control HCT116 and SW620 xenograft-bearing animals were monitored for tumor size and by [18F]FDG and [18F]FLT PET imaging. Additional studies assessed the endogenous and exogenous contributions thymidine synthesis in the two cell lines.
Results
Both xenografts showed a significant volume-reduction to AZD1152. In contrast, [18F]FDG uptake did not demonstrate a treatment response. [18F]FLT uptake decreased to less than 20% of control values in AZD1152-treated HCT116 xenografts, whereas [18F]FLT uptake was near background levels in both treated and untreated SW620 xenografts. The EC50 for AZD1152-HQPA was ~10 nM in both SW620 and HCT116 cells; in contrast, SW620 cells were much more sensitive to Methotrexate (MTX) and 5-Fluorouracil (5FU) than HCT116 cells. Immunoblot analysis demonstrated marginally lower expression of thymidine kinase in SW620 compared to HCT116 cells. The above results suggest that SW620 xenografts have a higher dependency on the de novo pathway of thymidine utilization than HCT116 xenografts.
Conclusions
AZD1152 treatment showed anti-tumor efficacy in both colon cancer xenografts. Although [18F]FDG PET was inadequate in monitoring treatment-response, [18F]FLT PET was very effective in monitoring response in HCT116 xenografts, but not in SW620 xenografts. These observations suggest that de novo thymidine synthesis could be a limitation and confounding factor for [18F]FLT PET imaging and quantification of tumor proliferation, and this may apply to some clinical studies as well.
Keywords: Colon cancer, HCT116, SW620, Positron-Emission Tomography, AZD1152, Methotrexate - MTX, 5-Fluorouracil – 5-FU, Fluorodeoxythymidine – FLT, Fluorodeoxyglucose – FDG
Introduction
The objective of this study was to assess whether response to treatment with the novel Aurora Kinase B inhibitor, AZD1152, could be monitored non-invasively by [18F]FDG or [18F]FLT PET imaging in an animal xenograft model. These studies were expected to provide preclinical imaging assessments that would help guide a decision of whether to proceed with comparable PET imaging studies in clinical trials with AZD1152. Both radiopharmaceuticals are widely available for clinical PET imaging studies, and the potential exists for direct translation to comparable phase I and II drug-treatment and imaging trials.
Aurora kinases are overexpressed in a variety of human tumors, including colorectal tumors, leading to dysregulation of mitosis. Over the past 20 years, aurora kinases have been extensively studied and are now recognized as promising targets for anticancer drug development (1). Aurora B kinase is the catalytic component of the chromosomal passenger complex responsible for the accurate segregation of the chromatids, histone modification, and cytokinesis (2). The aurora kinase family comprises three related proteins that have similar homology in their catalytic domains (3). Expression of aurora A and B is linked to the proliferation of many types of cells, whereas aurora C expression seems to be restricted to normal testicular tissue (4).
AZD1152 is a representative of a new class of small-molecule inhibitors, quinazoline-based compounds, with potent activity against specific Aurora kinases (5) (6). AZD1152 is a quinazoline prodrug, which is rapidly converted in plasma into its active metabolite, AZD1152-hydroxyquinazoline pyrazol anilide (AZD1152-HQPA) with high affinity for aurora B and C kinases. AZD1152-HQPA is reported to have no substantial activity against a panel of other kinases (7). In preclinical models, AZD1152 inhibited the growth of human colon, lung, and hematologic tumor xenografts (8) (9) (10). In a phase I clinical trial, AZD1152 was administered by weekly infusions to patients with advanced, pretreated solid tumors. Dose limiting toxicity (DLT) was neutropenia (grade 3), with some non hematologic toxicity. Pharmacokinetic studies confirmed rapid conversion of AZD1152 into AZD1152-HQPA. Three patients had stable disease (melanoma, nasopharyngeal carcinoma, and adenoid cystic carcinoma). Follow-up studies are ongoing, based on preclinical tumor models, which suggested that prolonged drug administration significantly increased the pro-apoptotic effect of AZD1152-HQPA (34). AZD1152 has been in development for the treatment of patients with breast, colon and lung cancer, and is currently being studied for the treatment of acute myeloid leukemia (11–12).
This study focuses on two issues: a) the assessment of AZD1152 treatment effcacy using noninvasive PET imaging, and b) the importance of considering both the de novo and salvage components of thymidine utilization in the interpretation of [18F]FLT imaging studies. Two human colon carcinoma cell lines, HCT116 and SW620, and corresponding subcutaneous xenografts were studied. It was recently reported that HCT116 xenografts were highly sensitive to AZD1152 treatment (13). The measured parameters in this study included tumor volume and the uptake of [18F]-labeled fluoro-2-Deoxyglucose ([18F]FDG) and 3'-deoxy-3'-[18F]fluorothymidine ([18F]FLT), respectively. The objective of this study was to assess whether treatment response could be monitored by non-invasive [18F]FDG and/or [18F]FLT PET imaging. A second objective developed during the course of this study; namely, to explain the differences in [18F]FLT uptake observed in untreated HCT116 and SW620 xenografts.
Material and methods
Cell lines
HCT116 human colorectal carcinoma cells obtained from the American Type Culture Collection (ATCC) were cultured in 72 cm2 flasks with McCoy’s 5a (modified) medium plus L-glutamine (1.5 mM), sodium bicarbonate (2.2 g/L), fetal bovine serum (10%), penicillin (100 I.U./ml) and streptomycin (100 µg/ml). SW620 human colorectal carcinoma cells were obtained from the ATCC and cultured in 72 cm2 flasks with DMEM medium plus fetal bovine serum (10%), penicillin (100 I.U./ml) and streptomycin (100 µg/ml). Both cell lines were maintained in a humidified atmosphere (5% CO2/95% air) at 37°C. All cell lines were tested for mycoplasma contamination prior to experimentation using a PCR test (14) and were shown to be negative.
Xenograft model
All animal studies were performed under a Memorial Sloan Kettering Cancer Center IACUC-approved protocol. Xenografts were established by subcutaneous injection of 1 × 10⁶ wild-type cells in the right flank region. Two groups of 15 athymic rnu/rnu mice (NCI, MD), each bearing HCT116 or SW620 xenografts, were developed. Nine animals were treated with AZD1152 and 6 animals were maintained as controls. Three preliminary sets of experiments with SW620 (n=9) and HCT116 (n=17) xenografts were performed, and very similar results were obtained.
Treatment with AZD1152 was initiated when tumor volumes were ~ 250 mm3. HCT116 xenografts have reached this volume at day 4 post implantation and SW620 xenografts at day 14, AZD1152 was provided by Astra Zeneca (UK). The treatment protocol involved 3 weekly cycles. Each cycle included two consecutive days of AZD1152 treatment by intra-peritoneal injections (100 mg/kg). To assess drug effect on xenografts growth, caliper measurements of tumors were performed three times a week. Xenograft volume was calculated using the following equation - W2 * L * 3.14 / 6. The mean tumor volume profiles were plotted and fitted to a single exponential equation to estimate xenograft doubling time.
Radiotracers synthesis
[18F]FDG and [99mTc]DTPA were provided by IBA Molecular (Somerset, NJ, USA) via the MSKCC nuclear pharmacy. For [18F]FDG average purity was 99%, concentration of radioactivity 68–357 mCi/ml and specific activity was no less than 11 Ci/mmol at the end of bombardment. The average purity of [99mTc]DTPA was 99%; the concentration of radioactivity was ~60 mCi/ml and specific activity was no less than 100 mCi/mmol. [18F]FLT was provided by the MSKCC radiochemistry and cyclotron facility core; purity was ~95%, specific activity ~5000 Ci/mmol.
PET imaging studies
Control and AZD1152-treated mice were imaged concurrently on a R4 MicroPET dedicated small-animal PET scanner (Concorde Microsystems Inc Knoxville, TN) following intravenous injections of 200 µCi [18F]FDG or [18F]FLT. A short-acting isoflurane anesthesia (2% isoflurane, 98% air mix) was used throughout these studies. All animals were allowed to regain consciousness after radiotracer administration and move freely in their cages before repeat anesthesia and imaging,.
Imaging studies were performed weekly and sequentially with [18F]FDG and [18F]FLT imaging performed 24 hours apart. [18F]FDG imaging (10 minute acquisition) was performed one hour after i.v. injection; [18F]FLT imaging (10 minute acquisition) was performed 2 hours after i.v. injection. In preliminary [18F]FLT imaging studies, the dynamic profile of FLT accumulation in SW620 xenografts showed no evidence of uptake followed by washout, and background radioactivity was lower at 2 hours compared to 1 hour. The image data were corrected for non-uniformity of scanner response, dead time count losses, and physical decay to the time of injection but no attenuation, scatter, or partial-volume averaging. The measured spatial resolution of the R4 is ~2.2 mm full-width half maximum (FWHM) at the center of the field of view of reconstructed images. PET-measured tissue radioactivity was expressed as percentage of the injected dose per gram of tissue (%ID/g). Data analysis was performed on all images using ASIPro software with 2D regions of interest (ROI). ROI’s were drawn around the tumor on 2D slices through the tumor and the maximum-voxel value (% injected dose/cc) was measured and used in the calculations. For the assessment of tumor radioactivity (uCi/tumor), the mean tumor radioactivity, uCi/cc, × tumor volume, cc, product was calculated) as previously described (15). Briefly, a manual ROI was drawn around the tumor in each slice where tumor was visible. The mean accumulation (µCi/cc) and volume (cc) of each ROI was determined and summed.
Ki-67 and hematoxylin eosin immunohistochemical staining procedure
Tissue sample preparation and staining procedure to assess the effect of AZ1152-HQPA on cells proliferation was performed as previously described (16) (17).
In vitro studies
All experiments were performed in triplicate or more.
Studies with AZD1152–HQPA
AZD1152-HQPA is the active component of AZD1152 and was provided by AstraZeneca (UK). The compound was diluted in 100% dimethyl sulfoxide (DMSO) to 10 mM stock solution and stored frozen (−20° C) until use. The concentration of AZD1152-HQPA in culture medium was 0 nM, 100 nM and 500 nM; the corresponding concentrations of DMSO were 0 mM, 0.064 mM and 0.32 mM per ml were used in the control cultures, respectively. Cell monolayers were exposed to drug containing medium for 1 or 24 hours in 6-well plates before the [18F]FDG uptake experiments were performed. The AZ1152-HQPA containing medium was removed and replaced with 2 ml of DMEM high glucose medium containing [18F]FDG (0.5 µCi / ml / well) containing media and a 60 minutes incubation was performed as described previously (18). A clonogenic assay to estimate the sensitivity of cells to AZ1152-HQPA was performed as previously described (19).
EC50 cell viability studies with methotrexate (MTX) and 5-fluorouracil (5FU)
were performed to obtain a measure which reflects cell utilization of the de novo pathway of thymidine (TdR) synthesis and incorporation of endogenous TdR in DNA synthesis (20); the WST-1 assay was used as previously described (21). Briefly, cells were seed on 96-well micro plates (4,000 cells/well; 8 wells/treatment dose), and incubated with MTX over a wide dose range for 72 hours. WST-1 (cell viability reagent) was added to each well and after a 4 h reaction period the optical absorbance was determined at a wavelength of 562 nm with an ELISA-reader. The optical absorbance of control (untreated) cells was taken as the 100% value; EC50 values were calculated using PRISM 5 software.
Thymidine and fluorothymidine uptake studies
[3H]FLT and [14C]TdR were obtained from Moravek Biochemicals (Brea, CA USA) (purity >95%, specific activity 3.4 Ci/mmol (for FLT) and 19.4 Ci/mmol (for TdR)). HCT116 and SW620 were plated in 6 well plates and after 12 hours of incubation in 37° C and 5% CO2. The average confluence of cells on the plates was ~50%. The cell incubation medium was replaced with pre-heated medium containing [3H]FLT (0.5 µCi/ml), [99mTc]DTPA (0.5 µCi/ml) and [14C]TdR (0.05 µCi/ml), and uptake measured after 5, 15, 60 and 120 minutes of incubation. The incubation medium was removed and centrifuged at 14.000 rpm to remove any cells in the medium. Cells were washed with PBS pre-heated to 37 *C once and lysated by adding RIPA buffer 1X with Halttm protease inhibitor single use cocktail (both by Thermo Scientific, IL, USA). [99mTc]DTPA provided a measure of adhered medium that was not removed by the washing procedure. An aliquot of medium and lysate samples have been used for counting of radioactivity. The remaining lysate was centrifuged at 14.000 rpm for 10 minutes and frozen at −20° C and assayed later for the determination of protein concentration using a BCA protein assay kit (Thermo Scientific, IL, USA).
Radioactivity in the cells and medium was measured using both a γ-counter (MINAXI Auto-Gamma 5000 Series Gamma Spectrometer, United Technologies Packard), followed by liquid scintillation β-counting (Packard 1600 TR Beta Spectrometer, United Technologies Packard) after 99mTc had decayed away. Radioactivity uptake results were expressed as a cell/medium uptake ratio: dpm/mg cell protein / dpm/µl of medium (µl medium/mg cell protein).
Cell proliferation and doubling time studies
were performed as previously described (22). Briefly, the experimental cell lines HCT116 and SW620 were placed on 75cm plates, 100,000 viable cells per plate. 12, 24, 48, 72 and 96 hours after the placement, cells were removed by brief incubation with 0.05% Trypsin and counted. The cell number vs. time profiles were plotted and fitted to a single exponential equation to estimate doubling time. Immunoblots using antibodies against human thymidine kinase (TK) and thymidylate synthetase (TS) obtained from Santa Cruz Biotech, Santa Cruz,CA were performed as previously described (23).
Statistical analysis
Mean values and SDs were calculated using the MS Office 2003 Excel 11.0 statistical package (Microsoft). Statistical significance of differences between mean values was estimated using the independent t-test for unequal variances. P values of less than 0.05 were considered to be statistically significant.
Results
[18F]FDG and [18F]FLT microPET imaging
Sequential [18F]FDG and [18F]FLT micro PET imaging of animals bearing s.c. HCT116 or SW620 xenografts was performed at weekly intervals (Figs. 1 and 2). The maximum-voxel FDG value (%dose/cc) and total tumor FDG radioactivity (µCi/tumor) (%dose) values were determined for each of the xenografts. The maximum-voxel FDG activity was somewhat variable in both AZD1152-treated and non-treated xenografts (Figs. 3A and 4A). The normalized tumor-to-adjacent tissue FDG ratio showed considerably less variation and did not change significantly over time, nor were there any significant differences between treated and non-treated animals (Figs. S1A and S1B). Measuring the total accumulation of FDG in each tumor yielded a different profile. There was a profound effect of AZD1152-treatment on total FDG accumulation in HCT116 xenografts (Fig. 3B); this profile change was also significant for SW620 xenografts, but it was less striking Fig. 4B). The amount of FDG accumulated in both SW620 and HCT116 was much lower in AZD1152-treated animals than that in controls, which largely reflects differences in tumor volume (Figs 3E and 4E). After the end of the treatment, both xenografts showed a rebound effect.
Fig 1.

Sequential imaging of representative HCT116 flank xenografts (dotted circle). [18F]FDG (A) and [18F]FLT (B) microPET 2D transaxial images through a HCT116 xenograft from the same control animal and from the same AZD1152-treated animal are shown. * The first [18F]FDG study in the treatment group (day 7) was performed under anesthesia during the entire study; in all other studies the animals were awake after radiotracer injection until time of imaging. Note the central area of necrosis (low tracer uptake) as the xenografts get larger.
Fig 2.

Sequential imaging of representative SW620 flank xenografts (dotted circle). [18F]FDG uptake (A) and [18F]FLT (B) microPET 2D transaxial images through a SW620 xenograft from the same control animal and from the same AZD1152-treated animal are shown. Note the central area of necrosis (low tracer uptake) as the xenografts get larger.
Fig 3.
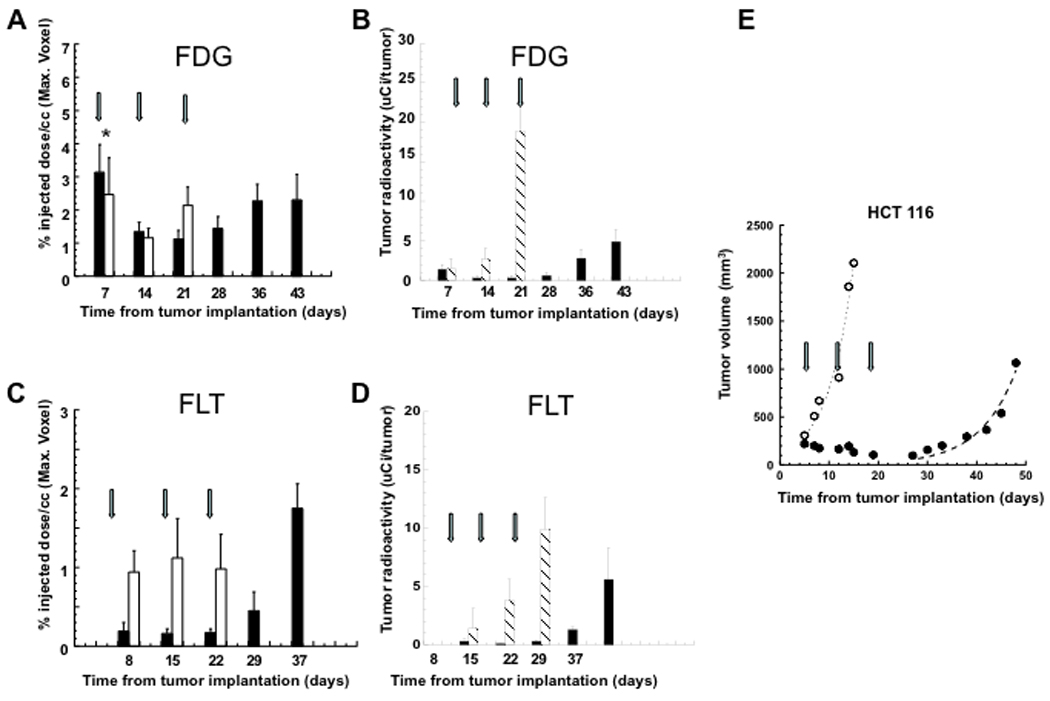
Measurements of [18F]FDG and [18F]FLT uptake in HCT116 xenografts. Units are %ID/cc of the maximum-voxel value (A, C), and µCi of total tumor radioactivity (B, D). Hatched bar represents non-treated, control animals; solid bar represents AZD1152-treated animals. Growth profiles of HCT116 s.c. xenografts (E). Open circles represent the mean tumor volume of untreated (control) animals. Closed circles represent the mean tumor volume of AZD1152-treated animals. Arrows show the beginning of each two-day AZD1152 treatment cycle; the day post implantation is shown in the abcissa. * Indicates that the first [18F]FDG study in the treatment group (day 7) was performed under anesthesia during the entire study; in all other studies the animals were awake after radiotracer injection until time of imaging.
Fig 4.

Measurements of [18F]FDG and [18F]FLT uptake (%dose/g) in SW620 xenografts. Units are %ID/cc of the maximum-voxel value (A, C), and µCi of total tumor radioactivity (B, D). normalized uptake ratios of xenograft-to-surrounding tissue (B, D). Hatched bar represents non-treated, control animals; solid bar represents AZD1152-treated animals. Growth profiles of SW620 s.c. xenografts (E). Open circles represent the mean tumor volume of untreated (control) animals. Closed circles represent the mean tumor volume of AZD1152-treated animals. Arrows shows the beginning of each two-day AZD1152 treatment cycle; the day post implantation is shown in the abcissa.
The pattern of tumor radiotracer uptake with [18F]FLT imaging in HCT116 and SW620 xenografts was somewhat different than that observed with [18F]FDG. The maximum-voxel FLT activity (%ID/cc) in untreated HCT116 xenografts was ~10-fold higher than that in untreated SW620 xenografts (p<0.001) (Figs. 4C and 5C), and a similar pattern was observed after calculating total FLT accumulation per tumor. Radioactivity levels in both AZD1152-treated and non-treated SW620 xenografts were at or near background levels (Fig. 4C) and the SW620 xenograft-to-surrounding tissue ratio was very low, ~1.5 (Fig S1D). If background radioactivity is subtracted from that measured in the xenografts, the difference between HCT116 and SW620 xenografts is 37-fold (1.01±0.09 %ID/g vs 0.028±0.005 %ID/g, respectively). FLT accumulation in HCT116 xenografts was high in non-treated control animals, and was significantly less in AZD1152-treated animals (p<0.05) (Fig. 3C and 3D). During the latter post-treatment period, FLT activity in HCT116 xenografts showed a marked rebound, reaching a significantly higher value (p<0.05) than that measured in non-treated xenografts (Fig. 3C). The normalized tumor-to-adjacent tissue FLT ratio demonstrates a similar profile (Fig. S1 C).
Fig 5.
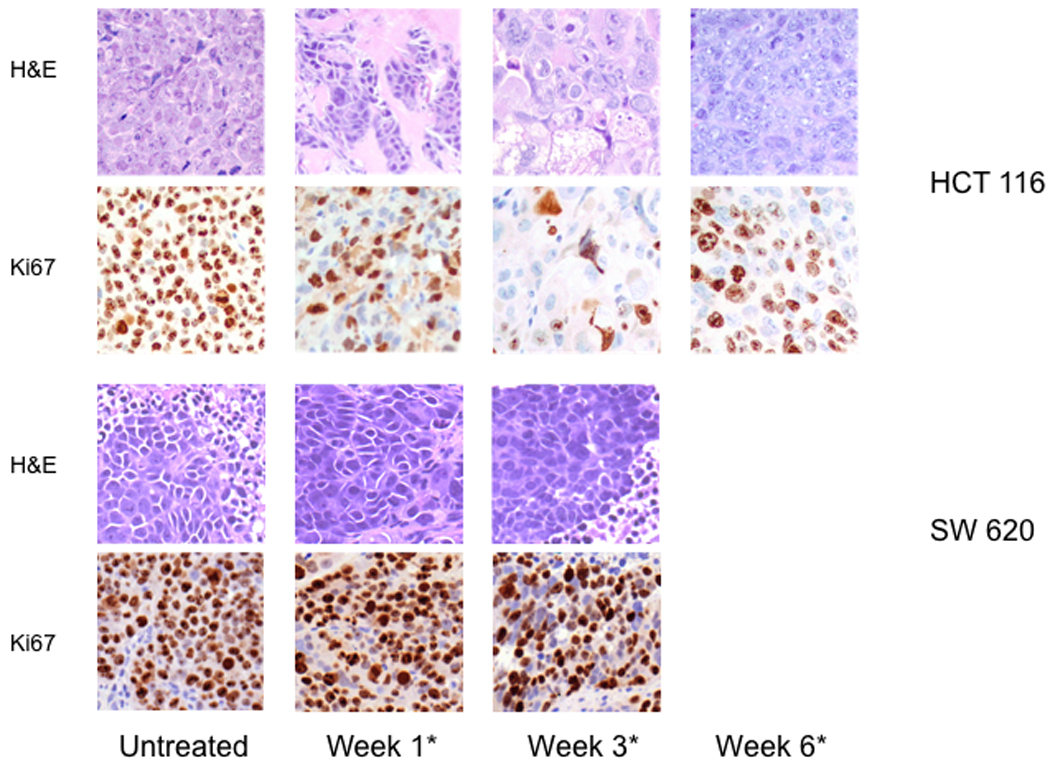
Immunohistochemistry. H&E and Ki67 staining of tumor samples acquired from experimental animals bearing HCT116 and SW620 xenografts at the different time points of the study.
AZD1152 treatment effect on HCT116 and SW620 xenograft growth profiles
Non-treated HCT116 and SW620 s.c. xenografts showed an exponential increase in tumor volume during the study period with estimated doubling times of 3.6 ± 0.5 and 8.1 ± 0.8 days, respectively (Fig. 4C and 5A). A clear response to weekly treatment with AZD1152 (100 mg/kg i.p. injections on two consecutive days per week over a 3 week interval) was observed in both HCT116 and SW620 xenografts. However, the xenograft growth profiles were different. HCT116 xenografts stopped growing immediately after the first treatment and decreased in size during the three treatment cycles. In contrast, SW620 xenografts continued to grow during AZD1152 treatment, but showed a decrease in growth rate during the three cycles of treatment. Following the cessation of treatment, there was a fairly rapid resumption of exponential growth of HCT116 xenografts with a doubling time of 5.1 ± 0.7 days. In contrast, SW620 xenografts showed a ~10 day delay in the resumption of exponential growth with a doubling time of 9.4 ± 1.5 days.
Histology and Ki67 Immunohistochemistry
AZD1152 treatment of experimental animals, bearing HCT116 xenografts induced the formation of large multinucleated-giant tumor cells, with a marked decline in Ki67 staining over the treatment period (Fig. 5). Samples collected from untreated animals showed normal tumor morphology with a robust pattern of Ki67 staining. In contrast, SW620 xenografts treated with AZD1152 did not demonstrate comparable changes in morphology or Ki67 expression, suggesting little or no change in proliferation (Fig 5).
AZD1152-HQPA, MTX and 5FU treatment, in vitro
EC50 values for AZD1152-HQPA treatment of HCT116 and SW620 cells were 10 ± 2.1 and 11 ± 3.3 nM, respectively, as determined by a clonogenic assay (Fig 6A). However, no significant effect of AZD1152-HQPA treatment was observed on [18F]FDG uptake, including exposures to 100 nM and 500 nM of AZD1152-HQPA for 1, 24 and 48 hours (Table S1, supplement). We also tested the sensitivity of the HCT116 and SW620 cell lines to MTX and 5FU. In contrast to AZD1152-HQPA, MTX and 5FU treatment yielded markedly different sensitivity results for the two cell lines (Fig 6A). SW620 cells were sensitive to MTX and 5FU, whereas HCT116 cells were not.
Fig. 6.

In vitro assessments. EC50 estimates for AZD1152-HQPA, methotrexate (MTX) and 5-fluorouracil (5FU) in HCT116 and SW620 cell lines (A). Immunoblots for thymidine kinase (TK), thymidylate synthase (TS) and α tubulin in HCT116 and SW620 cells (B). [3H]FLT, [14C]TdR and [99mTc]DTPA accumulation in HCT116 and SW620 cells (C); data are plotted as radioactivity-time profiles for each tracer; tracer uptake is expressed as (µL medium/ mg total cell protein). Proliferation-time profiles for HCT116 and SW620 cells (D).
[3H]FLT and [14C] Thymidine Uptake and Immunoblots in HCT116 and SW620 cells
To assess whether the different patterns of FLT uptake observed in HCT116 and SW620 xenografts were also reflected in cell culture uptake studies, the accumulation of [3H]-FLT, [14C]-thymidine ([14C]TdR) and [99mTc]DTPA (extracellular fluid reference) in HCT116 and SW620 cells was compared (Fig. 6C). The accumulation rate of [3H]-FLT and [14C]TdR radioactivity was 8-fold more rapid in HCT116 cells than that in SW620 cells: 1.4 ± 0.3 and 4.3 ±0.5 ul/mg/min, respectively, for HCT116 versus 0.18 ± 0.15 and 0.55 ±0.23 ul/mg/min for SW620. The corresponding in vitro growth profiles of HCT116 and SW620 cells were obtained (Fig. 6D), and the calculated exponential growth doubling time was 14.1±0.7 and 20.9±0.4 hours, respectively. Immunoblots for thymidine kinase (TK) and thymidylate synthetase (TS) levels in HCT116 cells during rapid-exponential growth showed slightly higher expression than that in SW620 cells Fig. 6B). Conversely, SW620 cells showed slightly higher levels of TS than HCT116 cells (Fig. 6B). These differences are not large, but consistent with HCT 116 cells being better able to salvage thymidine in comparison to SW620 cells. However, impairment of thymidine uptake in SW620 cells cannot be excluded and needs to be investigated further.
Discussion
AZD1152 is effective in inhibiting the growth of two human colorectal/colonic cancer cell lines (HCT116 and SW620) in culture and xenografts in nude mice (9, 13, 23) (Figs 3E and 4E). Both cell lines were sensitive to AZD1152-HQPA in the low nano-molar range. A robust treatment response based on tumor volume measurements was clearly obtained in HCT116 xenografts using a weekly schedule of i.p. AZD1152 administration (100 mg/kg i.p. injections daily on two consecutive days per week), a dose schedule previously reported to be effective in mice (9). The treatment response of SW620 xenografts was somewhat delayed and less robust compared to the HCT116 xenograft response.
One question we asked was whether [18F]FDG or [18F]FLT PET imaging could predict treatment response “early”, within several days or weeks of initiating treatment. Since hematologic toxicity is observed with prolonged administration of AZD1152 (31), early assessment of treatment response could be important in at least two respects. First, if it is possible to identify a non-responding tumor “early” by [18F]FDG or [18F]FLT PET imaging, would the imaging results be sufficient criteria for discontinuing AZD1152 treatment before hematologic toxicity develops? Second, could PET imaging be used to establish the minimum effective dose of AZD1152 in individual patients and thereby reduce hematologic toxicity during prolonged administration of the drug?
The [18F]FDG PET imaging results were surprising given the tumor volume treatment responses that were observed in both xenograft models. Sequential FDG PET imaging results showed little or no difference in FDG uptake between AZD1152-treated and non-treated xenografts, when the radioactivity data are expressed as maximum-voxel values. [FOOTNOTE: Measures based on maximum-voxel values are used to avoid partial volume imaging effects for small tumors; measures based on region of interest (ROI) measurements are usually used for larger tumors.] These results suggested that glucose utilization by HCT116 and SW620 tumor cells is not significantly influenced by AZD1152 treatment, although treatment does have a significant effect on tumor growth and volume. However, this finding was inconsistent with our understanding of the mechanism of AZD1152 anti-tumor effects (9). The major regulatory pathways of glucose metabolism are largely mediated through insulin receptor (IR) signaling and the AMP activated protein kinase signaling pathways (24–27). Since the IR and the AMP signaling pathways are activated by Aurora Kinases, selective inhibition of Aurora Kinases (and Aurora Kinase B, in particular) was expected to reduce tumor glucose utilization.
When the FDG results are expressed as total tumor metabolism (or radioactivity) as has previously been suggested (15), a highly significant AZD1152 treatment effect was observed in both HCT116 and SW620 xenografts. However, the total tumor metabolic response observed in this study largely reflects differences in tumor volume between treated and non-treated tumors, not a change in glucose metabolism of tumor cells within an imaging voxel. The absence of a drug-effect on maximum-voxel FDG uptake is more clearly appreciated when the xenograft values were normalized to that of the surrounding, non-tumor tissue; this normalization accounts in part for inter-animal variations and FDG input function differences. Thus, FDG PET may not be a useful paradigm for non-invasive monitoring of AZD1152 treatment-response, at least as reflected in these two animal xenograft models.
The [18F]FLT PET imaging studies also yielded surprising results. SW620 xenografts showed little or no accumulation of [18F]FLT above background levels and there was no difference in [18F]FLT accumulation between AZD1152-treated and non-treated SW620 xenografts. These results conflicted with the robust Ki67 staining pattern observed in untreated SW620 xenografts. In contrast, [18F]FLT uptake in untreated HCT116 xenografts was 10-fold higher than that in untreated SW620 xenografts, and this difference was 37-fold when the values are corrected for background radioactivity. The [18F]FLT imaging-response pattern following AZD1152 treatment of HCT116 xenografts was also quite different. [18F]FLT uptake decreased to 20% or less of that measured in non-treated HCT116 xenografts over the three week treatment period, and these imaging results were consistent with the decrease in Ki67 staining following AZD1152 treatment.
[18F]FLT, as well as [11C]thymidine ([11C]TdR) tumor proliferation imaging depends on two major components: i) transport of pyrimidine nucleotides across cell membranes and ii) the activity of thymidine kinase. Both components are highly regulated and the expression levels of both transporter and kinase depend on the cell cycle and rate of cell proliferation (28–30). Another determinant, which is sometimes ignored in [18F]FLT and [11C]TdR PET imaging studies, is an assessment of whether the endogenous pathway of thymidine synthesis is active in the cell or whether exogenous thymidine is the dominant source of the nucleotide for DNA synthesis via the “salvage pathway” (31).
To further test whether the de novo pathway of thymidine synthesis was dominant in SW620 cells, but not in HCT116 cells, we performed four different in vitro assays. First, we found an 8-fold difference in the rates [14C] thymidine and [3H]FLT accumulation in HCT116 and SW620 cells in culture, , which demonstrated an impairment of tracer uptake (the combination of transport and phosphorylation) of these compounds in SW620 cells. This suggests that utilization of exogenous thymidine as a salvage mechanism may be less predominant in the SW620 cell line. Second, we found only a small (1.5-fold) difference in the exponential doubling time between the two cell lines. Third, we tested the sensitivity of HCT116 and SW620 cells to MTX and 5FU and found a marked difference between the two cell lines consistent with prior studies (32). Fourth, we performed immunoblots for thymidine kinase and thymidylate synthetase. The immunoblots for TK and TS protein showed slightly lower levels of TK in SW620 cells, but this difference was not considered significant and may not be an accurate measure of intracellular enzymatic activity. In total, these in vitro results are consistent with the imaging results described above, and are also consistent with SW620 cells relying mainly on the de novo pathway of TdR synthesis. Although HCT116 cells do incorporate TdR at a higher rate than SW620 cells, consistent with the tumor imaging studies, it is not clear if the lower EC50 values for MTX and 5FU in the SW620 cell line are attributable only to lower salvage of TdR in this cell line. Further studies will be required to more fully address this question. However, inhibition of Aurora Kinases A and B has been shown to result in the down-regulation of thymidine kinase 1 (TK1) in HCT116 cells via the Rb pathway (33), through phosphorylation of histone H3 and by p53 protein stabilization and induction of p21, and this is consistent with our findings
The wide disparity in [18F]FLT PET imaging between untreated HCT116 and SW620 xenografts (37-fold, background-corrected) compared to a 2.3-fold difference in tumor doubling time, respectively, provides a striking example of potential limitations associated with [18F]FLT (and [11C]TdR) tumor proliferation imaging studies. We suggest that these results highlight the importance of determining the contribution of the de novo pathway of thymidine synthesis when [18F]FLT or [11C]TdR PET is used to image and monitor tumor proliferation. The PET studies image/measure the exogenous component of thymidine incorporation into DNA via the salvage pathway. When the fraction of thymidine synthesized via the de novo pathway and incorporated into DNA increases, the magnitude of [18F]FLT and [11C]TdR uptake in the tumor is correspondingly reduced.
Although this issue is frequently ignored in clinical studies using [18F]FLT or [11C]TdR PET to image and measure tumor proliferation, the initial studies establishing the tumor-proliferation imaging paradigms clearly identified de novo thymidine synthesis as a potential limitation and a confounding factor for quantitation of proliferation (31, 34). A review of multiple publications (35–50) and more than 300 cancer patients imaged with [18F]FLT demonstrated that [18F]FLT was accumulated above background in the vast majority of the reported imaging studies. These studies included a preponderance of lung/thoracic tumors (130 patients), followed by glioma (n=52), lymphoma, pancreatic, breast and colon tumors (n=17–34), as well as a smaller numbers of other cancers. Nevertheless, “false negative” [18F]FLT imaging results are recorded in about 10% of patient studies, and we suspect that this percentage is actually higher than what has been reported in the literature. For example, 2/23 patients with non-small cell lung cancer, 3/9 patients with lung metastases (2 colorectal, 1 melanoma), and 1/1 pulmonary carcinoid who had [18F]FLT imaging were classified as “false negative” scans (51). Other studies have noted that some tumors imaged well with [18F]FDG, but not with [18F]FLT or that some tumors with low FLT uptake had moderate Ki67 staining, despite an overall correlation between these two independent measures.
Finally, what remains unexplored in most [18F]FLT drug-response monitoring studies is whether a particular drug therapy results in a shift in TdR utilization from the salvage pathway to the de novo synthesis of thymidine or vise versa. This was recently demonstrated in a small number of patients (n=6) with breast cancer (52). This cautionary note needs wider appreciation and requires further study.
Significance
Early-assessment of treatment response using [18F]FDG and [18F]FLT PET imaging has been reported in many clinical as well as preclinical studies. In this study we tested whether [18F]FDG and [18F]FLT PET imaging, early during the course of treatment with an Aurora Kinase B inhibitor - AZD1152, could be used to monitor treatment-response in two different colon cancer xenografts models. Both imaging probes demonstrated a response to AZD1152 therapy, but in quite different ways. These differences are likely to be important considerations in the assessment treatment response using [18F]FDG and [18F]FLT PET imaging in clinical studies as well. For example, maximum-voxel values are a commonly used measure of tumor metabolic activity to reduce partial volume errors, whereas total tumor radioactivity/metabolism also takes into account changes in tumor volume. There was a significant difference between these two measures with [18F]FDG in both HCT116 and SW620 xenografts. Although [18F]FLT imaging showed a robust response in AZD1152-treated HCT116 xenografts, this was not seen in AZD1152-treated SW620 xenografts, despite prominent Ki67 staining of the tumor cells. This study presents additional data that suggests thymidine incorporation into the DNA of SW620 cells occurs predominantly through the de novo pathway of thymidine synthesis, and highlights the importance of recognizing the relative contributions of both the de novo and salvage pathways of thymidine utilization when [18F]FLT (or [11C]thymidine) PET imaging is used to image tumor proliferation or response to therapy.
Supplementary Material
Normalized [18F]FDG and [18F]FLT tumor-to-background uptake ratios in HCT116 (A, C) and SW620 (B, D) xenografts. The maximum-voxel value in tumor and adjacent background tissue was used to calculate the ratio.
Acknowledgements
This work was supported in part by funds from AstraZeneca and NIH grants CA86438, R24 CA83084 and DOE grant FG03-86ER60407. We thank Drs. Steven Larson and Pat Zanzonico (Memorial Sloan Kettering Cancer Center, New York, NY, 10021) for their help and support.
References
- 1.Gautschi O, Heighway J, Mack PC, Purnell PR, Lara PN, Jr, Gandara DR. Aurora kinases as anticancer drug targets. Clin Cancer Res. 2008 Mar 15;14(6):1639–1648. doi: 10.1158/1078-0432.CCR-07-2179. [DOI] [PubMed] [Google Scholar]
- 2.Ducat D, Zheng Y. Aurora kinases in spindle assembly and chromosome segregation. Exp Cell Res. 2004 Nov 15;301(1):60–67. doi: 10.1016/j.yexcr.2004.08.016. [DOI] [PubMed] [Google Scholar]
- 3.Fu J, Bian M, Jiang Q, Zhang C. Roles of Aurora kinases in mitosis and tumorigenesis. Mol Cancer Res. 2007 Jan;5(1):1–10. doi: 10.1158/1541-7786.MCR-06-0208. [DOI] [PubMed] [Google Scholar]
- 4.Kimura M, Matsuda Y, Yoshioka T, Okano Y. Cell cycle-dependent expression and centrosome localization of a third human aurora/Ipl1-related protein kinase, AIK3. J Biol Chem. 1999 Mar 12;274(11):7334–7340. doi: 10.1074/jbc.274.11.7334. [DOI] [PubMed] [Google Scholar]
- 5.Gautschi O, Mack PC, Davies AM, Lara PN, Jr, Gandara DR. Aurora kinase inhibitors: a new class of targeted drugs in cancer. Clin Lung Cancer. 2006 Sep;8(2):93–98. doi: 10.3816/CLC.2006.n.036. [DOI] [PubMed] [Google Scholar]
- 6.Mortlock AA, Foote KM, Heron NM, Jung FH, Pasquet G, Lohmann JJ, et al. Discovery, synthesis, and in vivo activity of a new class of pyrazoloquinazolines as selective inhibitors of aurora B kinase. J Med Chem. 2007 May 3;50(9):2213–2224. doi: 10.1021/jm061335f. [DOI] [PubMed] [Google Scholar]
- 7.Yang J, Ikezoe T, Nishioka C, Tasaka T, Taniguchi A, Kuwayama Y, et al. AZD1152, a novel and selective aurora B kinase inhibitor, induces growth arrest, apoptosis, and sensitization for tubulin depolymerizing agent or topoisomerase II inhibitor in human acute leukemia cells in vitro and in vivo. Blood. 2007 Sep 15;110(6):2034–2040. doi: 10.1182/blood-2007-02-073700. [DOI] [PubMed] [Google Scholar]
- 8.Evans RP, Naber C, Steffler T, Checkland T, Maxwell CA, Keats JJ, et al. The selective Aurora B kinase inhibitor AZD1152 is a potential new treatment for multiple myeloma. Br J Haematol. 2008 Feb;140(3):295–302. doi: 10.1111/j.1365-2141.2007.06913.x. [DOI] [PubMed] [Google Scholar]
- 9.Wilkinson RW, Odedra R, Heaton SP, Wedge SR, Keen NJ, Crafter C, et al. AZD1152, a selective inhibitor of Aurora B kinase, inhibits human tumor xenograft growth by inducing apoptosis. Clin Cancer Res. 2007 Jun 15;13(12):3682–3688. doi: 10.1158/1078-0432.CCR-06-2979. [DOI] [PubMed] [Google Scholar]
- 10.Walsby E, Walsh V, Pepper C, Burnett A, Mills K. Effects of the aurora kinase inhibitors AZD1152-HQPA and ZM447439 on growth arrest and polyploidy in acute myeloid leukemia cell lines and primary blasts. Haematologica. 2008 May;93(5):662–669. doi: 10.3324/haematol.12148. [DOI] [PubMed] [Google Scholar]
- 11.Dancey JE. Kinase Inhibitor 4 Minisymposium summary. Expert Rev Anticancer Ther. 2009 Jul;9(7):891–894. doi: 10.1586/era.09.66. [DOI] [PubMed] [Google Scholar]
- 12.Oke A, Pearce D, Wilkinson RW, Crafter C, Odedra R, Cavenagh J, et al. AZD1152 rapidly and negatively affects the growth and survival of human acute myeloid leukemia cells in vitro and in vivo. Cancer Res. 2009 May 15;69(10):4150–4158. doi: 10.1158/0008-5472.CAN-08-3203. [DOI] [PMC free article] [PubMed] [Google Scholar]
- 13.Nair JS, de Stanchina E, Schwartz GK. The topoisomerase I poison CPT-11 enhances the effect of the aurora B kinase inhibitor AZD1152 both in vitro and in vivo. Clin Cancer Res. 2009 Mar 15;15(6):2022–2030. doi: 10.1158/1078-0432.CCR-08-1826. [DOI] [PubMed] [Google Scholar]
- 14.Hopert A, Uphoff CC, Wirth M, Hauser H, Drexler HG. Specificity and sensitivity of polymerase chain reaction (PCR) in comparison with other methods for the detection of mycoplasma contamination in cell lines. J Immunol Methods. 1993 Aug 26;164(1):91–100. doi: 10.1016/0022-1759(93)90279-g. [DOI] [PubMed] [Google Scholar]
- 15.Humm JL, Lee J, O'Donoghue JA, Squire O, Ling CC, Pentlow K, et al. Changes in FDG Tumor Uptake during and after Fractionated Radiation Therapy in a Rodent Tumor Xenograft. Clin Positron Imaging. 1999 Oct;2(5):289–296. doi: 10.1016/s1095-0397(99)00031-x. [DOI] [PubMed] [Google Scholar]
- 16.Huhnt W, Lubbe AS. Growth, microvessel density and tumor cell invasion of human colon adenocarcinoma under repeated treatment with hyperthermia and serotonin. J Cancer Res Clin Oncol. 1995;121(7):423–428. doi: 10.1007/BF01212950. [DOI] [PubMed] [Google Scholar]
- 17.Lalor PA, Mapp PI, Hall PA, Revell PA. Proliferative activity of cells in the synovium as demonstrated by a monoclonal antibody, Ki67. Rheumatol Int. 1987;7(5):183–186. doi: 10.1007/BF00541375. [DOI] [PubMed] [Google Scholar]
- 18.Kim EJ, Yoo JY, Choi YH, Ahn KJ, Lee JD, Yun CO, et al. Imaging of viral thymidine kinase gene expression by replicating oncolytic adenovirus and prediction of therapeutic efficacy. Yonsei Med J. 2008 Oct 31;49(5):811–818. doi: 10.3349/ymj.2008.49.5.811. [DOI] [PMC free article] [PubMed] [Google Scholar]
- 19.Guda K, Natale L, Markowitz SD. An improved method for staining cell colonies in clonogenic assays. Cytotechnology. 2007 Jun;54(2):85–88. doi: 10.1007/s10616-007-9083-2. [DOI] [PMC free article] [PubMed] [Google Scholar]
- 20.Barnes MJ, Estlin EJ, Taylor GA, Aherne GW, Hardcastle A, McGuire JJ, et al. Impact of polyglutamation on sensitivity to raltitrexed and methotrexate in relation to drug-induced inhibition of de novo thymidylate and purine biosynthesis in CCRF-CEM cell lines. Clin Cancer Res. 1999 Sep;5(9):2548–2558. [PubMed] [Google Scholar]
- 21.Bektas M, Johnson SP, Poe WE, Bigner DD, Friedman HS. A sphingosine kinase inhibitor induces cell death in temozolomide resistant glioblastoma cells. Cancer Chemother Pharmacol. 2009 Jul 12; doi: 10.1007/s00280-009-1063-0. [DOI] [PMC free article] [PubMed] [Google Scholar]
- 22.Roper PR, Drewinko B. Comparison of in vitro methods to determine drug-induced cell lethality. Cancer Res. 1976 Jul;36(7 PT 1):2182–2188. [PubMed] [Google Scholar]
- 23.Magro PG, Russo AJ, Li WW, Banerjee D, Bertino JR. p14ARF expression increases dihydrofolate reductase degradation and paradoxically results in resistance to folate antagonists in cells with nonfunctional p53. Cancer Res. 2004 Jun 15;64(12):4338–4345. doi: 10.1158/0008-5472.CAN-03-1045. [DOI] [PubMed] [Google Scholar]
- 24.Carling D, Aguan K, Woods A, Verhoeven AJ, Beri RK, Brennan CH, et al. Mammalian AMP-activated protein kinase is homologous to yeast and plant protein kinases involved in the regulation of carbon metabolism. J Biol Chem. 1994 Apr 15;269(15):11442–11448. [PubMed] [Google Scholar]
- 25.Carling D. The role of the AMP-activated protein kinase in the regulation of energy homeostasis. Novartis Found Symp. 2007;286:72–81. doi: 10.1002/9780470985571.ch7. discussion -5, 162-3, 96–203. [DOI] [PubMed] [Google Scholar]
- 26.Barnes BR, Zierath JR. Role of AMP--activated protein kinase in the control of glucose homeostasis. Curr Mol Med. 2005 May;5(3):341–348. doi: 10.2174/1566524053766103. [DOI] [PubMed] [Google Scholar]
- 27.Braiman L, Alt A, Kuroki T, Ohba M, Bak A, Tennenbaum T, et al. Protein kinase Cdelta mediates insulin-induced glucose transport in primary cultures of rat skeletal muscle. Mol Endocrinol. 1999 Dec;13(12):2002–2012. doi: 10.1210/mend.13.12.0393. [DOI] [PubMed] [Google Scholar]
- 28.Bradshaw HD., Jr Molecular cloning and cell cycle-specific regulation of a functional human thymidine kinase gene. Proc Natl Acad Sci U S A. 1983 Sep;80(18):5588–5591. doi: 10.1073/pnas.80.18.5588. [DOI] [PMC free article] [PubMed] [Google Scholar]
- 29.Conrad AH, Ruddle FH. Regulation of thymidylate synthetase activity in cultured mammalian cells. J Cell Sci. 1972 Mar;10(2):471–486. doi: 10.1242/jcs.10.2.471. [DOI] [PubMed] [Google Scholar]
- 30.Kong XB, Zhu QY, Vidal PM, Watanabe KA, Polsky B, Armstrong D, et al. Comparisons of anti-human immunodeficiency virus activities, cellular transport, and plasma and intracellular pharmacokinetics of 3'-fluoro-3'-deoxythymidine and 3'-azido-3'-deoxythymidine. Antimicrob Agents Chemother. 1992 Apr;36(4):808–818. doi: 10.1128/aac.36.4.808. [DOI] [PMC free article] [PubMed] [Google Scholar]
- 31.Mankoff DA, Shields AF, Krohn KA. PET imaging of cellular proliferation. Radiol Clin North Am. 2005 Jan;43(1):153–167. doi: 10.1016/j.rcl.2004.09.005. [DOI] [PubMed] [Google Scholar]
- 32.Baukelien van Triest HMP, van Hensbergen Yvette, Smid Kees, Telleman Frank, Schoenmakers PascaleS, van der Wilt ClasinaL, van Laar JanAM, Noordhuis Paul, Jansen Gerrit, Peters GodefridusJ. Thymidylate Synthase Level as the Main Predictive Parameter for Sensitivity to 5-Fluorouracil, but not for Folate-based Thymidylate Synthase Inhibitors, in 13 Nonselected Colon Cancer Cell Lines. Clinical Cancer Research. 1999 March;5:643–654. [PubMed] [Google Scholar]
- 33.Chan F, Sun C, Perumal M, Nguyen QD, Bavetsias V, McDonald E, et al. Mechanism of action of the Aurora kinase inhibitor CCT129202 and in vivo quantification of biological activity. Mol Cancer Ther. 2007 Dec;6(12 Pt 1):3147–3157. doi: 10.1158/1535-7163.MCT-07-2156. [DOI] [PubMed] [Google Scholar]
- 34.Krohn KA, Mankoff DA, Eary JF. Imaging cellular proliferation as a measure of response to therapy. J Clin Pharmacol. 2001 Jul; Suppl:96S–103S. [PubMed] [Google Scholar]
- 35.Buck AK, Bommer M, Juweid ME, Glatting G, Stilgenbauer S, Mottaghy FM, et al. First demonstration of leukemia imaging with the proliferation marker 18F-fluorodeoxythymidine. J Nucl Med. 2008 Nov;49(11):1756–1762. doi: 10.2967/jnumed.108.055335. [DOI] [PubMed] [Google Scholar]
- 36.Buck AK, Bommer M, Stilgenbauer S, Juweid M, Glatting G, Schirrmeister H, et al. Molecular imaging of proliferation in malignant lymphoma. Cancer Res. 2006 Nov 15;66(22):11055–11061. doi: 10.1158/0008-5472.CAN-06-1955. [DOI] [PubMed] [Google Scholar]
- 37.Buck AK, Halter G, Schirrmeister H, Kotzerke J, Wurziger I, Glatting G, et al. Imaging proliferation in lung tumors with PET: 18F-FLT versus 18F-FDG. J Nucl Med. 2003 Sep;44(9):1426–1431. [PubMed] [Google Scholar]
- 38.Buck AK, Herrmann K, Buschenfelde CM, Juweid ME, Bischoff M, Glatting G, et al. Imaging bone and soft tissue tumors with the proliferation marker [18F]fluorodeoxythymidine. Clin Cancer Res. 2008 May 15;14(10):2970–2977. doi: 10.1158/1078-0432.CCR-07-4294. [DOI] [PubMed] [Google Scholar]
- 39.Choi SJ, Kim JS, Kim JH, Oh SJ, Lee JG, Kim CJ, et al. [18F]3'-deoxy-3'-fluorothymidine PET for the diagnosis and grading of brain tumors. Eur J Nucl Med Mol Imaging. 2005 Jun;32(6):653–659. doi: 10.1007/s00259-004-1742-3. [DOI] [PubMed] [Google Scholar]
- 40.Dittmann H, Dohmen BM, Paulsen F, Eichhorn K, Eschmann SM, Horger M, et al. [18F]FLT PET for diagnosis and staging of thoracic tumours. Eur J Nucl Med Mol Imaging. 2003 Oct;30(10):1407–1412. doi: 10.1007/s00259-003-1257-3. [DOI] [PubMed] [Google Scholar]
- 41.Francis DL, Visvikis D, Costa DC, Arulampalam TH, Townsend C, Luthra SK, et al. Potential impact of [18F]3'-deoxy-3'-fluorothymidine versus [18F]fluoro-2-deoxy-D-glucose in positron emission tomography for colorectal cancer. Eur J Nucl Med Mol Imaging. 2003 Jul;30(7):988–994. doi: 10.1007/s00259-003-1187-0. [DOI] [PubMed] [Google Scholar]
- 42.Kenny L, Coombes RC, Vigushin DM, Al-Nahhas A, Shousha S, Aboagye EO. Imaging early changes in proliferation at 1 week post chemotherapy: a pilot study in breast cancer patients with 3'-deoxy-3'-[18F]fluorothymidine positron emission tomography. Eur J Nucl Med Mol Imaging. 2007 Sep;34(9):1339–1347. doi: 10.1007/s00259-007-0379-4. [DOI] [PubMed] [Google Scholar]
- 43.Muzi M, Vesselle H, Grierson JR, Mankoff DA, Schmidt RA, Peterson L, et al. Kinetic analysis of 3'-deoxy-3'-fluorothymidine PET studies: validation studies in patients with lung cancer. J Nucl Med. 2005 Feb;46(2):274–282. [PubMed] [Google Scholar]
- 44.Schiepers C, Chen W, Dahlbom M, Cloughesy T, Hoh CK, Huang SC. 18F-fluorothymidine kinetics of malignant brain tumors. Eur J Nucl Med Mol Imaging. 2007 Jul;34(7):1003–1011. doi: 10.1007/s00259-006-0354-5. [DOI] [PubMed] [Google Scholar]
- 45.Smyczek-Gargya B, Fersis N, Dittmann H, Vogel U, Reischl G, Machulla HJ, et al. PET with [18F]fluorothymidine for imaging of primary breast cancer: a pilot study. Eur J Nucl Med Mol Imaging. 2004 May;31(5):720–724. doi: 10.1007/s00259-004-1462-8. [DOI] [PubMed] [Google Scholar]
- 46.Spence AM, Muzi M, Link JM, Hoffman JM, Eary JF, Krohn KA. NCI-sponsored trial for the evaluation of safety and preliminary efficacy of FLT as a marker of proliferation in patients with recurrent gliomas: safety studies. Mol Imaging Biol. 2008 Sep;10(5):271–280. doi: 10.1007/s11307-008-0151-6. [DOI] [PMC free article] [PubMed] [Google Scholar]
- 47.Spence AM, Muzi M, Link JM, O'Sullivan F, Eary JF, Hoffman JM, et al. NCI-sponsored trial for the evaluation of safety and preliminary efficacy of 3'-deoxy-3'-[18F]fluorothymidine (FLT) as a marker of proliferation in patients with recurrent gliomas: preliminary efficacy studies. Mol Imaging Biol. 2009 Sep–Oct;11(5):343–355. doi: 10.1007/s11307-009-0215-2. [DOI] [PMC free article] [PubMed] [Google Scholar]
- 48.Tian J, Yang X, Yu L, Chen P, Xin J, Ma L, et al. A multicenter clinical trial on the diagnostic value of dual-tracer PET/CT in pulmonary lesions using 3'-deoxy-3'-18F-fluorothymidine and 18F-FDG. J Nucl Med. 2008 Feb;49(2):186–194. doi: 10.2967/jnumed.107.044966. [DOI] [PubMed] [Google Scholar]
- 49.van Westreenen HL, Cobben DC, Jager PL, van Dullemen HM, Wesseling J, Elsinga PH, et al. Comparison of 18F-FLT PET and 18F-FDG PET in esophageal cancer. J Nucl Med. 2005 Mar;46(3):400–404. [PubMed] [Google Scholar]
- 50.Yap CS, Czernin J, Fishbein MC, Cameron RB, Schiepers C, Phelps ME, et al. Evaluation of thoracic tumors with 18F-fluorothymidine and 18F-fluorodeoxyglucose-positron emission tomography. Chest. 2006 Feb;129(2):393–401. doi: 10.1378/chest.129.2.393. [DOI] [PubMed] [Google Scholar]
- 51.Buck AK, Hetzel M, Schirrmeister H, Halter G, Moller P, Kratochwil C, et al. Clinical relevance of imaging proliferative activity in lung nodules. Eur J Nucl Med Mol Imaging. 2005 May;32(5):525–533. doi: 10.1007/s00259-004-1706-7. [DOI] [PubMed] [Google Scholar]
- 52.Kenny LM, Contractor KB, Stebbing J, Al-Nahhas A, Palmieri C, Shousha S, et al. Altered tissue 3'-deoxy-3'-[18F]fluorothymidine pharmacokinetics in human breast cancer following capecitabine treatment detected by positron emission tomography. Clin Cancer Res. 2009 Nov 1;15(21):6649–6657. doi: 10.1158/1078-0432.CCR-09-1213. [DOI] [PubMed] [Google Scholar]
Associated Data
This section collects any data citations, data availability statements, or supplementary materials included in this article.
Supplementary Materials
Normalized [18F]FDG and [18F]FLT tumor-to-background uptake ratios in HCT116 (A, C) and SW620 (B, D) xenografts. The maximum-voxel value in tumor and adjacent background tissue was used to calculate the ratio.