

Research highlights
▸ Regional homogeneity is the highest in default mode network brain regions. ▸ Regional homogeneity decreases with age, particularly in the cingulate gyrus. ▸ Females had greater local connectivity in right limbic regions compared to males.
Keywords: Regional homogeneity, Local connectivity, Resting-state fMRI, Brain development
Abstract
Regional homogeneity measures synchrony of resting-state brain activity in neighboring voxels, or local connectivity. The effects of age and gender on local connectivity in healthy subjects are unknown. We performed regional homogeneity analyses on resting state BOLD time series data acquired from 58 normal, healthy participants, ranging in age from 11 to 35 (mean 18.1 ± 5.0 years, 32 males). Regional homogeneity was found to be highest for gray matter, with brain regions within the default mode network having the highest local connectivity values. There was a general decrease in regional homogeneity with age with the greatest reduction seen in the anterior cingulate and temporal lobe. Greater female local connectivity in the right hippocampus and amygdala was also noted, regardless of age. These findings suggest that local connectivity at the millimeter scale decreases during development as longer connections are formed, and underscores the importance of examining gender differences in imaging studies of healthy and clinical populations.
1. Introduction
Brain maturation is thought to occur in a back-to-front direction with sensorimotor regions developing first followed by higher-order association areas and lastly, heteromodal association regions including those found in the prefrontal and lateral temporal cortices (Marsh et al., 2008). The integration of somatosensory information occurs in heteromodal association regions, which receive information from both short and long-range cortico–cortico and cortico–subcortical connections (Buckner et al., 2009, Fornari et al., 2007). It has been reported that in normative brain development, short-range connections between brain regions, such as interhemispheric connections, decrease with age, while long-range connections, such as anterior–posterior connections, increase with age. For example Uddin et al. (2010) found that functional brain development is characterized by pruning of local network connectivity and strengthening of long-range network connectivity with age. Dosenbach et al. (2010) also found that the weakening of short-range functional connections in the brain's major functional networks was the greatest predictor of brain maturity as indexed by chronological age. A shift in task-based fMRI activation patterns from diffuse to focal activity with increasing age (Durston and Casey, 2006) has also been reported. These developmental brain changes are thought to result in hemispheric specialization/lateralization, increased efficiency and reduced redundancy, a process that has been termed segregation and integration (Dosenbach et al., 2010, Fair et al., 2007, Fair et al., 2008, Fair et al., 2009, Supekar et al., 2009, Uddin et al., 2010, Varela et al., 2001).
The microstructural changes that occur during brain maturation such as myelination, synaptic pruning or changes in oligodendrocytes and neurons are difficult to visualize using standard clinical neuroimaging methods. However, structural neuroimaging techniques such as high-resolution imaging and diffusion tensor imaging are increasingly being applied to the study of the regressive and progressive events underlying gray and white matter maturational events (Uddin et al., 2010). Furthermore, functional MRI (fMRI) studies have been able to provide information on the progression of development in terms of greater areas of activation in cognitive, social and emotional domains with age (Davidson et al., 2003, Yurgelun-Todd, 2007, Yurgelun-Todd and Killgore, 2006). More recently, resting-state fMRI techniques have begun to provide information regarding the development of specific brain networks with age (Dosenbach et al., 2010, Supekar et al., 2009, Uddin et al., 2010). Current approaches that have been used to evaluate brain development utilizing resting state fMRI data include hypothesis driven region of interest seed based analysis, which utilize a priori regions of interest to evaluate functional connectivity between brain regions, and independent component analysis, a model-free method which identifies a predetermined number of components or networks based on the spatial and temporal characteristics of the fMRI time series data. In addition, graph theoretical metrics are increasingly being used to describe the functional organization of large-scale networks. Such information has led to advancing knowledge regarding normative developmental trajectories and the identification of the pathophysiology of neurodevelopmental and neuropsychiatric disorders.
Historically, fMRI studies have focused primarily on evaluating “activation” or “deactivation” in regional brain neuronal activity during task-specific paradigms that incorporate a control task as the baseline (Greicius et al., 2003). A more recent neuroimaging approach for evaluating brain networks is to examine low frequency BOLD signal fluctuations present even in the absence of a task (Greicius et al., 2003). These studies have found synchronous resting-state networks (RSN) of temporally coherent, but widely separated although functionally related brain regions (Biswal et al., 1995, De Luca et al., 2006, Fox and Raichle, 2007, Greicius et al., 2003). Spatially consistent RSN have been described in both adults and youths (Damoiseaux et al., 2006, De Luca et al., 2006, Fransson, 2006). Recent studies of the maturation of RSNs suggests that early in development, RSNs are composed of predominately short or homologous interhemispheric circuits, but with age, these small scale networks develop into longer-range, more efficient networks (Fair et al., 2008, Fransson et al., 2007, Smyser et al., in press, Thomason et al., 2008) These previous studies utilized resting-state fMRI data to evaluate the impact of age on the interhemispheric and anterior–posterior connectivity between 2 or more brain regions and within and between specific brain networks. Currently, there is limited information on the normative development of local brain connectivity within a brain region. A recently developed technique to examine local connectivity, called regional homogeneity, measures the functional coherence of a given voxel with its nearest 26 neighboring voxels. This method can be used to evaluate regional resting-state brain activity and/or local connectivity at the millimeter spatial scale (Zang et al., 2004). Applying these techniques, one recent study found widespread decreased regional homogeneity in primary sensorimotor brain regions in older adults compared to younger adults (Wu et al., 2007). The current study will expand on these previous regional homogeneity findings by exploring the changes in local connectivity in adolescents and adults and evaluating all cortical and subcortical brain regions.
Brain development may differ between genders. Studies have consistently found structural and functional differences in regions of the prefrontal cortex, hippocampus, amygdala and basal ganglia in males compared to females (Caviness et al., 1996, Giedd et al., 1996, Kilgore and Yurgelun-Todd, 2001, Pruessner et al., 2001, Schlaepfer et al., 1995, Shirao et al., 2005, Yurgelun-Todd and Killgore, 2006). Overall brain size has been reported as significantly greater in men (Christova et al., 2008, Kaiser et al., 2009, Leonard et al., 2008, Luders et al., 2002), while higher processing efficiencies as well as increased lateralization between hemispheres in women has been suggested as a possible reason for smaller total brain volumes overall (Christova et al., 2008). Cortical complexity has also been reported to be greater in women, specifically in frontal and parietal regions (Gur et al., 1999, Luders et al., 2002, Luders et al., 2004), and cortical thickness has been found to be higher in women in right posterior temporal and right inferior parietal regions (Sowell et al., 2007). Functional MRI studies have also reported gender-related differences in terms of BOLD activation in prefrontal and limbic regions during emotional and cognitive tasks (Adler et al., 2005, Boghi et al., 2006, Cahill et al., 2004b, Christova et al., 2008, Derntl et al., 2010, Henderson et al., 2008, Hofer et al., 2006, Keller and Menon, 2009, McRae et al., 2008, Schulte-Ruther et al., 2008).
This study seeks to examine the impact of age, gender and their interaction, on measures of local connectivity within individual brain regions in a sample of healthy controls (HC) utilizing resting-state fMRI data. As stated before, there are few available studies that have evaluated the impact of development on measures of local brain connectivity (Wu et al., 2007), and none which have examined age, gender and their interaction with local connectivity within brain regions. One study in adults restricted their evaluation to primary sensorimotor brain regions and found decreased regional homogeneity in older adults compared to younger adults (Wu et al., 2007). Three previous studies utilizing regional homogeneity techniques found that adults had greater local connectivity in brain regions composing the default-mode network (He et al., 2007, Long et al., 2008, Wu et al., 2007, Zang et al., 2004). Investigations of regional homogeneity have been applied to the study of Alzheimer's disease (He et al., 2007), depression (Yuan et al., 2008), ADHD (Cao et al., 2006, Zhu et al., 2005) and autism spectrum disorders (Paakki et al., 2010). The current study is aimed at evaluating local connectivity within individual brain regions in youths and adults and assessing whether or not gender differences exist. We hypothesize that local connectivity will decrease in all brain regions with age based on previous findings in adults (Wu et al., 2007) and that regional homogeneity will be the highest for brain regions that compose the default mode network (DMN). In addition, we predict that if there are differences in developmental trajectories between genders, they will be present in regions of the prefrontal cortex, basal ganglia and limbic structures based on previous findings of gender differences in these structures
2. Methods
2.1. Subject characteristics
Fifty-eight normal, healthy participants, ranging in age from 11 to 35 (mean 18.1 ± 5.0 years, 32 males, 26 females) were included in this study. A subset of 27 of these were previously included in a report describing PSTCor methods for the analysis of resting-state data (Anderson et al., in press). Demographic and clinical characteristics of the participants are shown in Table 1. Subjects were examined after informed consent, in accordance with procedures approved by the University of Utah Institutional Review Board. Healthy subjects had no DSM-IV Axis I diagnoses based on diagnostic semi-structured psychiatric interview. All participants underwent psychiatric screening via the Structured Clinical Interview for DSM-IV Patient Version (SCID-P), which is a widely used diagnostic instrument to reliably determine Axis I disorders in clinical populations (First et al., 1996). All subjects were screened for anxiety by Hamilton anxiety rating scale (Hamilton, 1969) and depression by Hamilton depression rating scale (Hamilton, 1960) immediately prior to MRI scanning. No significant differences were seen with gender using 2-tailed t-tests in Hamilton anxiety (p = 0.48) or Hamilton depression (p = 0.28) metrics. A positive correlation was seen between age and Hamilton depression (r = 0.30, p = 0.023) scores but not between age and Hamilton anxiety (r = 0.19, p = 0.15) scores.
Table 1.
Demographic and clinical characteristics of control subjects.
| n | % | |
|---|---|---|
| Total | 58 | – |
| Male (n) | 32 | 55.2 |
| Female (n) | 26 | 44.8 |
| Right handed | 55 | 94.8 |
| Ethnicity | ||
| White, non-hispanic | 48 | 82.8 |
| Hispanic or Latino | 8 | 13.8 |
| Black or African American | 1 | 1.7 |
| Asian | 1 | 1.7 |
| Mean | STDa | |
| Age | 18.09 | 4.950 |
| HAM-Db | 0.98 | 1.369 |
| HAM-Ac | 2.04 | 2.632 |
Standard deviation.
Hamilton rating scale for depression.
Hamilton anxiety rating scale.
Exclusion criteria for all subjects included: major sensorimotor handicaps; full scale IQ < 70, learning disability, history of claustrophobia, head trauma, loss of consciousness, autism, schizophrenia, anorexia or bulimia nervosa, a past/present history of alcohol or drug dependence/abuse based on DSM-IV criteria, electroconvulsive therapy; active medical or neurological disease; metal fragments or implants; and current pregnancy or lactation. Data from two additional subjects were discarded prior to analysis due to excessive patient motion during scanning.
2.2. Data acquisition
Images were acquired on a Siemens 3 Tesla Trio scanner with 12-channel head coil. The scanning protocol consisted of an initial 1 mm isotropic MPRAGE acquisition acquired in the axial plane for an anatomic template. BOLD echo planar images (TR = 2.0 s, TE = 28 ms, GRAPPA parallel acquisition with acceleration factor = 2, 40 slices at 3 mm slice thickness, 64 × 64 matrix) were obtained during the resting state, where subjects were instructed to “Keep your eyes open and remain awake and try to let thoughts pass through your mind without focusing on any particular mental activity.” Prospective motion correction was performed during BOLD imaging with PACE sequence. An 8-min scan (240 volumes) was obtained for each subject. An additional field map scan was obtained for each subject for the purposes of distortion correction.
For all BOLD sequences, simultaneous plethysmograph (pulse oximeter) and chest excursion (respiratory belt) waveforms were recorded for offline analysis. Waveforms were recorded directly on the scanning computer, allowing synchronization of images with physiological waveforms. The stimulus computer was synchronized to the onset of the first BOLD image via fiber optic pulse emitted by the scanner.
2.3. fMRI pre-processing
The following sequence was used for image post-processing of all BOLD image datasets.
-
1.
RETROICOR (Glover et al., 2000) was performed using AFNI software package (Cox, 1996) for initial correction of signal components due to respiratory and cardiac artifacts.
-
2.
SPM8 software (Wellcome Trust, London) was used to perform slice timing correction, realign and unwarp (distortion correction and concurrent motion correction), coregistration, segmentation, and normalization to MNI template brain (T1.nii) of all BOLD images. Gray matter, white matter, CSF, and BOLD images were sampled at 3 × 3 × 3 mm resolution in this step corresponding to acquisition resolution of BOLD images.
-
3.
PSTCor methods were implemented to analyze the resting-state data (Anderson et al., in press). Briefly, a regression analysis was performed in which the best fit of 12 time series signal components was subtracted from the time series at each voxel. Signal components were (1) white matter time series obtained from voxels within 2 regions of interest in the bilateral centrum semiovale, (2) CSF time series obtained from the lateral ventricles, (3) soft tissue time series obtained from head and face, (4) respiration volume per time convolved with respiration response function (Birn et al., 2008, Chang et al., 2009), (5) respiratory belt waveform, integrated over each TR of acquisition, (6) pulse oximeter waveform, integrated over each TR of acquisition, and (7–12) motion realignment parameters. The first 6 time series were phase shifted to optimally align with mean gray matter time series prior to regression. During regression, each voxel's time series was bandpass filtered with ideal Chebyshev filter between 0.001 and 0.1 Hz, and a linear detrend operation was performed.
The effect of the PSTCor step is to remove low-frequency fluctuations attributable to vascular, respiratory, and other non-neural fluctuations that may bias the results. The global mean signal was not regressed from the BOLD fluctuations because this process has been shown to subtract a copy from many voxels of the correlated fluctuations from large brain networks (Anderson et al., in press). This would have the effect of possibly altering regional homogeneity by adding a component to the fluctuations that is dependent on the size of the networks to which a voxel belongs. Because PSTCor does not use any components from gray matter sources to obtain regression parameters, it is hoped that the effect of subtracting components in some brain regions from those of gray matter sources in other brain regions will be less likely to arise. By performing this step, artifactual sources of altered regional homogeneity attributable to higher or lower vascular density are also mitigated.
2.4. Regional homogeneity (local connectivity)
Regional homogeneity calculations were performed on unsmoothed PSTCor-corrected data. Kendall's coefficient of concordance (KCC) (Kendall and Gibbons, 1990) was calculated to represent the similarity of the time series of each 26 nearest neighboring voxels with the KCC assigned to the center voxel (Paakki et al., 2010, Zang et al., 2004, Zang et al., 2007), generating a regional homogeneity measurement at each voxel in the image. Calculation of regional homogeneity images was performed using the Resting-State fMRI Data Analysis Toolkit (REST, by Song Xiao-Wei et al., http://www.restfmri.net/). Resulting regional homogeneity images were smoothed (SPM8) with 8 × 8 × 8 mm FWHM kernel.
2.5. Atlas segmentation and longer-range connectivity measures
The Automated Anatomical Labeling (AAL) brain atlas (Tzourio-Mazoyer et al., 2002) was used to assess regional differences in local connectivity. This atlas consists of a parcellation of the brain into 116 brain regions, normalized to MNI coordinate space, and distributed with WFU Pickatlas software (Maldjian et al., 2003). For regional homogeneity, the mean regional homogeneity in each of 116 regions for each subject was used for statistical calculations. Pearson correlation coefficients were measured between each pair of regions in each subject. Correlation coefficients were Fisher-transformed by evaluating the hyperbolic arctangent prior to group averaging to more closely approximate normally distributed data.
2.6. Gender comparisons
To mitigate the effects of many comparisons, the brain was subdivided into 9 lobar regions consisting of the AAL regions within the frontal lobes, bilateral cingulum, parietal lobes, occipital lobes, lateral temporal lobes, medial temporal lobes, basal ganglia and thalami, cerebellar hemispheres and vermis. Average regional homogeneity values for male and female subjects were compared in each of these 9 lobar regions using paired 2-tailed t-test, with Bonferroni correction for multiple comparisons. Lobes showing significant gender differences were further evaluated by examining each of the AAL regions within that lobe.
2.7. Age comparisons
To assess the effects of subject age on connectivity, correlation coefficients were measured between age and regional homogeneity connectivity measurements. Statistical p-values for correlation estimates were calculated by transforming correlation to a t-statistic having n − 2 degrees of freedom, where n is the number of subjects.
3. Results
3.1. Regional homogeneity (local connectivity)
The overall mean regional homogeneity was 0.27 ± 0.05. Regional homogeneity was found to be highest for gray matter, with areas of the precuneus/cuneus, occipital/calcarine, lingual, superior and inferior parietal, lingual, angular, medial frontal and anterior and posterior cingulate showing the highest local connectivity values. The mean regional homogeneity maps, averaged over all 58 subjects are shown for both medial and lateral brain regions in Fig. 1, Fig. 2, respectively.
Fig. 1.
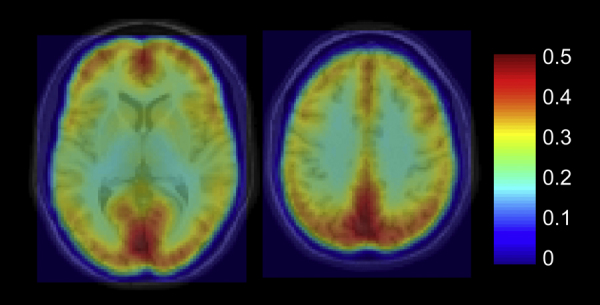
Axial slices of mean regional homogeneity map, averaged over 58 subjects.
Fig. 2.

Three-dimensional view of mean regional homogeneity, averaged over 58 subjects.
3.2. Age comparisons
Mean regional homogeneity for all 116 regions for each subject showed there was a reduction in regional homogeneity with age (r = −0.287, p = 0.029). Fig. 3 shows the mean correlation coefficient between regional homogeneity and age for each of 116 brain regions in the AAL atlas, with positive values indicating an increase in regional homogeneity with age and negative values indicating decrease in regional homogeneity with age. Males and females were not significantly different using a 2-tailed t-test (p = 0.50). Fig. 4 depicts the 116 regions studied, with 114 brain regions showing weaker local connectivity with increasing age. The reduction of regional homogeneity with age was most significant for the right anterior cingulate (r = −0.36, p = 0.005) and right inferior (r = −0.37, p = 0.005) and middle (r = −0.35, p = 0.007) temporal lobe.
Fig. 3.

Correlation coefficient between regional homogeneity (ReHo) and age, with positive values indicating increase in ReHo with age and negative values indicating decrease in ReHo with age. Slices show 5 mm increment in MNI z-coordinates from −25 to 65.
Fig. 4.

Correlation coefficient for the 116 brain regions between regional homogeneity (ReHo) and age.
3.3. Gender comparisons
Differences in regional homogeneity between genders were assessed in 9 lobar brain regions defined a priori. The only region found to be significantly different between genders was the medial temporal region (p = 0.0053), with females exhibiting higher local connectivity values (see Fig. 5a). This significant difference survives multiple comparison correction with Bonferroni technique. An examination of the AAL subregions in the medial temporal lobe indicated that our findings were driven by greater female local connectivity in the right hippocampus (p = 0.0006) and amygdala (p = 0.008), which also remained significant after Bonferroni correction (see Fig. 5b). In addition, greater female connectivity in the amygdala and hippocampus, especially on the right, is present across the age range of our sample (see Fig. 6).
Fig. 5.

Regional homogeneity in 9 lobar regions, showing gender differences in the medial temporal region.
Fig. 6.

Mean regional homogeneity, age, and gender for the right amygdala and right hippocampus.
4. Discussion
In a sample of healthy male and female subjects we found measures of regional homogeneity to be highest for gray matter and there was a general reduction in regional homogeneity with age throughout the gray matter, with the largest decreases seen in the cingulate and right temporal lobe. Regions with the highest regional homogeneity values included the precuneus/cuneus, occipital/calcarine, lingual, superior and inferior parietal, angular gyrus, medial frontal and anterior and posterior cingulate regions. The only region found to be significantly different between genders was the medial temporal lobe with females exhibiting higher local connectivity values specifically within the right hippocampus and amygdala. Although regional connectivity analyses have recently been applied to the study of neurological and psychiatric illness (Cao et al., 2006, Liu et al., 2008, Paakki et al., 2010, Wu et al., 2007, Yuan et al., 2008, Zhu et al., 2005), this is the first study to evaluate the normative developmental trajectory of local connectivity and its potential interaction with gender in specific brain regions.
Given that regional homogeneity measures the functional coherence of a specific voxel with its nearest neighbors, it has recently been interpreted as a measure of local connectivity (Zang et al., 2004). Consistent with prior characterization of regional homogeneity (Zang et al., 2004), our results indicate that local connectivity was highest for gray matter, particularly within regions of the default mode network. In a recent study, He et al. (2004) examined 8 healthy female volunteers on a 1.5 T scanner and found the highest regional homogeneity values for the precuneus/posterior cingluate cortex (PCC), inferior parietal cortex, angular gyrus, left superior frontal, right middle frontal, median prefrontal and the anterior cingulate, bilateral cerebellum hemispheres and vermis, right post-central and pre-central gyrus and bilateral parahippocampal gyrus. Wu et al. (2007) evaluated 28 adults on a 1.5 T scanner and also found increased regional homogeneity in DMN regions such as PCC, medial prefrontal cortex (PFC) and bilateral inferior parietal lobe. Lastly, in a study by Long et al. (2008), which included 40 adults who had imaging data acquired at 4 different centers and with different acquisition parameters and scanner strength (1.5–3 Tesla), the authors reported regions within the DMN as having high regional homogeneity and included precuneus/PCC, medial PFC, bilateral angular gyrus and bilateral inferior temporal cortex. These findings based on resting-state analyses appear consistent regarding high local connectivity within DMN brain regions. Additionally, regions associated with the task-positive network have also been found to have higher regional homogeneity, particularly in the supplementary motor area, bilateral dorsolateral PFC, bilateral insula, bilateral inferior parietal lobe and bilateral medial temporal cortex (Long et al., 2008). Other brain regions not associated with the DMN or task positive network with high regional homogeneity values were the lingual gyrus, fusiform and parahippocampal gyrus (Long et al., 2008). The current study findings mirrored some but not all of the results from these three prior studies in adults. This may be related to methodological differences in sample size (n = 58 in this study) and imaging acquisition (1.5 T versus 3 T), but was mostly likely due to participant differences (adults versus a combination of youths and adults with an age range of 11–35 years old). The precuneus/PCC and the medial prefrontal region are considered “hubs” of the default mode network, where large amounts of information are received and integrated relating to internal narrative or self-referential mental activity (Buckner et al., 2009, Gusnard et al., 2001, Mason et al., 2007, Raichle et al., 2001, Raichle and Snyder, 2007). Elevated local connectivity in these key DMN regions relative to other brain regions may suggest that these regions have high integrative capacities. Alternately, the increased regional homogeneity seen may reflect shared temporal variance from artifactual sources, such as vascular effects, given that higher cerebral blood flow is known to occur in these areas (Raichle et al., 2001).
As hypothesized, we found weaker local connectivity with increasing age for almost all brain regions from late childhood through early adulthood. Wu et al. also found decreased regional homogeneity throughout the brain in older subjects (mean age 64.7) compared to younger subjects (mean age = 27.3). Our findings are consistent with a general neurodevelopmental mechanism of overconnectivity followed by pruning or weakening of short-range connections during typical development, a process that has been termed segregation and integration (Fair et al., 2007, Fair et al., 2009). While our study evaluated connectivity at the local level of individual brain regions, parallel findings of integration and segregation have also been observed in studies of resting-state networks. These investigations report a shift in connectivity from short-range between brain region connections to long-range and globally distributed networks (Durston and Casey, 2006, Fair et al., 2007, Fair et al., 2008, Fair et al., 2009, Fransson et al., 2007, Kelly et al., 2009, Smyser et al., in press, Thomason et al., 2008). For example, it has been reported that default mode network regions are only sparsely connected in childhood, and appear to strengthen with age (Fair et al., 2008). In other networks, a similar pattern is seen where correlated local networks develop early, with distributed networks occurring in adolescence or early adulthood (Fair et al., 2009). Using independent component analysis to define networks, it has also been shown that distributed networks appear to have increasing efficiency and less mutual interdependence with age (Stevens et al., 2009). In the current study, reduction of regional homogeneity with age was most significant for the right anterior cingulate, and regions of the right temporal lobe. This is of note given that the cingulate in particular is an area that forms widespread projections throughout the brain during integration (Kelly et al., 2009). Bilateral temporal lobes were also found to have large age-related decreases in regional homogeneity in another study (Wu et al., 2007).
Differences in regional homogeneity between genders were found to be significant for the medial temporal lobes, with females exhibiting higher regional homogeneity values. This finding was driven by greater female local connectivity in the right hippocampus and right amygdala. Greater female connectivity in the medial temporal lobe, especially on the right, was seen across the age range of our sample and did not appear to be associated with a developmental change limited to adolescence. These findings are consistent with previous reports that point to both structural and task-based functional sex differences in medial temporal lobe structures and in recent functional connectivity studies. For example, females have been reported to have larger hippocampal volumes and smaller amygdala volumes (Caviness et al., 1996). Furthermore, differences between genders in amygdala activation patterns during tasks of emotional processing have consistently been reported (Cahill et al., 2004b, Derntl et al., 2010, Hofer et al., 2006, Kilgore and Yurgelun-Todd, 2001, McClure et al., 2004, McRae et al., 2008). In a recent fMRI study, investigators utilized three paradigms aimed at assessing emotion recognition, perspective taking, and affective responsiveness and found amygdala and hippocampal activiation differences between genders (Derntl et al., 2010). Other studies of emotional processing tasks also report differences in limbic activation patterns between genders (Hofer et al., 2006, McRae et al., 2008). Finally, in a recent fMRI study investigating gender differences in functional networks, it was reported that, while there were no significant differences in global or local efficiency between genders, differences were observed in increased nodal efficiency in men (relative to women) in several areas including the left and right hippocampus, right parahippocampal and left amygdala (Wang et al., 2008). While local resting state connectivity is not directly comparable to fMRI bold response, the gender differences observed using these two methods suggests a fundamental difference exists in limbic brain neurophysiology between genders.
Increased limbic activity at rest in females may suggest higher local synchronization of activity in this region for females compared to males. In our study this finding is lateralized to the right hemisphere. A number of studies seem to indicate a lateralization of activation of the amygdala between genders. (Cahill, 2003, Cahill et al., 2004a, Cahill et al., 2004b, Canli et al., 2002b, Kilpatrick et al., 2006). Although the exact mechanisms for this finding are unknown, it may be related to the impact of sex-specific hormones on limbic structures or from changes in gene expression during development (Berchtold et al., 2008). For example, a recent study in humans demonstrated a correlation between gray matter volume changes in the amygdala and hippocampus and levels of gonadal steroid hormones (Neufang et al., 2009). Furthermore, animal studies have speculated that estrogen levels can affect excitability of hippocampal cells (Cahill, 2006) by increasing dendritic spine density (Lee et al., 2004, Romeo et al., 2005). Overall, there is converging evidence that differences in limbic structure and function, both at rest and during tasks, exist between genders and that these differences may account for the disparities in incidence of psychiatric pathologies seen in males and females (Kilpatrick et al., 2006).
In contrast to our study, previous investigations have reported on structural and functional differences between genders in brain regions other than limbic regions. For example, overall brain size has been reported as significantly greater in men (Christova et al., 2008, Kaiser et al., 2009, Leonard et al., 2008, Luders et al., 2002), while cortical complexity has been reported to be greater in women, specifically in frontal and parietal regions (Gur et al., 1999, Luders et al., 2004, Luders et al., 2002), and cortical thickness has been found to be higher in women in right posterior temporal and right inferior parietal regions (Sowell et al., 2007). In a more recent study of cortical thickness in 184 normal subjects (90 males and 94 females) females were found to have increased cortical thickness in the frontal, parietal, and occipital lobes (Lv et al., 2010). This included the superior frontal gyrus, precentral gyrus, and postcentral gyrus bilaterally, as well as in the superior parietal lobule, cuneus, and frontal pole in the left hemisphere (Lv et al., 2010). Males were reported as having increased cortical thickness in a small region of the temporal pole relative to females (Lv et al., 2010). However, two other studies of cortical thickness reported no gender differences (Fjell et al., 2009, Im et al., 2008). Subcortical brain structures such as the basal ganglia have also been reported to be different between genders (Canli et al., 2002a, Caviness et al., 1996, Peterson et al., 2003). We did not find local connectivity differences in any other brain region outside the limbic regions between males and females, however this is likely related to the fact that regional homogeneity is a different measurement than volume or function.
Our results should be interpreted with caution given the relatively small sample size for probing age and gender interactions considering the wide age range of 11–35. In addition, the cross-sectional nature of this study limits our ability to capture variance in developmental trajectories. Furthermore, we used Kendall's coefficient of concordance (KCC) (Kendall and Gibbons, 1990) to calculate regional homogeneity values which may be more susceptible to random noise as compared to an alternative methods which uses coherence to determine regional homogeneity measures (Liu et al., 2010). It is possible that age and gender differences in brain volume could artificially inflate regional homogeneity measurements, since the voxels used to obtain Kendall's coefficient of concordance may be drawn from a relatively smaller gray matter volume. However, this is unlikely to explain our effects as the difference in overall brain size between adolescents and adults is minimal and our methods included brain normalization. Furthermore, the fact that smaller brain regions such as limbic and subcortical brain structures did not have the highest regional homogeneity values and the fact that females had higher regional homogeneity values only in limbic regions suggests that the size of the brain structure is not what is influencing the results. The current investigation used “keep your eyes open and remain awake and try to let thoughts pass through your mind without focusing on anything in particular” as the “task”. There are currently no behavioral or performance measures available to verify if adults and youths performed this “task” equally well (Church et al., 2010). Therefore, it is possible that developmental variation in how this “task” is performed may account for the differences noted in youths compared to adults. Furthermore, a positive significant correlation was seen between age and depression scores. Interestingly regional homogeneity was found to have the opposite relationship with age; therefore mood is not thought to represent a confound responsible for the regional homogeneity differences observed in the current study. Rather, this is likely reflective of the higher incidence of depressive symptoms in adults relative to children in the general population.
Finally, although regional homogeneity has been used as a metric for local connectivity, the relationship between neural microcircuitry at the range of a few millimeters and regional homogeneity remains uncharacterized. Shared input from adjacent brain regions or subcortical structures, regional and developmental variations in blood flow or hemodynamic response properties, and variations in cortical anatomy or thickness may contribute to spatial, age, and gender variation in regional homogeneity.
Despite these limitations, this report is based on one of the largest studies to evaluate the relationship between regional homogeneity and age and is one of the only studies to provided information regarding interaction with gender. The participants all underwent extensive psychiatric evaluations and were completely free of any past or present psychiatric disorder and all were naïve to psychotropic medications. Furthermore, all of the imaging data was collected at the same MRI imaging center within a one year period of time.
4.1. Conclusions
In summary, regional homogeneity was found to be highest for gray matter, particularly for areas within the default mode network. There was a general trend toward decreasing regional homogeneity with age with the greatest reduction in anterior cingulate, and temporal lobe regions. This decrease in regional temporal coherence may be related to the ongoing regressive maturational events such as synaptic pruning, which improves brain efficiency and eliminates redundancy. Further, greater female local connectivity in right limbic regions was found. These findings motivate further investigations of the development of local brain networks and stress the importance of examining gender differences in imaging studies in healthy and clinical populations. Future availability of large datasets and longitudinal studies of resting connectivity may allow increased specificity of regional, age, and gender interactions.
Acknowledgements
This work was supported by research grants from an NIH:1R01 DA020269-01 to DYT and training awards through the American Psychiatric Association's Program for Minority Research Training in Psychiatry (5T32 MH19126).
References
- Adler C.M., DelBello M.P., Mills N.P., Schmithorst V., Holland S., Strakowski S.M. Comorbid ADHD is associated with altered patterns of neuronal activation in adolescents with bipolar disorder performing a simple attention task. Bipolar Disord. 2005;7(6):577–588. doi: 10.1111/j.1399-5618.2005.00257.x. [DOI] [PubMed] [Google Scholar]
- Anderson, J.S., Druzgal, T.J., Lopez-Larson, M., Jeong, E.K., Desai, K., Yurgelun-Todd, D., in press. Network anticorrelations, global regression, and phase-shifted soft tissue correction (PSTCor). Hum Brain Mapp. In press, 2010, June 9. [DOI] [PMC free article] [PubMed]
- Berchtold N.C., Cribbs D.H., Coleman P.D., Rogers J., Head E., Kim R. Gene expression changes in the course of normal brain aging are sexually dimorphic. Proc. Natl. Acad. Sci. U.S.A. 2008;105(40):15605–15610. doi: 10.1073/pnas.0806883105. [DOI] [PMC free article] [PubMed] [Google Scholar]
- Birn R.M., Smith M.A., Jones T.B., Bandettini P.A. The respiration response function: the temporal dynamics of fMRI signal fluctuations related to changes in respiration. Neuroimage. 2008;40(2):644–654. doi: 10.1016/j.neuroimage.2007.11.059. [DOI] [PMC free article] [PubMed] [Google Scholar]
- Biswal B., Yetkin F.Z., Haughton V.M., Hyde J.S. Functional connectivity in the motor cortex of resting human brain using echo-planar MRI. Magn. Reson. Med. 1995;34(4):537–541. doi: 10.1002/mrm.1910340409. [DOI] [PubMed] [Google Scholar]
- Boghi A., Rasetti R., Avidano F., Manzone C., Orsi L., D’Agata F. The effect of gender on planning: An fMRI study using the Tower of London task. Neuroimage. 2006;33(3):999–1010. doi: 10.1016/j.neuroimage.2006.07.022. [DOI] [PubMed] [Google Scholar]
- Buckner R.L., Sepulcre J., Talukdar T., Krienen F.M., Liu H., Hedden T. Cortical hubs revealed by intrinsic functional connectivity: mapping, assessment of stability, and relation to Alzheimer's disease. J. Neurosci. 2009;29(6):1860–1873. doi: 10.1523/JNEUROSCI.5062-08.2009. [DOI] [PMC free article] [PubMed] [Google Scholar]
- Cahill L. Sex- and hemisphere-related influences on the neurobiology of emotionally influenced memory. Prog. Neuropsychopharmacol. Biol. Psychiatry. 2003;27(8):1235–1241. doi: 10.1016/j.pnpbp.2003.09.019. [DOI] [PubMed] [Google Scholar]
- Cahill L. Why sex matters for neuroscience. Nat. Rev. Neurosci. 2006;7(6):477–484. doi: 10.1038/nrn1909. [DOI] [PubMed] [Google Scholar]
- Cahill L., Gorski L., Belcher A., Huynh Q. The influence of sex versus sex-related traits on long-term memory for gist and detail from an emotional story. Conscious. Cogn. 2004;13(2):391–400. doi: 10.1016/j.concog.2003.11.003. [DOI] [PubMed] [Google Scholar]
- Cahill L., Uncapher M., Kilpatrick L., Alkire M.T., Turner J. Sex-related hemispheric lateralization of amygdala function in emotionally influenced memory: an FMRI investigation. Learn Mem. 2004;11(3):261–266. doi: 10.1101/lm.70504. [DOI] [PMC free article] [PubMed] [Google Scholar]
- Canli T., Desmond J.E., Zhao Z., Gabrieli J.D. Sex differences in the neural basis of emotional memories. Proc. Natl. Acad. Sci. U.S.A. 2002;99(16):10789–10794. doi: 10.1073/pnas.162356599. [DOI] [PMC free article] [PubMed] [Google Scholar]
- Canli T., Sivers H., Whitfield S.L., Gotlib I.H., Gabrieli J.D. Amygdala response to happy faces as a function of extraversion. Science. 2002;296(5576):2191. doi: 10.1126/science.1068749. [DOI] [PubMed] [Google Scholar]
- Cao Q., Zang Y., Sun L., Sui M., Long X., Zou Q. Abnormal neural activity in children with attention deficit hyperactivity disorder: a resting-state functional magnetic resonance imaging study. Neuroreport. 2006;17(10):1033–1036. doi: 10.1097/01.wnr.0000224769.92454.5d. [DOI] [PubMed] [Google Scholar]
- Caviness V.S., Jr., Kennedy D.N., Richelme C., Rademacher J., Filipek P.A. The human brain age 7–11 years: a volumetric analysis based on magnetic resonance images. Cereb. Cortex. 1996;6(5):726–736. doi: 10.1093/cercor/6.5.726. [DOI] [PubMed] [Google Scholar]
- Chang C., Cunningham J.P., Glover G.H. Influence of heart rate on the BOLD signal: the cardiac response function. Neuroimage. 2009;44(3):857–869. doi: 10.1016/j.neuroimage.2008.09.029. [DOI] [PMC free article] [PubMed] [Google Scholar]
- Christova P.S., Lewis S.M., Tagaris G.A., Ugurbil K., Georgopoulos A.P. A voxel-by-voxel parametric fMRI study of motor mental rotation: hemispheric specialization and gender differences in neural processing efficiency. Exp. Brain Res. 2008;189(1):79–90. doi: 10.1007/s00221-008-1405-x. [DOI] [PubMed] [Google Scholar]
- Church J.A., Petersen S.E., Schlaggar B.L. The “Task B problem” and other considerations in developmental functional neuroimaging. Hum. Brain Mapp. 2010;31(6):852–862. doi: 10.1002/hbm.21036. [DOI] [PMC free article] [PubMed] [Google Scholar]
- Cox R.W. AFNI: software for analysis and visualization of functional magnetic resonance neuroimages. Comput. Biomed. Res. 1996;29(3):162–173. doi: 10.1006/cbmr.1996.0014. [DOI] [PubMed] [Google Scholar]
- Damoiseaux J.S., Rombouts S.A., Barkhof F., Scheltens P., Stam C.J., Smith S.M. Consistent resting-state networks across healthy subjects. Proc. Natl. Acad. Sci. U.S.A. 2006;103(37):13848–13853. doi: 10.1073/pnas.0601417103. [DOI] [PMC free article] [PubMed] [Google Scholar]
- Davidson M.C., Thomas K.M., Casey B.J. Imaging the developing brain with fMRI. Ment. Retard. Dev. Disabil. Res. Rev. 2003;9(3):161–167. doi: 10.1002/mrdd.10076. [DOI] [PubMed] [Google Scholar]
- De Luca M., Beckmann C.F., De Stefano N., Matthews P.M., Smith S.M. fMRI resting state networks define distinct modes of long-distance interactions in the human brain. Neuroimage. 2006;29(4):1359–1367. doi: 10.1016/j.neuroimage.2005.08.035. [DOI] [PubMed] [Google Scholar]
- Derntl B., Finkelmeyer A., Eickhoff S., Kellermann T., Falkenberg D.I., Schneider F. Multidimensional assessment of empathic abilities: neural correlates and gender differences. Psychoneuroendocrinology. 2010;35(1):67–82. doi: 10.1016/j.psyneuen.2009.10.006. [DOI] [PubMed] [Google Scholar]
- Dosenbach N.U., Nardos B., Cohen A.L., Fair D.A., Power J.D., Church J.A. Prediction of individual brain maturity using fMRI. Science. 2010;329(5997):1358–1361. doi: 10.1126/science.1194144. [DOI] [PMC free article] [PubMed] [Google Scholar]
- Durston S., Casey B.J. What have we learned about cognitive development from neuroimaging? Neuropsychologia. 2006;44(11):2149–2157. doi: 10.1016/j.neuropsychologia.2005.10.010. [DOI] [PubMed] [Google Scholar]
- Fair D.A., Cohen A.L., Dosenbach N.U., Church J.A., Miezin F.M., Barch D.M. The maturing architecture of the brain's default network. Proc. Natl. Acad. Sci. U.S.A. 2008;105(10):4028–4032. doi: 10.1073/pnas.0800376105. [DOI] [PMC free article] [PubMed] [Google Scholar]
- Fair D.A., Cohen A.L., Power J.D., Dosenbach N.U., Church J.A., Miezin F.M. Functional brain networks develop from a “local to distributed” organization. PLoS Comput. Biol. 2009;5(5):e1000381. doi: 10.1371/journal.pcbi.1000381. [DOI] [PMC free article] [PubMed] [Google Scholar]
- Fair D.A., Dosenbach N.U., Church J.A., Cohen A.L., Brahmbhatt S., Miezin F.M. Development of distinct control networks through segregation and integration. Proc. Natl. Acad. Sci. U.S.A. 2007;104(33):13507–13512. [Google Scholar]
- First M.B., Spitzer R.L., Gibbon M., Williams J.B. American Psychiatric Press; Washington, DC: 1996. Structured clinical interview for DSM-IV axis I disorders, clinician version (SCID-CV) [Google Scholar]
- Fjell A.M., Westlye L.T., Amlien I., Espeseth T., Reinvang I., Raz N. Minute effects of sex on the aging brain: a multisample magnetic resonance imaging study of healthy aging and Alzheimer's disease. J. Neurosci. 2009;29(27):8774–8783. doi: 10.1523/JNEUROSCI.0115-09.2009. [DOI] [PMC free article] [PubMed] [Google Scholar]
- Fornari E., Knyazeva M.G., Meuli R., Maeder P. Myelination shapes functional activity in the developing brain. Neuroimage. 2007;38(3):511–518. doi: 10.1016/j.neuroimage.2007.07.010. [DOI] [PubMed] [Google Scholar]
- Fox M.D., Raichle M.E. Spontaneous fluctuations in brain activity observed with functional magnetic resonance imaging. Nat. Rev. Neurosci. 2007;8(9):700–711. doi: 10.1038/nrn2201. [DOI] [PubMed] [Google Scholar]
- Fransson P. How default is the default mode of brain function?: further evidence from intrinsic BOLD signal fluctuations. Neuropsychologia. 2006;44(14):2836–2845. doi: 10.1016/j.neuropsychologia.2006.06.017. [DOI] [PubMed] [Google Scholar]
- Fransson P., Skiold B., Horsch S., Nordell A., Blennow M., Lagercrantz H. Resting-state networks in the infant brain. Proc. Natl. Acad. Sci. U.S.A. 2007;104(39):15531–15536. doi: 10.1073/pnas.0704380104. [DOI] [PMC free article] [PubMed] [Google Scholar]
- Giedd J.N., Snell J.W., Lange N., Rajapakse J.C., Casey B.J., Kozuch P.L. Quantitative magnetic resonance imaging of human brain development: ages 4–18. Cereb. Cortex. 1996;6(4):551–560. doi: 10.1093/cercor/6.4.551. [DOI] [PubMed] [Google Scholar]
- Glover G.H., Li T.Q., Ress D. Image-based method for retrospective correction of physiological motion effects in fMRI: RETROICOR. Magn. Reson. Med.: Off. J. Soc. Magn. Reson. Med./Soc. Magn. Reson. Med. 2000;44(1):162–167. doi: 10.1002/1522-2594(200007)44:1<162::aid-mrm23>3.0.co;2-e. [DOI] [PubMed] [Google Scholar]
- Greicius M.D., Krasnow B., Reiss A.L., Menon V. Functional connectivity in the resting brain: a network analysis of the default mode hypothesis. Proc. Natl. Acad. Sci. U.S.A. 2003;100(1):253–258. doi: 10.1073/pnas.0135058100. [DOI] [PMC free article] [PubMed] [Google Scholar]
- Gur R.C., Turetsky B.I., Matsui M., Yan M., Bilker W., Hughett P. Sex differences in brain gray and white matter in healthy young adults: correlations with cognitive performance. J. Neurosci. 1999;19(10):4065–4072. doi: 10.1523/JNEUROSCI.19-10-04065.1999. [DOI] [PMC free article] [PubMed] [Google Scholar]
- Gusnard D.A., Akbudak E., Shulman G.L., Raichle M.E. Medial prefrontal cortex and self-referential mental activity: relation to a default mode of brain function. Proc. Natl. Acad. Sci. U.S.A. 2001;98(7):4259–4264. doi: 10.1073/pnas.071043098. [DOI] [PMC free article] [PubMed] [Google Scholar]
- Hamilton M. A rating scale for depression. J. Neurol. Neurosurg. Psychiatry. 1960;23:56–62. doi: 10.1136/jnnp.23.1.56. [DOI] [PMC free article] [PubMed] [Google Scholar]
- Hamilton M. Headly Brothers; Ashford, Kent: 1969. Diagnosis and Rating of Anxiety. [Google Scholar]
- He Y., Wang L., Zang Y., Tian L., Zhang X., Li K. Regional coherence changes in the early stages of Alzheimer's disease: a combined structural and resting-state functional MRI study. Neuroimage. 2007;35(2):488–500. doi: 10.1016/j.neuroimage.2006.11.042. [DOI] [PubMed] [Google Scholar]
- He Y., Zang Y.F., Jiang T.Z., Lu Y.L., Weng X.C. Paper Presented at the Biomedical Imaging: Nano to Macro, 2004. IEEE International Symposium on. 2004. Detection of functional networks in the resting brain. [Google Scholar]
- Henderson L.A., Gandevia S.C., Macefield V.G. Gender differences in brain activity evoked by muscle and cutaneous pain: a retrospective study of single-trial fMRI data. Neuroimage. 2008;39(4):1867–1876. doi: 10.1016/j.neuroimage.2007.10.045. [DOI] [PubMed] [Google Scholar]
- Hofer A., Siedentopf C.M., Ischebeck A., Rettenbacher M.A., Verius M., Felber S. Gender differences in regional cerebral activity during the perception of emotion: a functional MRI study. Neuroimage. 2006;32(2):854–862. doi: 10.1016/j.neuroimage.2006.03.053. [DOI] [PubMed] [Google Scholar]
- Im K., Lee J.M., Lyttelton O., Kim S.H., Evans A.C., Kim S.I. Brain size and cortical structure in the adult human brain. Cereb. Cortex. 2008;18(9):2181–2191. doi: 10.1093/cercor/bhm244. [DOI] [PubMed] [Google Scholar]
- Kaiser A., Haller S., Schmitz S., Nitsch C. On sex/gender related similarities and differences in fMRI language research. Brain Res. Rev. 2009;61(2):49–59. doi: 10.1016/j.brainresrev.2009.03.005. [DOI] [PubMed] [Google Scholar]
- Keller K., Menon V. Gender differences in the functional and structural neuroanatomy of mathematical cognition. Neuroimage. 2009;47(1):342–352. doi: 10.1016/j.neuroimage.2009.04.042. [DOI] [PMC free article] [PubMed] [Google Scholar]
- Kelly A.M., Di Martino A., Uddin L.Q., Shehzad Z., Gee D.G., Reiss P.T. Development of anterior cingulate functional connectivity from late childhood to early adulthood. Cereb. Cortex. 2009;19(3):640–657. doi: 10.1093/cercor/bhn117. [DOI] [PubMed] [Google Scholar]
- Kendall M., Gibbons J. 1990. Rank Correlation Methods: A Charles Griffin Title. [Google Scholar]
- Kilgore W.D., Yurgelun-Todd D. Sex differences in amygdala activation during the perception of facial affect. Neuroreport. 2001;12(11):2543–2547. doi: 10.1097/00001756-200108080-00050. [DOI] [PubMed] [Google Scholar]
- Kilpatrick L.A., Zald D.H., Pardo J.V., Cahill L.F. Sex-related differences in amygdala functional connectivity during resting conditions. Neuroimage. 2006;30(2):452–461. doi: 10.1016/j.neuroimage.2005.09.065. [DOI] [PubMed] [Google Scholar]
- Lee T.M., Hummer D.L., Jechura T.J., Mahoney M.M. Pubertal development of sex differences in circadian function: an animal model. Ann. N.Y. Acad. Sci. 2004;1021:262–275. doi: 10.1196/annals.1308.031. [DOI] [PubMed] [Google Scholar]
- Leonard C.M., Towler S., Welcome S., Halderman L.K., Otto R., Eckert M.A. Size matters: cerebral volume influences sex differences in neuroanatomy. Cereb. Cortex. 2008;18(12):2920–2931. doi: 10.1093/cercor/bhn052. [DOI] [PMC free article] [PubMed] [Google Scholar]
- Liu D., Yan C., Ren J., Yao L., Kiviniemi V.J., Zang Y. Using coherence to measure regional homogeneity of resting-state FMRI signal. Front Syst. Neurosci. 2010;4:24. doi: 10.3389/fnsys.2010.00024. [DOI] [PMC free article] [PubMed] [Google Scholar]
- Liu Y., Wang K., Yu C., He Y., Zhou Y., Liang M. Regional homogeneity, functional connectivity and imaging markers of Alzheimer's disease: a review of resting-state fMRI studies. Neuropsychologia. 2008;46(6):1648–1656. doi: 10.1016/j.neuropsychologia.2008.01.027. [DOI] [PubMed] [Google Scholar]
- Long X.-Y., Zuo X.-N., Kiviniemi V., Yang Y., Zou Q.-H., Zhu C.-Z. Default mode network as revealed with multiple methods for resting-state functional MRI analysis. J. Neurosci. Methods. 2008;171(2):349–355. doi: 10.1016/j.jneumeth.2008.03.021. [DOI] [PubMed] [Google Scholar]
- Luders E., Narr K.L., Thompson P.M., Rex D.E., Jancke L., Steinmetz H. Gender differences in cortical complexity. Nat. Neurosci. 2004;7(8):799–800. doi: 10.1038/nn1277. [DOI] [PubMed] [Google Scholar]
- Luders E., Steinmetz H., Jancke L. Brain size and grey matter volume in the healthy human brain. Neuroreport. 2002;13(17):2371–2374. doi: 10.1097/01.wnr.0000049603.85580.da. [DOI] [PubMed] [Google Scholar]
- Lv B., Li J., He H., Li M., Zhao M., Ai L. Gender consistency and difference in healthy adults revealed by cortical thickness. Neuroimage. 2010 doi: 10.1016/j.neuroimage.2010.05.020. [DOI] [PubMed] [Google Scholar]
- Maldjian J.A., Laurienti P.J., Kraft R.A., Burdette J.H. An automated method for neuroanatomic and cytoarchitectonic atlas-based interrogation of fMRI data sets. Neuroimage. 2003;19(3):1233–1239. doi: 10.1016/s1053-8119(03)00169-1. [DOI] [PubMed] [Google Scholar]
- Marsh R., Gerber A.J., Peterson B.S. Neuroimaging studies of normal brain development and their relevance for understanding childhood neuropsychiatric disorders. J. Am. Acad. Child Adolesc. Psychiatry. 2008;47(11):1233–1251. doi: 10.1097/CHI.0b013e318185e703. [DOI] [PMC free article] [PubMed] [Google Scholar]
- Mason M.F., Norton M.I., Van Horn J.D., Wegner D.M., Grafton S.T., Macrae C.N. Wandering minds: the default network and stimulus-independent thought. Science. 2007;315(5810):393–395. doi: 10.1126/science.1131295. [DOI] [PMC free article] [PubMed] [Google Scholar]
- McClure E.B., Monk C.S., Nelson E.E., Zarahn E., Leibenluft E., Bilder R.M. A developmental examination of gender differences in brain engagement during evaluation of threat. Biol. Psychiatry. 2004;55(11):1047–1055. doi: 10.1016/j.biopsych.2004.02.013. [DOI] [PubMed] [Google Scholar]
- McRae K., Ochsner K.N., Mauss I.B., Gabrieli J.J.D., Gross J.J. Gender differences in emotion regulation: an fMRI study of cognitive reappraisal. Group Proc. Intergroup Relat. 2008;11(2):143–162. doi: 10.1177/1368430207088035. [DOI] [PMC free article] [PubMed] [Google Scholar]
- Neufang S., Specht K., Hausmann M., Gunturkun O., Herpertz-Dahlmann B., Fink G.R. Sex differences and the impact of steroid hormones on the developing human brain. Cereb. Cortex. 2009;19(2):464–473. doi: 10.1093/cercor/bhn100. [DOI] [PubMed] [Google Scholar]
- Paakki J.J., Rahko J., Long X., Moilanen I., Tervonen O., Nikkinen J. Alterations in regional homogeneity of resting-state brain activity in autism spectrum disorders. Brain Res. 2010;1321:169–179. doi: 10.1016/j.brainres.2009.12.081. [DOI] [PubMed] [Google Scholar]
- Peterson B.S., Thomas P., Kane M.J., Scahill L., Zhang H., Bronen R. Basal ganglia volumes in patients with Gilles de la Tourette syndrome. Arch. Gen. Psychiatry. 2003;60(4):415–424. doi: 10.1001/archpsyc.60.4.415. [DOI] [PubMed] [Google Scholar]
- Pruessner J.C., Collins D.L., Pruessner M., Evans A.C. Age and gender predict volume decline in the anterior and posterior hippocampus in early adulthood. J. Neurosci. 2001;21(1):194–200. doi: 10.1523/JNEUROSCI.21-01-00194.2001. [DOI] [PMC free article] [PubMed] [Google Scholar]
- Raichle M.E., MacLeod A.M., Snyder A.Z., Powers W.J., Gusnard D.A., Shulman G.L. A default mode of brain function. Proc. Natl. Acad. Sci. U.S.A. 2001;98(2):676–682. doi: 10.1073/pnas.98.2.676. [DOI] [PMC free article] [PubMed] [Google Scholar]
- Raichle M.E., Snyder A.Z. A default mode of brain function: a brief history of an evolving idea. Neuroimage. 2007;37(4):1083–1090. doi: 10.1016/j.neuroimage.2007.02.041. discussion 1097–1089. [DOI] [PubMed] [Google Scholar]
- Romeo R.D., McCarthy J.B., Wang A., Milner T.A., McEwen B.S. Sex differences in hippocampal estradiol-induced N-methyl-d-aspartic acid binding and ultrastructural localization of estrogen receptor-alpha. Neuroendocrinology. 2005;81(6):391–399. doi: 10.1159/000089557. [DOI] [PubMed] [Google Scholar]
- Schlaepfer T.E., Harris G.J., Tien A.Y., Peng L., Lee S., Pearlson G.D. Structural differences in the cerebral cortex of healthy female and male subjects: a magnetic resonance imaging study. Psychiatry Res. 1995;61(3):129–135. doi: 10.1016/0925-4927(95)02634-a. [DOI] [PubMed] [Google Scholar]
- Schulte-Ruther M., Markowitsch H.J., Shah N.J., Fink G.R., Piefke M. Gender differences in brain networks supporting empathy. Neuroimage. 2008;42(1):393–403. doi: 10.1016/j.neuroimage.2008.04.180. [DOI] [PubMed] [Google Scholar]
- Shirao N., Okamoto Y., Mantani T., Yamawaki S. Gender differences in brain activity generated by unpleasant word stimuli concerning body image: an fMRI study. Br. J. Psychiatry. 2005;186:48–53. doi: 10.1192/bjp.186.1.48. [DOI] [PubMed] [Google Scholar]
- Smyser, C.D., Inder, T.E., Shimony, J.S., Hill, J.E., Degnan, A.J., Snyder, A.Z., et al. Longitudinal analysis of neural network development in preterm infants. Cereb. Cortex. In Press, 2010. Mar 17. [DOI] [PMC free article] [PubMed]
- Sowell E.R., Peterson B.S., Kan E., Woods R.P., Yoshii J., Bansal R. Sex differences in cortical thickness mapped in 176 healthy individuals between 7 and 87 years of age. Cereb. Cortex. 2007;17(7):1550–1560. doi: 10.1093/cercor/bhl066. [DOI] [PMC free article] [PubMed] [Google Scholar]
- Stevens M.C., Pearlson G.D., Calhoun V.D. Changes in the interaction of resting-state neural networks from adolescence to adulthood. Hum. Brain Mapp. 2009;30(8):2356–2366. doi: 10.1002/hbm.20673. [DOI] [PMC free article] [PubMed] [Google Scholar]
- Supekar K., Musen M., Menon V. Development of large-scale functional brain networks in children. PLoS Biol. 2009;7(7):e1000157. doi: 10.1371/journal.pbio.1000157. [DOI] [PMC free article] [PubMed] [Google Scholar]
- Thomason M.E., Chang C.E., Glover G.H., Gabrieli J.D., Greicius M.D., Gotlib I.H. Default-mode function and task-induced deactivation have overlapping brain substrates in children. Neuroimage. 2008;41(4):1493–1503. doi: 10.1016/j.neuroimage.2008.03.029. [DOI] [PMC free article] [PubMed] [Google Scholar]
- Tzourio-Mazoyer N., Landeau B., Papathanassiou D., Crivello F., Etard O., Delcroix N. Automated anatomical labeling of activations in SPM using a macroscopic anatomical parcellation of the MNI MRI single-subject brain. Neuroimage. 2002;15(1):273. doi: 10.1006/nimg.2001.0978. [DOI] [PubMed] [Google Scholar]
- Uddin L.Q., Supekar K., Menon V. Typical and atypical development of functional human brain networks: insights from resting-state FMRI. Front Syst. Neurosci. 2010;4:21. doi: 10.3389/fnsys.2010.00021. [DOI] [PMC free article] [PubMed] [Google Scholar]
- Varela F., Lachaux J.P., Rodriguez E., Martinerie J. The brainweb: phase synchronization and large-scale integration. Nat. Rev. Neurosci. 2001;2(4):229–239. doi: 10.1038/35067550. [DOI] [PubMed] [Google Scholar]
- Wang L., Zhu C., He Y., Zhong Q., Zang Y. Gender Effect on Functional Networks in Resting Brain Medical Imaging and Informatics: 2nd International Conference; MIMI 2007, Beijing, China, August 14-16, 2007 ; Springer-Verlag; 2008. pp. 160–168. Revised selected papers. [Google Scholar]
- Wu T., Zang Y., Wang L., Long X., Li K., Chan P. Normal aging decreases regional homogeneity of the motor areas in the resting state. Neurosci. Lett. 2007;423(3):189–193. doi: 10.1016/j.neulet.2007.06.057. [DOI] [PubMed] [Google Scholar]
- Yuan Y., Zhang Z., Bai F., Yu H., Shi Y., Qian Y. Abnormal neural activity in the patients with remitted geriatric depression: a resting-state functional magnetic resonance imaging study. J. Affect. Disord. 2008;111(2–3):145–152. doi: 10.1016/j.jad.2008.02.016. [DOI] [PubMed] [Google Scholar]
- Yurgelun-Todd D. Emotional and cognitive changes during adolescence. Curr. Opin. Neurobiol. 2007;17(2):251–257. doi: 10.1016/j.conb.2007.03.009. [DOI] [PubMed] [Google Scholar]
- Yurgelun-Todd D.A., Killgore W.D. Fear-related activity in the prefrontal cortex increases with age during adolescence: a preliminary fMRI study. Neurosci. Lett. 2006;406(3):194–199. doi: 10.1016/j.neulet.2006.07.046. [DOI] [PubMed] [Google Scholar]
- Zang Y., Jiang T., Lu Y., He Y., Tian L. Regional homogeneity approach to fMRI data analysis. Neuroimage. 2004;22(1):394–400. doi: 10.1016/j.neuroimage.2003.12.030. [DOI] [PubMed] [Google Scholar]
- Zang Y.-F., Yong H., Chao-Zhe Z., Qing-Jiu C., Man-Qiu S., Meng L. Altered baseline brain activity in children with ADHD revealed by resting-state functional MRI. Brain Dev. 2007;29(2):83–91. doi: 10.1016/j.braindev.2006.07.002. [DOI] [PubMed] [Google Scholar]
- Zhu C.Z., Zang Y.F., Liang M., Tian L.X., He Y., Li X.B. Discriminative analysis of brain function at resting-state for attention-deficit/hyperactivity disorder. Med. Image Comput. Comput. Assist. Interv. Int. Conf. Med. Image Comput. Comput. Assist. Interv. 2005;8(Pt 2):468–475. doi: 10.1007/11566489_58. [DOI] [PubMed] [Google Scholar]