

Abstract
This article represents the proceedings of a symposium at the 2004 International Society for Biomedical Research on Alcoholism in Mannheim, Germany, organized and co-chaired by Susan E. Bergeson and Wolfgang Sommer. The presentations and presenter were (1) Gene Expression in Brains of Alcohol-Preferring and Non-Preferring Rats, by Howard J. Edenberg (2) Candidate Treatment Targets for Alcoholism: Leads from Functional Genomics Approaches, by Wolfgang Sommer (3) Microarray Analysis of Acute and Chronic Alcohol Response in Brain, by Susan E. Bergeson (4) On the Integration of QTL and Gene Expression Analysis, by Robert J. Hitzemann (5) Microarray and Proteomic Analysis of the Human Alcoholic Brain, by Peter R. Dodd.
It has been known for nearly a half century that alcoholism is a complex, genetically-influenced disease of the brain. Yet, despite numerous studies in humans and animal models of alcoholism the global molecular mechanisms underlying alcoholism remain poorly understood. In fact it was only relatively recently shown that alcohol can, and does, specifically bind to proteins in a ligand/receptor-like fashion (Trudell and Harris, 2004). With this understanding, it became clear that genetic differences within a protein structure and at the expression level could have profound effects on individual responses to alcohol. The cloning of the complete genomes of humans and important model organisms coupled with technological advances in RNA and protein profiling now allow comprehensive study of basal genetic differences in gene and protein expression as well as their responses to alcohol exposure.
Post mortem analyses of brains from alcoholics clearly show a diminution in size of the prefrontal cortex allowing general conclusions to be made about regional specific effects of alcohol exposure (Kril and Halliday, 1999). Profiling studies are now confirming that finding at the molecular level and extending the studies to include testing specific hypotheses related to individual alcohol-related responses and endophenotypes as well. Initial evidence from expression profiling indicates that regional differences in brain gene expression exist under several conditions and in different genetic models of alcoholism.
The goal of this symposium was to present general results of expression studies in human alcoholics and the commonly used animal models of P/NP and AA/ANA selectively bred rat lines and the C57BL6J/DBA2J mouse strains. The use of expression detection methodologies extended from global profiling to specific use in determining the Quantitative Trait Genes (QTGs) that reside in Quantitative Trait Loci (QTL).
GENE EXPRESSION IN BRAINS OF ALCOHOL-PREFERRING AND NON-PREFERRING RATS
Howard J. Edenberg
Rats selectively bred for high (P) and low (NP) alcohol preference in a two-bottle, free-choice paradigm are a widely-used animal model for alcoholism. Our hypotheses are that there are both innate differences between the preferring and nonpreferring rats in gene expression in key brain regions and also differences in how expression is modulated by patterns of ethanol consumption. To examine these hypotheses, we have begun an extensive series of experiments using microarrays to analyze gene expression in these rats under different conditions. Brain is a highly complex organ with regional differences, mixtures of cell types, and even similar cells expressing different genes. To decrease the heterogeneity, we have analyzed 5 key regions of the rat brain separately. The brain is also relatively buffered against environmental changes. This means that even when focusing on a single region, differences between strains and conditions are usually subtle, so we have analyzed 6 individual animals in each comparison group to improve power to detect differences.
Our initial experiments focused upon 90–100 day old, alcohol-naive male rats from two different inbred lines of P (iP) and of NP (iNP) rats (Edenberg et al., 2005). We reduce the noise by eliminating from analysis probes that are not reliably detected (McClintick et al., 2003), and look for statistically significant differences between the strains using t-tests. In hippocampus, 129 genes differed at p ≤ 0.01, 58 of which differed at p ≤ 0.001 (where only 4 would be expected by chance). Interestingly, there was a bias: approximately 1/3 of these, particularly those involved in cell growth, stress reduction metabolism and synaptic function, were expressed at higher levels in the inbred P rats, whereas 2/3, including many involved in signaling, protein trafficking, cell death and neurotransmission, were expressed at lower levels (Edenberg et al., 2005). Changes were generally subtle, with fewer than 10% exceeding 2-fold. Extending these studies to the anterior cortex, striatum, nucleus accumbens and amygdala, we found that the differences between brain regions were greater than the differences between iP and iNP rats. There were similar numbers of differences between iP and iNP in the various brain regions, but fewer detected in cortex. Looking for overall differences between iP and iNP by jointly analyzing all 5 brain regions gave us more power to detect differences between the strains; approximately 240 genes differed at p ≤ 0.001; again, the magnitude of differences was usually small. Similar groups of genes differed.
We are extending these studies to the effects of chronic drinking and of intracranial self-administration of ethanol. Initial results suggest that these different paradigms of ethanol exposure result in fewer changes in gene expression than the innate strain differences noted above. Our aim is to build a dataset that will allow meta-analysis of the innate and ethanol-responsive differences in gene expression, to reveal critical genetic and environmental differences that affect ethanol consumption and the effects of ethanol on gene expression in brain.
CANDIDATE TREATMENT TARGETS FOR ALCOHOLISM: LEADS FROM FUNCTIONAL GENOMICS APPROACHES
Wolfgang Sommer
Substance dependence is a complex disorder with environmental and genetic components. It has a strong, but polygenetic heritability. Segregation analysis does not suggest a major gene operative in substance disorders. Thus, the contribution of any single gene to genetic vulnerability is likely to be small and may therefore be difficult to detect in population genetic studies. Genetic factors contribute through two main categories of mechanisms: polymorphic variants encode functionally altered proteins or transcriptional activity. Secondly, long term changes during the process of developing dependence lead to persistent changes in gene expression. Thus, genetic and environmental factors interact at the level of the transcriptome, making this an attractive level of analysis.
Animal models have demonstrated their utility for the development of clinically effective pharmacological treatments in alcoholism, but presently available compounds have been developed based on a priori knowledge of the role of opioid, amino acid and serotonergic transmission, respectively. This strategy has limitations when it comes to discovery of novel target systems. To identify novel treatment targets we have applied Affymetrix oligonucleotide microarray expression analysis to animal-models of genetic susceptibility and alcohol-induced neuroadaptation. We attempt to find genes which are differentially expressed in regions controlling alcohol related behaviors (i.e., medial prefrontal cortex, nuc. accumbens, amygdala and hippocampus).
First, an established model of genetic susceptibility to alcoholism was studied, the alcohol-preferring AA rats. Earlier work had prompted the question whether their alcohol-avoiding counterpart ANA line or nonselected Wistar rats should be used for comparison (Sommer et al., 2001). Thus, we generated expression profiles from all three lines. A first step to validate the microarray approach was the demonstration that individual expression profiles cluster according to the brain regions, and that region specific gene expression patterns could be extracted, e.g., dopamine receptors D1 and D2, adenosine A2a receptors, and substance P and preproenkephalin show highly enriched expression in the nuc. accumbens (Arlinde et al., 2004). By using the expression profile as phenotypes, also the issue of genetic distances between the lines was addressed. The clearest separation between the lines was obtained within the cingulate cortex. However, we found that, despite their divergence of alcohol preference, AA and ANA are clearly closer to each other in their overall expression profiles than either of them is to the nonselected Wistar line. This presumably reflects the fact that they were originally selected from a common parental strain, which was different from the Wistar line.
We finally evaluated differences in regional gene expression between the genetically related AA and ANA lines (Arlinde et al., 2004). The nuc. accumbens appeared to be the most divergent region. Using t-tests about fifty genes were identified, which are differentially expressed between the AA and ANA lines. Among the 1200 genes on the microarray we found 13 genes involved in signal transduction with differential expression between the lines. A cluster of six mitogen-activated protein kinases (MAPK) was upregulated in the Nc. accumbens of AA rats. Elevated hippocampal neuropeptide Y (NPY) in ANA rats was found in agreement with previous studies.
To identify candidate genes related to neuroadaptive processes underlying dependence, we have established a model based on prolonged exposure of the brain to repeated cycles of intoxication and withdrawal using inhalation of EtOH vapor (Rimondini et al., 2002). This leads to a marked and long-lasting increase in voluntary ethanol intake. Exposure-induced intake is antagonized by acamprosate, a damper of glutamatergic activity and clinically effective in human alcoholism. Interestingly, a critical temporal threshold has been found for induction of this model phenotype between 4 and 7 weeks of FIE exposure, suggesting that the induction of long-lasting phenotypic changes is not a linear, progressive process (Rimondini et al., 2003). Initial expression analysis revealed a set of long-term up-regulated transcripts in this model (Rimondini et al., 2002). These include members of pathways previously implicated in alcohol dependence (glutamatergic, endocannabinoid and monoaminergic neurotransmission), as well as pathways not previously known to be involved in this disorder (e.g., members of the mitogen-activated protein kinase pathway).
It can be hypothesized that a greater genetic vulnerability may lead to faster development or increased severity of the disorder. Hence, we asked whether genetically ethanol-preferring animals would further increase their drug consumption after repeated intoxication with ethanol, and what genes mediate these interactions of genetic and environmental factors. However, we only found a transient, small increase in voluntary ethanol consumption in AA rats exposed to repeated cycles of ethanol intoxication and withdrawal. In concordance with the behavioral data we found no specific strain-treatments interaction in the expression profiles. We conclude that the genetically selected AA and ANA lines have a low reaction norm for ethanol drinking and may therefore be less suitable to study long-term neuroadaptive processes underlying the transition into dependence (Sommer et al., 2005).
In conclusion, our and other expression profiling studies implicate that multiple systems are involved in the transition from a nondependent into the dependent state. As expression data accumulate from different animal models, mining the expression database for patterns of overlap will offer an increasingly powerful second level of analysis, identification of potential treatment targets, and understanding interactions between susceptibility and neuroadaptive mechanisms. Several of the gene products implicated by the expression studies either can be targeted using already available molecules, or are “drugable.” This provides a hope for novel treatment principles reaching the clinic in a not too distant future.
MICROARRAY ANALYSIS OF ACUTE AND CHRONIC ALCOHOL RESPONSE IN BRAIN
Susan E. Bergeson, Kerrie H. Lodowski and Ari E. Berman
To better understand how alcohol intoxication directly affects the brain and leads to dependence, global microarray analysis was undertaken to identify significant changes in gene expression in several brain regions in C57BL/6J and DBA/2J mice in response to acute and chronic alcohol treatment over a time course. Two separate experiments were discussed: In the first study completed to analyze expression changes due to chronic alcohol treatment, DBA/2J mice underwent a 72 hr alcohol inhalation exposure, or air for controls, followed by withdrawal, essentially as classically completed (Terdal and Crabbe, 1994). The only exception was that animals were not pretreated with the alcohol dehydrogenase inhibitor, pyrazole, as to avoid additional, nonalcohol related changes to gene expression. Mice exposed to alcohol vapor were sacrificed at zero, six and 24 hrs post alcohol ventilation, while control animals (72 hr in chamber with air only) were sacrificed at zero hr post air ventilation. Brains were dissected into the following discrete regions: cerebellum, cortex, hippocampus, midbrain, olfactory bulb, striatum, and total RNA was extracted from each region.
The focus of the second study was to identify genetically determined and sex specific brain alcohol-related gene expression changes due to acute alcohol exposure and subsequent withdrawal. Therefore the well characterized, inversely responsive C57BL/6J and DBA/2J inbred strains of mice were used and each mouse was treated with 4 g/kg IP ethanol following a three day habituation to IP injection of saline. Following cervical dislocation at 6 hr post injection, just prior to the peak of handling-induced withdrawal signs, the brain was removed intact and immediately frozen without further dissection. Total RNA was extracted and used for hybridization.
Custom printed cDNA microarrays containing either 17,665 (chronic study) or 38,246 (acute study) mouse gene targets were used. Experimental brain samples (n = 5/group) were hybridized against a standard reference RNA (a large isolation of B6 brain mRNA) utilizing Genisphere Array 350 Cyanine 3 and Cyanine 5 labeled oligodendrimers. Block-wise/print tip normalization and standardization across all arrays was performed using software adapted for our laboratory while cluster analysis was completed using the Longhorn Array Database (Killion et al., 2003). False Discovery Rate, T- and F-tests, and Partial Least Squares analyses (across time points or genotype) were completed and the results were deposited in a web-based database (see: https://trip.icmb.utexas.edu/cgi-bin/genedb.pl) (Berman et al., unpublished) for ease of sorting such a large amount of information. Although the database is password protected, anyone who wishes to have access to our unpublished results (total data sets of published results will be freely available) on this website may make a request to: bergeson@mail.utexas.edu.
Although numerous interesting candidate genes were identified as prioritized by level of significance, false discovery rate, and fit to specific patterns of expression, several general conclusions can also be made. Distinct brain regional differences in global gene expression are apparent by Cluster analysis (Fig. 1) and are more prominent, in general, than alcohol-induced expression changes. Significant alcohol responses are often low in magnitude (data not shown). Gene Ontology results indicate that no single molecular functional, biological process or cellular component pathway predominates alcohol-induced gene expression changes, but that numerous pathways each possibly playing a minor role are involved (The Gene Ontology Consortium, 2000). Of interest was that a number of genes (ESTs) with yet unknown function were found to be significantly regulated. Some are probably unidentified due to incomplete database information but BLAST searches for many did not result in identification beyond the original EST finding or chromosomal location to a genomic clone (Altschul et al., 1990). Also, approximately 1000 genetic differences in gene expression occur between the two inbred strains, C57BL/6J and DBA/2J, which validate differences previously found in other studies. In addition to the strain differences, which may represent “predisposition” genes, important alcohol-specific, alcohol-related sex differences, and regional brain differences were identified. For example, the hippocampus was clearly the most affected brain region as a consequence of chronic intoxication yet was shown to recover over time. A better understanding of gene expression related to the genetic components of alcoholism as well as alcohol-induced and sexually dimorphic neuroadaptation should increase the likelihood of developing better treatments for this disease of considerable importance.
Fig. 1.
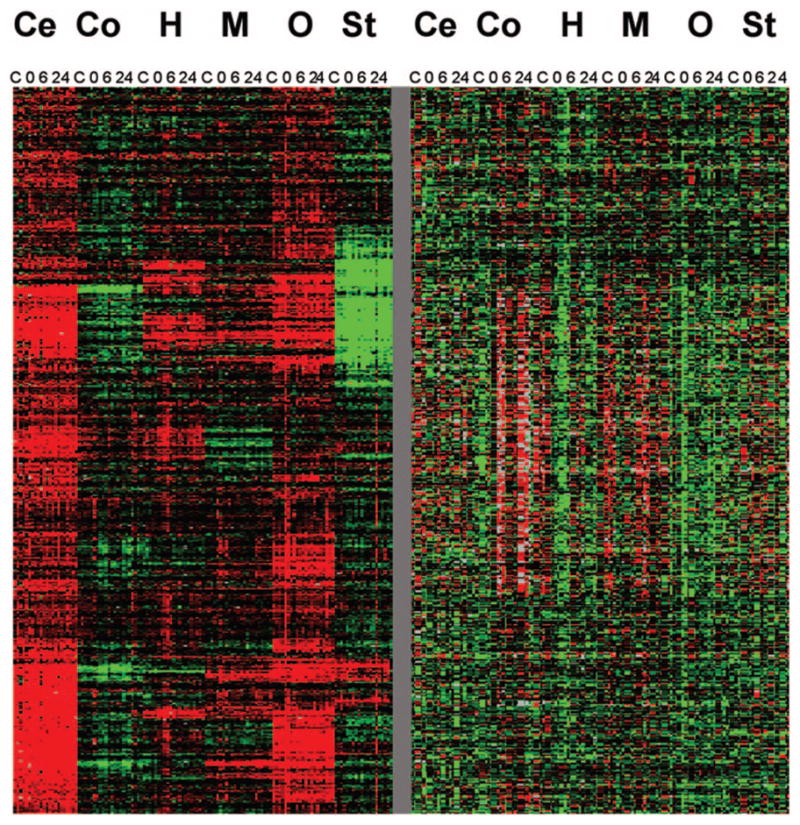
Cluster analysis generated using LAD (Killion et al., 2003) reveals greater diversity between brain regions than as a result of chronic alcohol treatment and withdrawal. The two sections are individual pieces of ~17,000 genes clustered, and represent a continuous analysis simply plotted in sections for ease of visualization. Ce, cerebellum; Co, cortex; H, hippocampus; M, midbrain; O, olfactory bulb; St, striatum; C, control (72 hr air inhalation only); 0, 72 hr alcohol inhalation, 6, 6 hr post withdrawal following 72 hr alcohol inhalation; 24, one day after removal from inhalation chamber.
ON THE INTEGRATION OF QTL AND GENE EXPRESSION ANALYSIS
Robert J. Hitzemann
Numerous quantitative trait loci (QTL) have been detected for ethanol preference and consumption. Belknap and Atkins (2001) performed a meta analysis of the available data and noted that in particular 4 QTL had been repeatedly detected either in the BXD recombinant inbred lines, in segregating populations formed from the C57BL/6J (B6) and DBA/2J (D2) inbred mouse strains, in short-term selective breeding (STSB) lines formed from the B6 and D2 strains and/or in congenic strains. The most prominent QTL were detected on chromosomes 2, 3, 4 and 9; cumulative LOD scores ranged from 7.4 to 15.5. Another well established feature of ethanol preference among laboratory mouse strains is that it is only the B6 strain or closely related strains that will consume relatively large quantities of ethanol e.g., > 12–16g/day (Belknap et al. 1993). These data suggest that it is likely that one or more of the preference QTL are associated with a “private” B6 allele. The question arises as how one can use these QTL and strain comparison data to move more efficiently toward detecting the underlying gene or genes.
One approach is to integrate these data with gene expression analyses. The premise of this approach is that at least some of the QTL for ethanol preference are generated by a difference in gene expression and indeed there are compelling results for other phenotypes to suggest that this is the case (Korstanje and Paigen, 2002). Three different gene expression datasets were used. The first of these was a brain gene expression dataset for the B6, D2, BALB/cJ (C) and LP/J (LP) inbred strains. Data were collected for whole brain, the extended amygdala and the striatum; the platform was the Affymetrix 430A array and position dependent nearest neighbor (PDNN) was used for the analysis. For the purposes of this summary only the whole brain data (N = 6 individuals/strain) will be described since it best illustrates the proof of principle. In addition, the focus will be on the Chr 9 QTL (cumulative LOD = 11.4); the boundaries of the QTL (30 to 80 Mb) were determined by a B6.D2 congenic strain which captured the QTL (Rasmussen and Hitzemann, unpublished observations). On the Affymetrix array there are a total of 429 transcripts. An analysis of variance revealed that 116 of these exhibited significantly different gene expression at a false discovery rate (FDR) of 0.01. Of this 116, ninety-seven were nonredundant. From this list we queried as to which transcripts showed a “private” B6 allele expression pattern (i.e., expression in the B6 strain was significantly different from the D2,C and LP strains and significantly different in the same direction). This final filter reduced the number of transcripts to 15; notably missing from the list were Drd2 and Ncam, genes which we and others had previously suggested to be associated with ethanol preference (Hitzemann et al. 2003). The total data reduction from this single filter was 97.5%.
A second independent filter for the expression data were the use of STSB lines. Animals were selected for HI and LO ethanol preference (2-bottle choice; 10% ethanol) from a B6D2 F2 population. After three generations of selection the lines differed significantly (p < 0.001) in consumption (9.4 vs. 1.8 g/kg/day). At S3 15males and females each from the HI and LO lines were used to prepare samples for gene expression analysis. For each line the samples from 3 animals were combined (N = 10 samples/line); males and females were not combined. Samples were hybridized to the 430 A array. Focusing again on the Chr 9 QTL and again using a FDR of 0.01, a total of 21 differentially expressed transcripts were found in the QTL region of interest; total data reduction was 95%. Combining the data from the inbred strain and the STSB analyses, we found a total of seven transcripts in common.
The final filter applied to the gene expression data involves cis and trans regulation of expression. In order for a difference in gene expression to generate a QTL, it follows that the gene must be cis-regulated i.e., when gene expression is used as the phenotype in a QTL analysis, a QTL should be detected at the gene locus. Given the precision of the measurements being made, we note that such cis-regulation must be considered only apparent in that the possibility that the gene expression is being regulated by a closely linked gene cannot be excluded. However, it should also be noted that the probability that an expression phenotype would map to the gene locus in essentially zero (Schadt et al. 2003). Thus, knowing which genes in a particular interval are cis-regulated should be an excellent filter in the process of integrating QTL and gene expression analyses. There is however, an important caveat to this approach. Consider the following example. A gene or genes within the QTL interval of interest have coding sequence polymorphisms which are not associated with differences in gene expression but which do affect the expression of unlinked genes. Thus, in addition to having a catalog of cis-regulated genes, it may well be equally valuable to have a catalog of trans-regulated genes (from the locus of interest). An example of where trans-regulation may be relevant to understanding an ethanol-related QTL is found in Hitzemann et al. (2004).
To develop a catalog of cis and trans-regulated genes in the brain, we began by examining brain gene expression in 56 B6D2 F2 animals (29 females and 27 males) formed from the reciprocal F1 hybrids. All of the transcripts were subjected to QTL analysis using R/qtl (Broman et al. 2003); the LOD threshold of 3.7 was determined by permutation test. Focusing on the Chr 9 interval of interest, there were 21 cis-regulated transcripts which exceed the nominal LOD threshold (430 A array). For some of the transcripts the LOD scores were quite remarkable. One transcript, Sc5d, had a LOD of >22 which translates into >97% of the variance in expression associated with the gene locus on Chr 9.
Adding cis regulation as the final filter, we found that four transcripts passed all filters: two known genes Sc5d (sterol-C5-desaturase) and Dibd1 (disabled in bipolar disorder 1 - predicted to encode a mannosyl-transferase) and two Riken clones. 9030425E11Rik has homology to the human gene CLMP which encodes a novel cell adhesion molecule; 1110032A03Rik encodes a gene of unknown function. Queries to the GNF SymAtlas (http://symatlas.gnf.org/SymAtlas/) confirmed that all four transcripts are expressed in brain, although none are strikingly enriched in brain. Sc5d which encodes a gene involved in cholesterol biosynthesis is perhaps of the most potential interest as local differences in cholesterol levels may affect the ability of ethanol to partition into membranes and interact with integral membrane proteins. However, at this time we interpret these data cautiously. One, data have been obtained only for the 430A array; additional transcripts may be added to the list when data from the 430B array are included and when multiple brain regions are queried. Two, at this time only one of the transcripts (Sc5d) has been confirmed by QrtPCR as being differentially expressed.
We also determined which transcripts are trans-regulated from the Chr 9 QTL interval. Eight trans-regulated transcripts (LOD >3.7) were detected. One of these transcripts, Nima, had a LOD score of 12.2, indicating that more than 50% of the transcript variance was associated with the Chr 9 locus. If we continue to follow the assumption that the Chr 9 locus is associated with a private B6 allele effect, then it follows that the trans regulated transcripts of importance to the preference phenotype should also show a private pattern of expression. None of the trans-regulated transcripts met this criterion.
Overall, these data argue it is possible to build a schema for interrogating gene array data which remarkably reduces the field of inquiry. Additional evidence to support the general elements of the strategy are found in Hitzemann et al. (2004); here it is of some importance to note that the integration of QTL and gene expression analyses correctly identified Mpdz as a candidate QTG associated with the Chr 4 QTL for acute ethanol withdrawal.
MICROARRAY AND PROTEOMIC ANALYSIS OF THE HUMAN ALCOHOLIC BRAIN
Joanne Lewohl and Peter Dodd
Chronic alcohol abuse produces persistent changes in brain function that are manifested as tolerance, physical dependence, craving, and other behavioral changes. These changes likely originate in alterations in gene and protein expression that in turn may underlie cellular adaptations (Anni and Israel, 2002; Nestler, 2000). Expression profiling in other diseases, notably cancer, has lead to improved pharmacotherapies (Okutsu et al., 2002; Taxman et al., 2003; Zembutsu et al., 2002).
Many neurological diseases exhibit characteristic, locally specific patterns of brain damage. Chronic alcohol abuse-induced damage has the added advantage for study that in general it does not exhibit idiosyncratic pathologic entities such as neuritic plaques or Lewy bodies. Rather, it is mainly manifested as cell loss and dendritic pruning (Harper, 1998; Storey and Tibshirani, 2003), and is mild in extent compared with the devastation seen in many neurodegenerative diseases. It provides an attractive model for studying selective cell loss in the human brain and a contrast with other diseases.
Our initial microarray experiments identified several groups of genes that were coordinately regulated in the frontal and motor cortices of chronic alcoholics, and include myelin-related genes, synaptic genes and regulator of G-protein signaling (RGS) genes (Lewohl et al., 2000; Mayfield et al., 2002). More recently we examined mRNA expression profiles in the frontal and motor cortices from 14 individual cases (seven alcoholics and seven controls) using high-density cDNA arrays (approximately 47,000 human clones, representing over 27,000 unique UniGene cluster IDs) (Liu et al., 2004). A total of 28 hybridizations were performed against a universal reference. The average number of features detected in each experimental group ranged from 30,061 to 33,820 per array. In the frontal cortex, significantly fewer features (~3,700) were detected in the alcoholic group than in controls. This trend was not observed in the motor cortex, suggesting that gene expression in the frontal cortex may be more sensitive to chronic alcohol abuse.
Differentially expressed transcripts included a group of seven genes belonging to the ubiquitin-proteasome system: ubiquitin-conjugating enzyme E2 liters 3 and ubiquitin-conjugating enzyme E2-like genes were both up-regulated. Down-regulated genes included F-box and leucine-rich repeat protein 2, F-box and leucine-rich repeat protein 3A, ring finger protein 14, ubiquitin specific protease 8, and ubiquilin 2. Components of the ubiquitin-proteasome system are essential for the regulation of synaptic transmission and plasticity (Speese et al., 2003; Zhao et al., 2003) and proteasome function is impaired in several neurological diseases (Cline, 2003). The latter system is also altered in the postmortem temporal cortex of alcohol abusers (Sokolov et al., 2003). Altered expression of components of this system in both brain regions studied suggests a universal impairment of ubiquitin-mediated protein degradation in human brain; dysfunction of this system may lead to impaired synaptic plasticity.
Hierarchical clustering was performed on differentially expressed genes to investigate individual variation in expression and the extent to which gene expression differentiates controls and alcoholic cases (see Liu et al. (2004) for gene selection criteria). Clustering of 793 differentially expressed genes in the frontal cortex completely distinguished all alcoholic cases from controls. In motor cortex, differentially expressed genes also distinguished between the groups, with the exception of one alcoholic case that clustered with the controls.
Approximately 25,200 genes were consistently expressed in at least five out of seven control and five out of seven alcoholic cases. These genes were selected for partial least-squares (PLS) analysis to derive linear combinations of gene expression ratios that covary maximally with a categorical variable coding alcoholic versus nonalcoholic samples. The loadings at the positive (lower in alcoholics than in controls) and negative (higher in alcoholics than in controls) tails of the ranked distribution represent the genes that best discriminate alcoholics from controls. To estimate the number of false positives, a q value statistic was calculated for all PLS loadings (Storey and Tibshirani, 2003). The q value is an index of the false discovery rate, in contrast to the traditional p value, which represents the false positive rate. A q value threshold of ≤0.001 was used to select 1,744 genes for further analysis.
The power of this set of genes to discriminate between controls and alcoholics is shown in Fig. 2A. The mean latent variable scores derived from the PLS analysis differed significantly between control and alcoholic cases. The magnitude of expression changes between control and alcoholic cases for this set of genes was approximately 20–50% (Fig. 2B) which is consistent with our previous microarray experiments using human brain (Lewohl et al., 2000; Mayfield et al., 2002).
Fig. 2.

A) Discrimination of Control and Alcoholic case groups. PLS latent variable scores summed across the 1,744 genes associated with q values < 0.001 (FDR). Individual latent variable scores are shown for control (filled) and alcoholic (open) cases. Horizontal lines represent the group means. B) Differential expression magnitude. Number of differentially expressed genes plotted as a function of percent change for 1,744 genes identified by PLS analysis with q values < 0.001.
SUMMARY
Several general conclusions emerged from the presentations that should lead to optimism regarding the use of expression technologies for alcoholism research. First, improvements to detection platforms and methods, and use of new or much improved bioinformatics programs have allowed transition of testing basic hypotheses and generation of simple lists of genes/proteins to analyses that uncover complex information regarding the genetic effects on alcoholism and/or alcohol’s specific effects on brain. Second, a recent trend toward lower costs for expression reagents has allowed scientists to include a greater number of samples in their experiments. In addition, more sophisticated statistical tests have become available and more widely used. Together, this has led to an increase in the power to detect real differences and an increased confidence that data generated will be directly useful to scientists outside the laboratories where the original experiments were completed. Finally, and probably most importantly, there is a general recognition that data sharing even prior to publication is valuable to the advancement of understanding the molecular genetics of alcoholism. Some of the presenters directly addressed how and where their data would, if not already, be made publicly available.
Although enthusiasm for global profiling of gene expression data is strong, discussion included making the point that gene expression in eukaryotes is not always directly related to protein concentration, something scientists finding “their favorite gene” changed in gene lists should be keenly aware. Having said that, global profiling of expression has clearly led to the generation of new hypotheses that simply would have been left untested without the use of these powerful new technologies. The hope is that with an increased sharing of data new ways of using old and new data will lead to the uncovering of undiscovered new “secrets,” which will undoubtedly result in a better understanding of the molecular mechanisms of alcoholism and ultimately improved treatment therapy.
Acknowledgments
Supported by NIAAA grants T32AA07471 (KHL), AA13182, AA13403, AA13475–INIA project, (SEB) and AA13518-INIA UT Microarray Core (R.A. Harris; HJE); AA07611, AA13521 (HJE); AA013484 (RJH); AA12404 and AA012725 (PRD). Financial support was also provided by NHMRC, (PRD) is an NHMRC Principal Research Fellow, and by EC grant QLRT-2001–01048 (WS).
The Brisbane Node of the National Health and Medical Research Council (NHMRC) Brain Bank provided the human brain tissue. The Center for Medical Genomics at Indiana University School of Medicine provided microarray facilities. We thank Sonja Webb for providing detailed information on the cases. We are grateful to the next of kin for informed, written consent.
References
- Anni H, Israel Y. Proteomics in alcohol research. Alcohol Res Health. 2002;26:219–232. [PMC free article] [PubMed] [Google Scholar]
- Altschul SF, Gish W, Miller W, Myers EW, Lipman DJ. Basic local alignment search tool. J Mol Biol. 1990;215:403–410. doi: 10.1016/S0022-2836(05)80360-2. [DOI] [PubMed] [Google Scholar]
- Arlinde C, Sommer W, Bjork K, Reimers M, Hyytia P, Kiianmaa K, Heilig M. A cluster of differentially expressed signal transduction genes identified by microarray analysis in a rat genetic model of alcoholism. Pharmacogenomics J. 2004;4:208–218. doi: 10.1038/sj.tpj.6500243. [DOI] [PubMed] [Google Scholar]
- Belknap JK, Atkins AL. The replicability of QTLs for murine alcohol preference drinking behavior across eight independent studies. Mamm Genome. 2001;12:893–899. doi: 10.1007/s00335-001-2074-2. [DOI] [PubMed] [Google Scholar]
- Belknap JK, Crabbe JC, Young ER. Voluntary consumption of ethanol in 15 inbred mouse strains. Psychopharmacol. 1993;112:503–510. doi: 10.1007/BF02244901. [DOI] [PubMed] [Google Scholar]
- Belknap JK, Hitzemann R, Crabbe JC, Phillips TJ, Buck KJ, Williams RW. QTL analysis and genome wide mutagenesis in mice: complementary genetic approaches to the dissection of complex traits. Behav Genet. 2001;31:5–15. doi: 10.1023/a:1010249607128. [DOI] [PubMed] [Google Scholar]
- Broman KW, Wu H, Sen S, Churchill GA. R/qtl: QTL mapping in experimental crosses. Bioinformatics 1. 2003;19(7):889–890. doi: 10.1093/bioinformatics/btg112. [DOI] [PubMed] [Google Scholar]
- Cline H. Synaptic plasticity: importance of proteasome-mediated protein turnover. Curr Biol. 2003;13:R514–516. doi: 10.1016/s0960-9822(03)00443-3. [DOI] [PubMed] [Google Scholar]
- Edenberg HJ, Strother WN, McClintick JN, Tian H, Stephens M, Jerome RE, Lumeng L, Li T-K, McBride WJ. Gene Expression in the Hippocampus of Inbred Alcohol-Preferring (iP) and -Nonpreferring (iNP) Rats. Genes, Brain and Behavior. 2005;4:20–30. doi: 10.1111/j.1601-183X.2004.00091.x. [DOI] [PubMed] [Google Scholar]
- The Gene Ontology Consortium. Gene Ontology: tool for the unification of biology. Nature Genet. 2000;25:25–29. doi: 10.1038/75556. [DOI] [PMC free article] [PubMed] [Google Scholar]
- Harper C. The neuropathology of alcohol-specific brain damage, or does alcohol damage the brain? J Neuropathol Exp Neurol. 1998;57:101–110. doi: 10.1097/00005072-199802000-00001. [DOI] [PubMed] [Google Scholar]
- Hitzemann R, Hitzemann B, Rivera S, Gately J, Thanos P, Shou LI, Williams RW. Dopamine D2 receptor binding, Drd2 expression and the number of dopamine neurons in the BXD recombinant inbred series: genetic relationships to alcohol and other drug associated phenotypes. Alcohol Clin Exp Res. 2003;27:1–11. doi: 10.1097/01.ALC.0000047862.40562.27. [DOI] [PubMed] [Google Scholar]
- Hitzemann R, Reed C, Malmanger B, Lawler M, Hitzemann B, Cunningham B, McWeeney S, Belknap J, Harrington C, Buck K, Phillips T, Crabbe J. On the integration of alcohol-related quantitative trait loci and gene expression analyses. Alcohol Clin Expl Res. 2004;28:1437–1448. doi: 10.1097/01.alc.0000139827.86749.da. [DOI] [PubMed] [Google Scholar]
- Killion PJ, Sherlock G, Iyer VR. The Longhorn Array Database (LAD): an open-source, MIAME compliant implementation of the Stanford Microarray Database (SMD) BMC Bioinformatics. 2003;4(1):32. doi: 10.1186/1471-2105-4-32. [DOI] [PMC free article] [PubMed] [Google Scholar]
- Korstanje R, Paigen B. From QTL to gene: the harvest begins. Nat Genet. 2002;31:235–236. doi: 10.1038/ng0702-235. [DOI] [PubMed] [Google Scholar]
- Kril JJ, Halliday GM. Brain shrinkage in alcoholics: a decade on and what we have learned. Prog Neurobiol. 1999;58:381–387. doi: 10.1016/s0301-0082(98)00091-4. [DOI] [PubMed] [Google Scholar]
- Lewohl JM, Wang L, Miles MF, Zhang L, Dodd PR, Harris RA. Gene expression in human alcoholism: microarray analysis of frontal cortex. Alcohol Clin Exp Res. 2000;24:1873–1882. [PubMed] [Google Scholar]
- Liu J, Lewohl JM, Dodd PR, Randall PK, Harris RA, Mayfield RD. Gene expression profiling of individual cases reveals consistent transcriptional changes in alcoholic human brain. J Neurochem. 2004;90:1050–1058. doi: 10.1111/j.1471-4159.2004.02570.x. [DOI] [PubMed] [Google Scholar]
- Mayfield RD, Lewohl JM, Dodd PR, Herlihy A, Liu J, Harris RA. Patterns of gene expression are altered in the frontal and motor cortices of human alcoholics. J Neurochem. 2002;81(4):802–813. doi: 10.1046/j.1471-4159.2002.00860.x. [DOI] [PubMed] [Google Scholar]
- McClintick JN, Jerome RE, Nicholson CR, Crabb DW, Edenberg HJ. Reproducibility of oligonucleotide arrays using small samples. BMC Genomics. 2003;4:4. doi: 10.1186/1471-2164-4-4. [DOI] [PMC free article] [PubMed] [Google Scholar]
- Nestler EJ. Genes and addiction. Nat Genet. 2000;26:277–281. doi: 10.1038/81570. [DOI] [PubMed] [Google Scholar]
- Okutsu J, Tsunoda T, Kaneta Y, Katagiri T, Kitahara O, Zembutsu H, Yanagawa R, Miyawaki S, Kuriyama K, Kubota N, Kimura Y, Kubo K, Yagasaki F, Higa T, Taguchi H, Tobita T, Akiyama H, Takeshita A, Wang YH, Motoji T, Ohno R, Nakamura Y. Prediction of chemosensitivity for patients with acute myeloid leukemia, according to expression levels of 28 genes selected by genome-wide complementary DNA microarray analysis. Mol Cancer Ther. 2002;1:1035–1042. [PubMed] [Google Scholar]
- Rimondini R, Arlinde C, Sommer W, Heilig M. Long-lasting increase in voluntary ethanol consumption and transcriptional regulation in the rat brain after intermittent exposure to alcohol. FASEB J. 2002;16:27–35. doi: 10.1096/fj.01-0593com. [DOI] [PubMed] [Google Scholar]
- Rimondini R, Sommer W, Heilig M. A temporal threshold for induction of persistent alcohol preference: behavioral evidence in a rat model of intermittent intoxication. J Stud Alcohol. 2003;64:445–449. doi: 10.15288/jsa.2003.64.445. [DOI] [PubMed] [Google Scholar]
- Schadt EE, Monks SA, Drake TA, Lusis AJ, Che N, Colinayo V, Ruff TG, Milligan SB, Lamb JR, Cavet G, Linsley PS, Mao M, Stoughton RB, Friend SH. Genetics of gene expression surveyed in maize, mouse and man. Nature. 2003;422:297–302. doi: 10.1038/nature01434. [DOI] [PubMed] [Google Scholar]
- Sokolov BP, Polesskaya OO, Uhl GR. Mouse brain gene expression changes after acute and chronic amphetamine. J Neurochem. 2003;84:244–252. doi: 10.1046/j.1471-4159.2003.01523.x. [DOI] [PubMed] [Google Scholar]
- Sommer W, Arlinde C, Caberlotto L, Thorsell A, Hyytia P, Heilig M. Differential expression of diacylglycerol kinase iota and L18A mRNAs in the brains of alcohol-preferring AA and alcohol-avoiding ANA rats. Mol Psychiatry. 2001;6:103–108. doi: 10.1038/sj.mp.4000823. [DOI] [PubMed] [Google Scholar]
- Sommer WH, Arlinde C, Heilig M. The Search for Candidate Genes of Alcoholism: Evidence from Expression Profiling Studies. Addiction Biology. 2005 doi: 10.1080/13556210412331327821. in press. [DOI] [PubMed] [Google Scholar]
- Speese SD, Trotta N, Rodesch CK, Aravamudan B, Broadie K. The ubiquitin proteasome system acutely regulates presynaptic protein turn-over and synaptic efficacy. Curr Biol. 2003;13:899–910. doi: 10.1016/s0960-9822(03)00338-5. [DOI] [PubMed] [Google Scholar]
- Storey JD, Tibshirani R. Statistical significance for genomewide studies. Proc Natl Acad Sci U S A. 2003;100:9440–9445. doi: 10.1073/pnas.1530509100. [DOI] [PMC free article] [PubMed] [Google Scholar]
- Taxman DJ, MacKeigan JP, Clements C, Bergstralh DT, Ting JP. Transcriptional profiling of targets for combination therapy of lung carcinoma with paclitaxel and mitogen-activated protein/extracellular signal-regulated kinase kinase inhibitor. Cancer Res. 2003;63:5095–5104. [PubMed] [Google Scholar]
- Terdal ES, Crabbe JC. Indexing withdrawal in mice: matching genotypes for exposure in studies using ethanol vapor inhalation. Alcohol Clin Exp Res. 1994;18(3):542–547. doi: 10.1111/j.1530-0277.1994.tb00907.x. [DOI] [PubMed] [Google Scholar]
- Trudell JR, Harris RA. Are sobriety and consciousness determined by water in protein cavities. Alcohol Clin Exp Res. 2004;28:1–3. doi: 10.1097/01.ALC.0000108648.32241.BD. [DOI] [PubMed] [Google Scholar]
- Zembutsu H, Ohnishi Y, Tsunoda T, Furukawa Y, Katagiri T, Ueyama Y, Tamaoki N, Nomura T, Kitahara O, Yanagawa R, Hirata K, Nakamura Y. Genome-wide cDNA microarray screening to correlate gene expression profiles with sensitivity of 85 human cancer xenografts to anticancer drugs. Cancer Res. 2002;62:518–527. [PubMed] [Google Scholar]
- Zhao Y, Hegde AN, Martin KC. The ubiquitin proteasome system functions as an inhibitory constraint on synaptic strengthening. Curr Biol. 2003;13:887–898. doi: 10.1016/s0960-9822(03)00332-4. [DOI] [PubMed] [Google Scholar]